The portents from China are not good. There are ominously titled news articles aplenty; the WSJ asked in August if a global recession is brewing in China. Wonkblog asks How China could trigger a global crisis:
When China sneezes, the rest of the world might not catch a cold, but it does feel bad for a couple of days. The question, though, is whether China is sicker than it seems and how contagious that would be for the global economy.
A common thesis is that the crisis in China forces a policy retrenchment that involves a yuan devaluation that in triggers a currency war. I don’t doubt that emerging market currency values hinge, in many cases, on the Chinese currency’s value, or alternatively, on commodity prices. It’s going to be difficult to parse out the effects on emerging market currencies between Fed tightening (see this post) from China’s slowdown.
Chinese Growth and Global Growth
I’ll take a slightly different approach – and that is to look at the increments to world GDP under different assumptions. That is, I’ll compare the forecasted increments using the October 2015 IMF World Economic Outlook ([1]) versus those assuming real growth is halved for 2016-2018. These two breakdowns are shown in Figures 1 and 2.
![[1]](http://www.imf.org/external/pubs/ft/weo/2015/02/images/Overview.jpg)
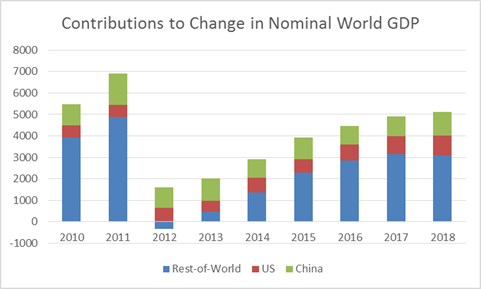
Figure 1: Increments to World GDP in billions of USD, at market exchange rates, from Rest-of-world (blue), US (red) , and China (green). Source: IMF, World Economic Outlook, October 2015 database, and author’s calculations.
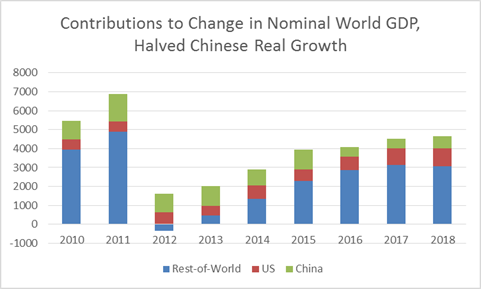
Figure 2: Increments to World GDP in billions of USD, at market exchange rates, from Rest-of-world (blue), US (red) , and China (green), assuming Chinese real growth is one-half that forecasted in WEO for 2016-18, but inflation and exchange rate forecasts are unchanged. Source: IMF, World Economic Outlook, October 2015 database, and author’s calculations.
The above mechanical calculations assume no spillover effects, i.e., the Chinese slowdown has no impact on rest-of-world growth. Clearly, if there are multiplier effects, then rest-of-world growth would be lower. This is not indicative of a global recession, but we are in uncharted territory.
Historical Precedents
As Kose and Terrones (2015) point out, all four global recessions after 1960 have involved the United States (although not all US recessions are global recessions). One can then ask if the China slowdown presages a new era in which global recessions are driven by Chinese fluctuations – much like the ascent of the US in the 19th century was signaled by the global impact of the Panic of 1857 (see e.g., here), and the subsequent recession. As Bordo and Landon-Lane note:
The 1857 crisis started in the US with the failure of the Ohio Life Insurance Company, leading to a stock market crash and banking panic. This crisis augured the importance of the United States in future global financial crises. Major banking panics also occurred in London and Germany.
Bordo and Landon-Lane further note:
… international financial crises since at least 1857 seem to occur when the US (the largest economy since the end of the nineteenth century) is involved. One strong possible reason for the U.S. involvement in global financial crises is that the US banking system has long been crisis prone.
The first observation prompts my comparison where relative GDP in 2015 and 1857 stood, in Figures 3 and 4, respectively.
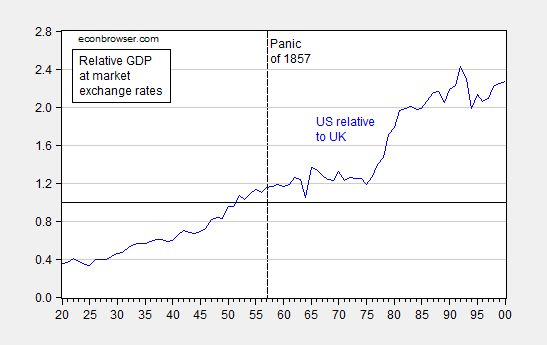
Figure 3: Ratio of nominal US/UK GDP at market rates (blue). Dashed line at 1857. Source: Measuring Wealth and author’s calculations.
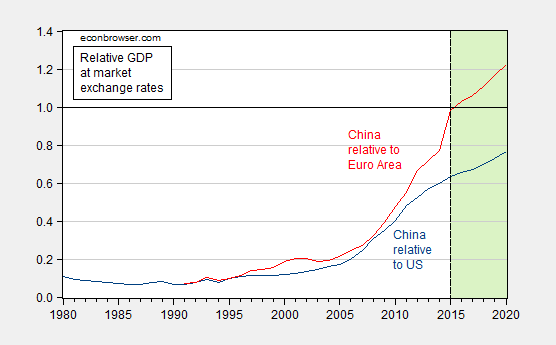
Figure 4: Ratio of nominal China/US GDP at market rates (dark blue), China/euro area (red). Dashed line at 2015. Forecasts shaded light green. Source: IMF World Economic Outlook October 2015 database and author’s calculations.
In other words, the US had overtaken the UK as the world’s largest economy when the Panic of 1857 sparked a global crisis. In contrast, China is overtaking the euro area, but has yet to surpass the US, at least at current exchange rates (PPP terms would yield a different result). This suggest (but does not prove) that a China-induced global recession is unlikely.
Bordo and Landon-Lane’s second observation suggests the importance of tight financial interlinkages as a key factor in crisis propagation (recent quantification, here). Here, the continued segmentation of the Chinese banking sector from the global financial system is important. Not only do capital controls segment the Chinese market. The highly regulated non-market oriented banking system further insulates the rest of the world from Chinese banking problems (in any case, China seems to have ample resources to recapitalize the banking system, should that prove necessary).
Obviously, China is linked to the rest of the world’s finances by way of being a net creditor, and holder of US Treasurys. So it’s not to say a severe crisis in China would not have negative impacts on the rest-of-the-world; rather it’s to say that the modes of transmission might be more of the old fashioned types – trade flows and commodity prices, and maybe interest rates.
A Final Caution on Forecasting China
Assessments for growth in China vary wildly. That’s partly because one’s assessments of growth prospects depend on views regarding government policies. If one views the government as committed to keeping growth above a certain threshold, then one is willing to countenence the possibility that authorities will sacrifice reform for continued stimulus, and short term growth will not collapse, even if longer term prospects might suffer. If one believes the government will hold true to a program of financial liberalization and rebalancing toward domestic sources of growth, then growth could very well fall far below the 6% in the short term. Count me skeptical of the latter outcome.
Professor Chinn,
This type of analysis is very much appreciated. Thanks!
One has to ask on what basis the actual economy of China is being assessed and forecasted. There has always been some level of skepticism about China’s economic statistics. To the extent that growth has been exaggerated, the impact on the world economies may be less than feared.
http://origin.www.uscc.gov/sites/default/files/Research/TheReliabilityofChina%27sEconomicData.pdf
http://www.economist.com/blogs/freeexchange/2015/07/chinese-economy
http://www.goldmansachs.com/our-thinking/pages/outlook-2016/index.html?videoId=140028
http://www.bloomberg.com/news/videos/b/1f5cc0ea-254b-4d91-a844-c02f820c8753
There was a major regime shift that began around the summer of 2014. The dollar started rallying and oil busted out to the downside and globally, commodities rolled over hard.
http://tinyurl.com/j9wuho2
Several important things happened globally in the capital markets around this time as well. Global credit growth in developed and emerging markets peaked and began decelerating:
http://tinyurl.com/h8r8sa3
Right around the same time, China’s foreign currency reserved peaked and capital began flowing out of China:
http://tinyurl.com/zr68dn6
Maybe worst of all, the glacial creep of China’s looming demographic debacle is getting closer and closer to the present date. It’s time to pay the piper for the inhumane one-child policy, which resulted in a demographic shortfall of at least 30 million young women in China and a resulting work force that peaks in the near-term and will likely shrink steadily for a long, long time afterward. Japan’s lost decade began in 1998 when their labor force peaked and the lost decade continued beyond 2008. And the Japanese labor force has decline steadily since 1998 – 18 years and counting.
http://tinyurl.com/hmmrzz9
China blew a devaluation in summer 2014. That simple, and you can see it clearly in Jim’s ICE model.
Rather than fixing the problem, the PBoC is trying everything else. I am frankly stunned at the incompetence. It makes Argentine central banking look prudent by comparison.
China needs to devalue the yuan to 7.0 to the dollar. And they need to do it now. Can China hold the current exchange rate? Sure, at the cost of $100 bn a month. Why would you want to do that when your export and manufacturing sectors are struggling? It’s ridiculous.
China can devalue at the pace of 1% each month, in which case the world will see six capital market crises in the next six months–exactly the pattern we’ve seen. Or it can devalue 6% in one go, and then we’ll have one crisis for one month, and presumably better export and manufacturing numbers a quarter hence. I don’t think this is a difficult call. The PBoC is trashing the China brand by pussyfooting around. Get it done and over with.
RE: “China needs to devalue the yuan to 7.0 to the dollar. And they need to do it now. Can China hold the current exchange rate? Sure, at the cost of $100 bn a month.” Assuming they need something like $2 trillion in reserves to operate their economy, they’ve got maybe a year at the current rate of depletion then they’re done.
I assume that the reason they’re not moving faster is that the step function move would be too hard on companies with dollar denominated liabilities.
I think there are both ideological and institutional reasons not to devalue. I think the Xi government is nationalist and likes a strong currency (very Republican, really). That was an impediment. Second, the Chinese had essentially pegged the yuan to the dollar, and breaking that institutional linkage is psychologically challenging. Institutions, whether Chinese or not, don’t just get up one day and say, “Hey, I have an idea. Let’s break the peg to the dollar.” That kind of decision prompts a lot of discussions and hemming and hawing and usually ends when the bankers hands are forced by the market.
Finally, I believe I am the only analyst to have attributed a strong dollar to the effects of shale oil on the US current account. The Chinese may not have appreciated facts the same way (the alternative explanation is a weak global economy with a flight to the dollar). In my opinion, that’s why the Chinese blew the devaluation window in late 2014. Note that there’s nothing especially Chinese about these factors. You can find similar mistakes elsewhere in the historical record (assuming I am correct, of course).
Now, every time the Chinese try to devalue, investors think the world is ending and the DOW sheds 1000 points and oil drops $10. So the Chinese are really not that keen to devalue, because they anticipate it will be ugly. Central bankers are not big on ugly–and there is nothing uniquely Chinese about that, either. So they are trying different approaches to see if they can do it with less trauma. Result: Trauma is no less, just protracted. So the conversation is going to go something like this: “We’ve tried small and sharp, and that didn’t work. We tried a small and gradual devaluation, and that didn’t work. So we have two choices: hold firm at the current rate and maybe bleed out; or we do a large and sharp devaluation and get it over with.” That’s what’s under discussion now, I would think. I am almost certain large-and-fast is the right course, but I’d point out that’s neither Chinese, nor technocratic nor central banker-type advice. It requires some guts, and central bankers with guts have a name: hedge fund managers. Courage does not come easily to institutions.
As for dollar denominated debt, that’s a credit, not exchange rate, problem. But let’s consider it anyway. A 6% devaluation should re-align the yuan with the won and yen. Thus, such a devaluation can explained and defended on some plausible grounds. In principle, it should be enough to stem the capital flight we’ve seen, at least for a while. So let’s assume that China has $1 trillion in US dollar debt. (I doubt they do.) A 6% devaluation would be worth $60 bn. It’s costing the PBoC $100 bn per month to defend the yuan, and of course, it’s not really been working. In short, a devaluation is still less expensive then trying to prevent a dollar debt issue. China needs to fix the problem at hand, and that appears to be a yuan misalignment.
Interesting article on Chinese oil imports:
http://www.bloomberg.com/news/articles/2016-01-13/china-imports-record-crude-oil-as-price-crash-accelerates-buying
I would be interested in Steven Kopits’ outlook for China’s oil imports in 2017 and 2018.
Should read: I would be interested in Steven Kopits’ outlook for China’s oil imports in 2016 and 2017.
Would China export that oil later at a higher price. What is the storage capacity and refining capacity.
The EIA expects China’s oil production essentially flat going forward. Thus, incremental demand would come from oil imports. The EIA estimates this at 300 kbpd / year.
Ordinarily, I would expect oil consumption to rise at GDP + 1-2% in China. So what GDP growth rate do you want to use?
If we assume the problem is only yuan overvaluation, then oil consumption growth (with a properly valued yuan) could be 8%, or 800 kbpd. If we assume 3% growth using a nationalist model, the growth could be the EIA’s estimate. If you’re assuming it all goes to hell there, then zero is a good number, at least over a three quarter period somewhere in there.
This is a great article, the analysis I have been looking for.
A few points:
1. Here is a link to a FRED graph showing how much of the decline in gas prices is about the increase in the US$:
https://research.stlouisfed.org/fred2/graph/?g=38fu
The appreciation in the US$ seems to only account for about 1/4 of the decline in the price of gas. In the US, gas has declined by about 35% since mid-2014. In other countries, trade weighted to the US$, the decline in the price of gas is still close to 25%.
2. The gas price collapse of 1986, and to a lesser extent the big decline in early 2006, were accoumpanied by a decline in the US$. A gas price decline does not automatically mean a US$ surge.
3. One test of Prof. Chinn’s analysis is to ask, “When the US was ascendant in the 20th Century, *HOW* did other countries “catch a cold?” For example, did European currencies appreciate? A quick look does not reveal any compelling evidence that currency appreciation in, e.g., the pound or the franc, played a consistent role. So, what were the waning signs of recession in Europe between WW2 and 2000?
It was another price bubble that busted. This time, though, the price bubble probably hurt the real economy while the paper boom in equities shot up.
on China’s imports of oil; there have been stories that they’ve reached their storage capacity and that tankers are achored offshore, waiting to unload…so how much they import going forward will be determined by how fast they can build additional storage..
the cited article says “China may start four additional strategic petroleum reserves this year as part of a plan to stockpile enough oil to cover 100 days worth of net imports by 2020”
US commercial storage is now over 480 million barrels vis a vis imports around 7.5 million barrels per dat and refinery usage at 16 million barrels per day…
The Great Condensate Con?
We have seen a large year over year increase in US and global Crude + Condensate (C+C) inventories. For example, EIA data show that US C+C inventories increased by 100 million barrels from late 2014 to late 2015, and this inventory build has contributed significantly to the sharp decline in oil prices.
The question is, what percentage of the increase in US and global C+C inventories consists of condensate?
Four week running average data showed the US net crude oil imports for the last four weeks of December increased from 6.9 million bpd in 2014 to 7.3 million bpd in 2015. Why would US refiners continue to import large–and increasing–volumes of actual crude oil, if they didn’t have to, even as we saw a huge build in US C+C inventories? Note that what the EIA calls “Crude oil” is actually C+C.
I frequently cite a Reuters article that discussed case histories of refiners increasingly rejecting blends of heavy crude and condensate that technically meet the upper limit for WTI crude (42 API gravity), but that are deficient in distillates. Of course, what the refiners are rejecting is the condensate component, i.e., they are in effect saying that “We don’t want any more stinkin’ condensate.” Following is an excerpt from the article:
U.S. refiners turn to tanker trucks to avoid ‘dumbbell’ crudes (March, 2015)
http://www.reuters.com/article/2015/03/23/us-usa-refiners-trucks-analysis-idUSKBN0MJ09520150323
My premise is that US (and perhaps global) refiners hit, late in 2014, the upper limit of the volume of condensate that they could process, if they wanted to maintain their distillate and heavier output–resulting in a build in condensate inventories, reflected as a year over year build of 100 million barrels in US C+C inventories.
Therefore, in my opinion the US and (and perhaps globally) C+C inventory data are fundamentally flawed, when it comes to actual crude oil inventory data. The most common dividing line between actual crude oil and condensate is 45 API gravity, although the distillate yield drops off considerably just going from 39 API to 42 API gravity crude, and the upper limit for WTI crude oil is 42 API.
In 2015, the EIA issued a report on US C+C production (what they call “Crude oil”), classifying the C+C by API gravity, and the data are very interesting:
https://www.eia.gov/todayinenergy/detail.cfm?id=23952
Note that 22% of US Lower 48 C+C production consists of condensate (45+ API gravity) and note that about 40% of US Lower 48 C+C production exceeds the maximum API gravity for WTI crude oil (42 API). The above chart goes a long way toward explaining why US net crude oil imports increased from late 2014 to 2015, even as US C+ C inventories increased by 100 million barrels, and I suspect that what is true for the US may also be true for the world, in regard to the composition of global C+C inventories.
Following is my analysis of global C+C production data versus estimated global crude oil production data, through 2014, using the available data bases:
Did Global Crude Oil Production Peak in 2005?
http://peakoilbarrel.com/worldwide-rig-count-dropping-again/comment-page-1/#comment-546170
How Quickly Can US Tight/Shale Operators Cause US C+C Production to Increase?
Because of equipment, personnel and financial constraints, in my opinion it is going to take much longer than most analysts expect for US operators to ramp up activity, even given a rising price environment.
Except for the 2008 “V” shaped price decline (which bottomed out in December, 2008), and the corresponding US rig count decline, the US (oil and gas) rig count has been around 1,800 to 2,000 in recent years. Note that it took about five years to go from around 1,000 rigs in 2003 to around 2,000 rigs in 2008, and it even took two years to go from around 1,000 rigs in 2009 to around 2,000 rigs in 2011.
And assuming a 15%/year rate of decline in existing US C+C production and assuming a 24%/year rate of decline in existing US gas production, the US has to put on line around 1.4 million bpd of new C+C production every year and around 17 BCF per day of new gas production every year, just to offset declines from existing wells. Based on 2013 EIA data, the estimated annual volumetric loss of production from existing US gas production exceeds the annual dry gas production of every country in the world, except for the US and Russia.
Incidentally, the Minimum Operating Level of US Commercial Crude + Condensate (C+C) inventories is probably about 270 million barrels.
Have Overcapacity, Will Unravel. If trade volume diminishes, liquidity dries up and leads to depreciated bonds, no?
Unless lowered energy costs facilitate economic activity, where is the moderating stimulus? Demographics? Um… No one-child left behind?
Since 1990, we have watched in awe: Inflation vs. deflation. One is ephemeral, the other is terminal. Is it just a matter of time until heat death?
Knowing the thermodynamic no-win scenario is upon us, we play the game, even if the break even point is beyond the pale. One hopes for a dose of good fortune amidst the turmoil. Not too much, mind you, just enough to add momentum to a lagging economy.
Maybe innovation will resuscitate the animal spirits, even against a backdrop of natural and man-made hazards… or… maybe because of those hazards!
As life’s citizens, we pursue continuity with an indomitable spirit while the inexorable march of progress slogs along, come thermal overload or hydrodynamic influx.
China’s economy is based on exports so China cannot pull down the world economy. China is not a cause of economic decline in the west. China is a victim of economic decline in the west.
I have heard that world exports are down to 1957 levels. This decline does not show up in GDP numbers when imports are also down. GDP reports on the difference while ignoring total trade.