Defenders of the Kansas and Wisconsin misadventures in supply side economics keep on pointing to North Carolina as the counter-example that proves tax cuts do prompt faster growth (e.g., [1] [2]). A quick look at the data provides the following observations: (1) North Carolina GDP growth has merely matched nationwide growth since 2013Q1, (2) NC GDP has just been revised downward so that 2015Q3 GDP is now 1.5% lower than previously thought, and (3) NC GDP is less than the counterfactual indicated by historical correlations with national GDP.
Here’s an example of a statement that asserts tax cuts at the state level (combined with spending cuts due to balanced budget requirements) are expansionary:
Clearly the case of North Carolina throws water on the idea that reductions in gov’t spending are, generally speaking, a drag on economic growth. You seem to want to focus exclusively on the case of Kansas and completely ignore NC. Why?
First, not so sure about the first assertion. On the second point, I agree I have not paid enough attention to North Carolina. Let’s remedy that by looking at actual data!
North Carolina and the US
While NC GDP growth has accelerated relative to pre-2013, that has been an acceleration to match roughly the growth rate experienced over 1997-2015 period, and hence to match the US growth rate. This is shown in Figure 1.
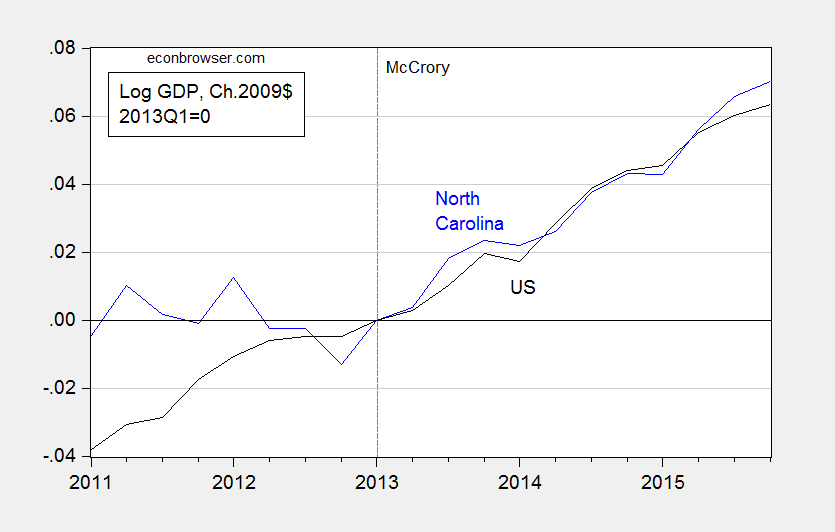
Figure 1: North Carolina GDP (blue), and US GDP (black), both in Ch.2009$, 2013Q1=0. Source: NC from state GDP release (June), and US from NIPA (2016Q1 2nd release).
Hardly a miracle. And there is more.
Revisions Take Off Some of the Gloss
In the latest release, quarterly GDP for North Carolina was revised downward perceptibly over the post-recession period. These downward revisions were particularly marked during the period starting from about mid-2013, right after Governor McCrory’s term began. This is shown in Figure 2.
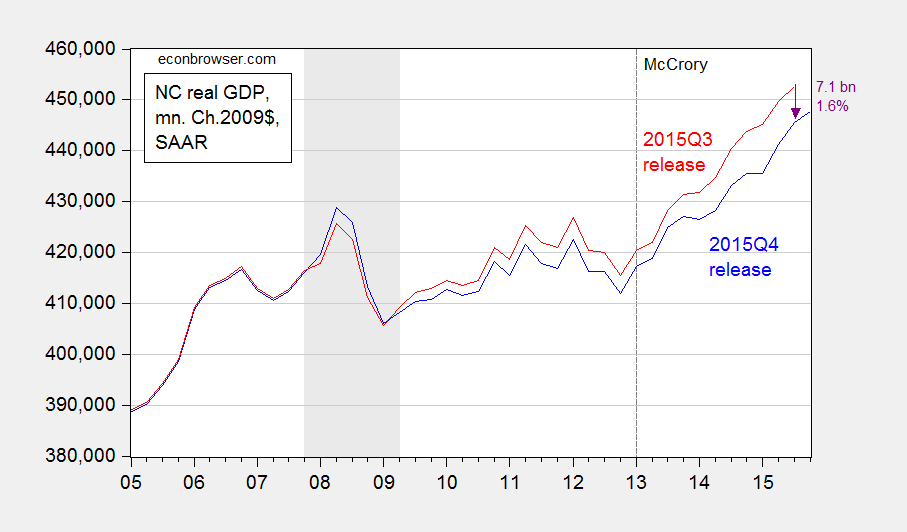
Figure 2: North Carolina GDP from 2015Q4 release (blue), and from 2015Q3 release (red). NBER defined recession dates shaded gray. Source: BEA and NBER.
North Carolina GDP in 2015Q3 has been revised downward by 1.6%, and over the 2013Q1-2015Q3 period was revised downward by 1.4% (in log terms).
Assessment against a Counterfactual
One way in which to more formally assess the impact of the policy framework implemented since 2013Q1 is to compare the actual outcomes, with respect to output, employment, income, etc., against a counterfactual. Following a procedure that I have used for Kansas [3], in terms of GDP, I retrieve data for 1997 to 2015, estimate the relationship between US and North Carolina GDP (incorporating a long run cointegrating relation), up to 2012, and then use the resulting equation to dynamically forecast out of sample the counterfactual. The estimated equation is:
(1) ΔyNCt = 0.419 – 0.142yNCt-1 + 0.148 yUSt-1 + 0.642ΔyUSt + 0.186 ΔyNCt-1 + ut
Adj-R2 = 0.39, SER = 0.0073, N = 62, DW = 1.84, Breusch-Godfrey Serial Correlation LM Test = 1.24 [p-value = 0.30]. Bold face denotes statistical significance at 10% msl, using HAC robust standard errors. y denotes log real GDP.
Figure 3 depicts the forecast, the actual and the 90 and 50 percent prediction intervals.
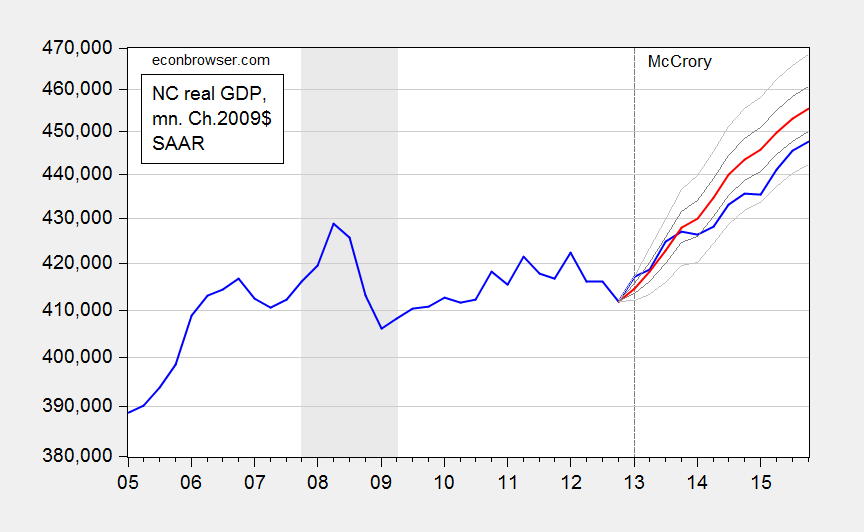
Figure 3: North Carolina GDP (blue), dynamic ex post simulation (red), 50% prediction interval (dark gray), and 90% prediction interval (light gray). NBER defined recession dates shaded gray. Source: BEA, NBER, and author’s calculations.
My calculations indicate that NC GDP as of 2015Q4 was 7.4 billion Ch.2009$ lower (SAAR) than that indicated by the level of US GDP. That is 1.6% (in log terms).
In contrast to my results for the case of Kansas, I cannot reject the null hypothesis that the level of GDP is within the 90% prediction interval. On the other hand, a less stringent 50% criterion suggests that the outcome is significantly worse than what we should have observed, based on the historical relationship between US and NC GDP.
Details of Estimation/Simulation
- Step 1. I extended backward in time NC GDP to 1997 by using quadratic interpolation applied to annual data, and splicing this GDP series to reported quarterly GDP series. This step was necessitated because I could not reject the null of no cointegration using only the 2005-2012 period data.
- Step 2. I apply unit root tests to log NC real GDP and US real GDP. They both fail to reject the ADF unit root tests (with constant, trend) at the 10% msl.
- Step 3. I apply the Johansen cointegration test (constant in cointegrating vector, VAR) with 1 lag of first differences (2 lags in levels), and reject the no cointegration null at 10% msl. I fail to reject one cointegrating vector in favor of two.
- Step 4. I estimate the error correction model (ECM) indicated in equation (1).
- Step 5. I use the estimated ECM to conduct an ex post historical simulation, i.e., taking as given the actually realized values of US GDP to forecast NC GDP. This yields the red line in Figure 3.
Conclusion
A consistent meme forwarded by those who persistently view North Carolina as a counterpoint to the Kansas situation is that tax cuts accompanied by spending cuts have failed to reduce NC GDP growth, and in fact spurred growth, counter to the austerity-cum-recession thesis. This observation is true for NC relative to pre-2013 growth. However, to the extent that economists are wont to use the ceteris paribus proviso, we should be comparing not against pre-shock growth rates, but against a counterfactual. And doing so suggests that the policies have not accelerated, but rather decelerated, growth.
The manner in which I constructed the counterfactual can surely be criticized. But at least I have provided one. Adherents of the ALEC-Laffer-Moore-Williams Weltanschauung have yet to provide a statistically founded alternative.
I like this blog its really very informative. Thanks for sharing.
Perhaps a one-tailed test should be applied?
While I’m certainly not an expert on tax policy, a look at the recent literature indicates to me that my skepticism about the negative effects of tax cuts on growth is warranted.
Again, I certainly agree that bold statements about the magical effects of tax cuts by Republicans are wrongheaded and that the implementation of tax cuts can go wrong. However, the literature seems clear that state taxes have either a negative effect on growth or none at all.
http://www.sciencedirect.com/science/article/pii/S0165176514004960
http://onlinelibrary.wiley.com/doi/10.1111/j.1465-7295.2008.00127.x/abstract
http://search.proquest.com/openview/f4ab03206b4108c65669af94d3ba86b2/1.pdf?pq-origsite=gscholar&cbl=41305
http://pfr.sagepub.com/content/38/4/409.short
http://citeseerx.ist.psu.edu/viewdoc/download?doi=10.1.1.697.5707&rep=rep1&type=pdf
http://www.jstor.org/stable/41790431?seq=1#page_scan_tab_contents
can you explain in rational terms why kansas was such an utter failure, and not lay blame on its austerity policies?
I’m not sure what “utter failure” means, but I’ve said several times here that implementation can go wrong. Politicians can certainly come up with the wrong way to do something that would otherwise be helpful.
Do you dispute the literature?
i am not disputing the literature, but i am noting a very clear economic experiment which occurred in kansas. austerity was implemented and growth was very negatively impacted. it appears as though the literature is at odds with the experiment. if you feel kansas is an outlier, can you explain why?
So then you can explain how implementation went wrong in the failed cases and was clearly different from implementation in those cases where things went the right way?
You are not just going to blame some mystery “implementation error” without any details, are you?
As I say, I’m not an expert on the topic of state-level financial issues. If I had to guess, I would say that this report probably gets it right.
Having a clear plan for how to reduce spending (which Kansas didn’t do… I don’t think a reduction in taxes without a commensurate reduction in spending can be termed “austerity”) and examining the ways in which different types of taxes (property, sales, income, corporate, etc) are likely to affect different groups *before* implementing the plan is important. There were a great many political factors that really screwed up the implementation of what was previously a better-thought-out plan. History is messy and, as the report linked above notes, some states were better able to handle reform simply because of political circumstances in play at the time of the reform.
The linked report say nothing about reducing spending – its all about what type of tax restructuring each state did. Nor is there anything to suggest that different states did a better or worse job of understanding what specific groups would be the winners and BIG winners of the reforms. That is fully understandable since most of these tax shuffles enrich the rich minority and take services away from the poor. One might say that North Carolina did a slightly better job at trying to reduce the regressiveness of their tax cuts. but that is not about implementation, its about design of tax cuts.
If I hand over money to the government, it will spend all of it, even on paying people to dig holes and fill them up again. What do I need money for? I would’ve just spent and saved it. Now, I don’t have to worry about that 🙂
And if government doesn’t collect any taxes at all we will become so prosperous that government will have all the money it needs.
See, I can do it too….
Phil, where did I make false assumptions like you?
Obviously, your understanding of economic implications are very limited.
So, we should cut government spending in some places and add government spending in other places to get more bang for the buck and justify taxes.
For example, if government raises my taxes $1, it will spend it. If it only receives $0.50 of (net) value, $1 is still counted as GDP.
If I kept that $1, I’d receive more value in a competitive market economy, even if I spent $0.80 and saved $0.20.
in equation 1, the superscript on the endogenous variable (i.e., left of the equal sign) s/b NC, not KS
marcel proust: Thanks! Kansas must be too much on my mind…
Regarding national economics, would the national economy be stimulated by dropping the corporate income tax rate to 15%? The goals being: increasing corporate investment, increasing hiring, repatriation of overseas cash and increasing equity values?
No the big lag right now is consumption. The companies are not in dire need of investment capital – they have a huge excess of cash because there are no need to increase production. The reason they have no productive investments (and instead use their cash on destructively purchasing their competitors to obtain monopoly power) is a lack of consumption. The only way to get GDP (which is 70% consumption) to grow is to either increase government consumption or to give tax cuts to the consumer class (poor) people – in either case the released money immediately gets into the economy (that is it has a high multiplier).
Levi,
the case of kansas is used to illustrate a point. there is a conservative doctrine out there that says tax cuts and spending cuts are the solution to the ails of the economy. nobody is really arguing that those policies cannot work, under the proper conditions. what people are arguing with the kansas example, is the policy was implemented as an ideology. when ideology dictates policy, the implementation will usually not be good. and we have much ideology in economic policy to this day. spending cuts and tax cuts can work, when implemented under the right conditions. spending cuts in a depressed economy is simply foolish-you cannot destroy aggregate demand and expect growth, unless you believe in the confidence fairy. it is this foolishness of ideology which prompts the kansas example over and over again. kansas was warned ahead of time, the economic policies would be a failure. they imposed them anyways. kansas was not an outlier, it produced an outcome consistent with economic models. but some in the economics field continue to discount those models even with the evidence at hand.