The BEA released quarterly state GDP figures today. As of 2015Q4, Kansas has just experienced two consecutive negative GDP growth, a distinction shared with only three other states — Alaska, Oklahoma and Wyoming (North Dakota experienced three quarters of negative growth, but experienced positive growth in Q4). Over the past five quarters, Kansas has experienced four quarters of negative GDP growth.
Figure 1 illustrates how Kansas economic performance measured on the broadest basis (GDP) fares against that of the United States as a whole.
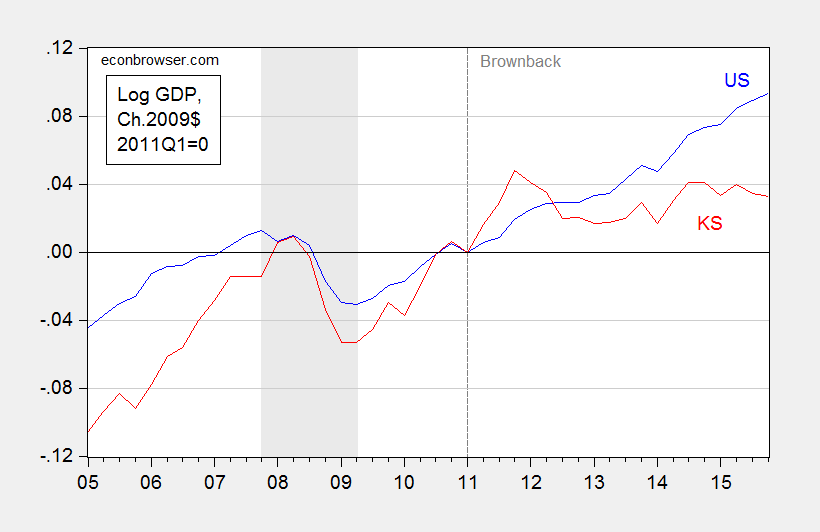
Figure 1: Log real GDP for US (blue), and for Kansas (red), all in Ch.2009$, 2011Q1=0. Dashed line at beginning of Brownback administrations. NBER defined recession dates shaded gray. Source: BEA, and author’s calculations.
It is of interest to note that prior to the Great Recession, Kansas was growing faster than the US. During the recession, it fell further than the Nation as a whole. And subsequently, it has been growing slower than the Nation, particularly post 2011Q1.
Is the deviation from pre-recession growth statistically significant? In order to answer this questions, one needs to establish the counterfactual of what would have happened if the historical relationship held. I do this formally be using the 2005-2010 period (2005 is the beginning of the quarterly state GDP series, 2010 is just before Governor Brownback begins his terms.) I use an error correction model involving Kansas real GDP, US real GDP (measured on the same basis as the Kansas GDP), and a variable to account for weather conditions in Kansas — the Palmer Drought Severity Index (PSDI) for Kansas. This particular specification implies that there is a long run cointegrating relationship between Kansas GDP and US GDP, and that drought has only a (statistically) short term impact on growth.
The estimated error correction model is:
(1) ΔyKSt = -7.26 – 0.29yKSt-1 + 0.65 yUSt-1 + 1.48ΔyUSt – 0.09 ΔyUSt-1+ 0.0016droughtt + ut
Adj-R2 = 0.53, SER = 0.0092, N = 22, DW = 1.87, Breusch-Godfrey Serial Correlation LM Test = 1.62 [p-value = 0.23]. Bold face denotes statistical significance at 10% msl, using HAC robust standard errors. y denotes log real GDP, and drought is the Palmer Drought Severity Index for Kansas (PDSI, lower is more severe). Regression results [PDF]. Data [XLSX].
The data used in this analysis (and for calculations in Figures 3 and 4) are here. Log Kansas and US GDP appear I(1) (fail to reject Elliott-Rothenberg-Stock unit root test) and Kansas PDSI (borderline) rejects a unit root.
Using this ECM to dynamically forecast out of sample in an ex post historical simulation (i.e., using realized values of US and Kansas GDP, and the drought variable), I find that (1) actual Kansas GDP is far below predicted (19.5 billion Ch.2009$ SAAR, or 14.8%, as of 2015Q4), and (2) the difference is statistically significant. This is shown in Figure 2.

Figure 2: Kansas GDP, in millions Ch.2009$ SAAR (blue), ex post historical simulation (red), 90% prediction interval (gray lines). Forecast uses equation (1). NBER defined recession dates shaded gray. Log scale for vertical axis. Source: BEA, NBER, and author’s calculations.
Why is Kansas lagging so much? Various individuals have pointed to the weather, aircraft manufacturing, and oil (since the original criticism by Prof. Russell has been deleted, see quotes in my post). In Figure 3, I show the contributions to state GDP growth, broken down into (i) agriculture, logging, hunting, fishing, (ii) durables manufacturing, (iii) mining, and (iv) rest-of-economy.
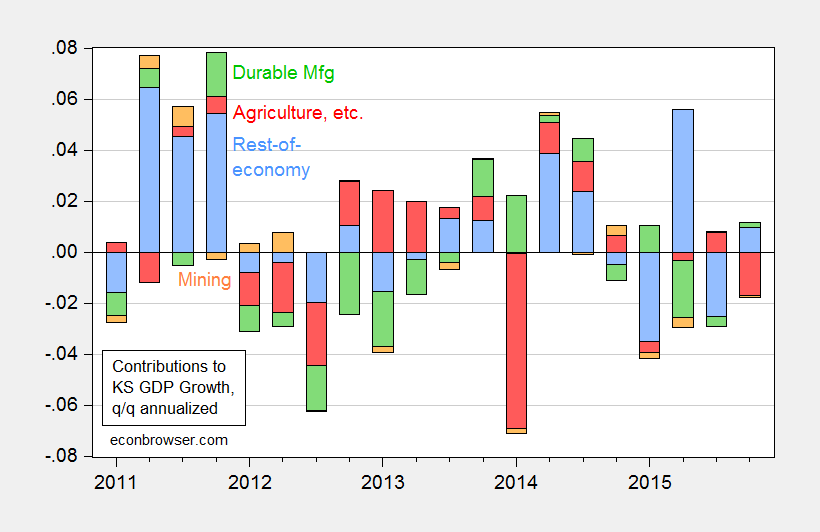
Figure 3: Contributions to Kansas real state GDP growth, from agriculture (red), durable manufacturing (green), mining (orange), and rest-of-economy (light blue). Source: BEA and author’s calculations.
Agriculture subtracted from growth in 2015Q4, and had an outsized impact in 2014Q1. However, it has added over most of the other quarters since 2011Q1. Of the cumulative output increase since 2011Q1, roughly one third is accounted for by agriculture. Note that mining (including energy extraction) can’t be claimed to be the culprit, since that category only accounts for a minimal negative contribution over the last year.
If none of the usual apologists’ suspects are plausible, then what might be the cause? One candidate is government spending on goods and services. In Figure 4, I plot real government spending by state and local authorities (this is a broader spending measure than used in this post), along with a 2005-2010 trend.
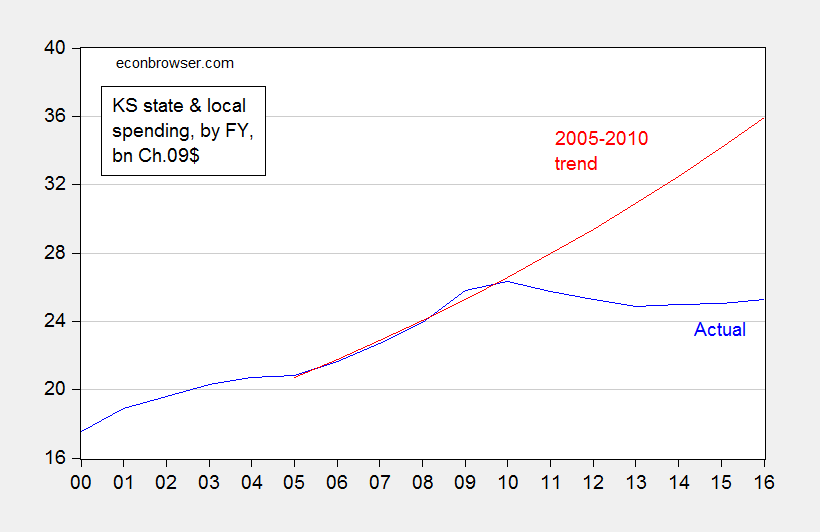
Figure 4: Spending by state and local authorities in bn. Ch.2009$, by Fiscal Year (blue), and log-linear time trend estimated from 2005-2010 (red). Nominal figures deflated using nationwide PCE deflator by Kansas FY; assumes 2016 inflation equals 2015 inflation. Note: Spending data is “estimated”. Source: US Government Spending website, BEA via FRED, and author’s calculations.
The shortfall as of FY2016 is about 10.6 billion Ch.2009$. The GDP shortfall as of 2015Q4 is about 19.5 billion Ch.2009$. The implied fiscal spending multiplier is about 1.8, holding constant tax cut effects. Taking into account tax cuts, the multiplier is smaller — although the extent to which it is depends on the composition of spending (transfers vs. purchases). In any case, 1.8 is not far from the conventional regional multiplier estimate of approximately 1.5 [1].
Update, 3:15PM Pacific: Given equation (1) contains nonsignificant coefficient on lagged growth in US income, it’s useful to see if the results change substantively when dropping that variable. The regression results remain largely unchanged, but the standard errors are slighty smaller, so the prediction interval is commensurately tighter. This is shown in Figure 5.
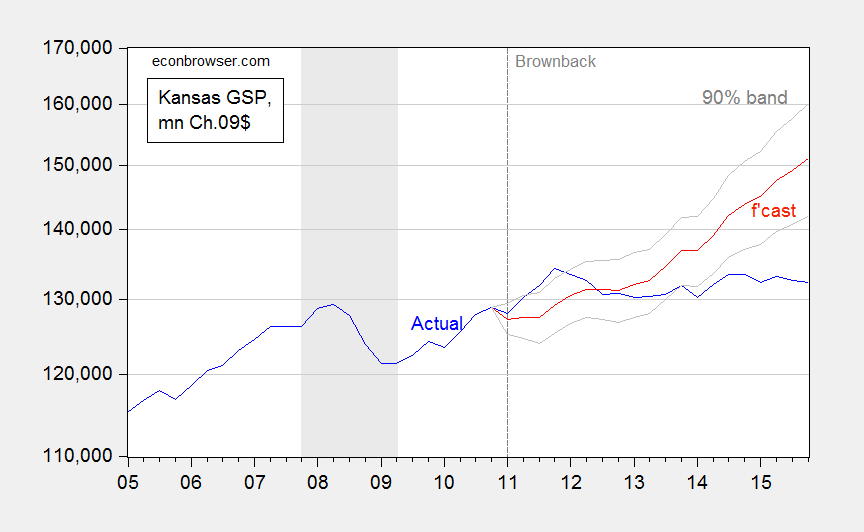
Figure 5: Kansas GDP, in millions Ch.2009$ SAAR (blue), ex post historical simulation (red), 90% prediction interval (gray lines). Forecast uses equation (1), dropping lagged first difference of US GDP. NBER defined recession dates shaded gray. Log scale for vertical axis. Source: BEA, NBER, and author’s calculations.
Update, 6/15 1:15PM Pacific: PeakTrader writes:
“…Kansas unemployment rate is at a historically low level and lower than before the “Great Recession.”
Well, national unemployment is just at the level before the Great Recession too. As a matter of fact, Kansas unemployment relative to US is just at the 1986-2011 average, after spending the past few months higher than the average.
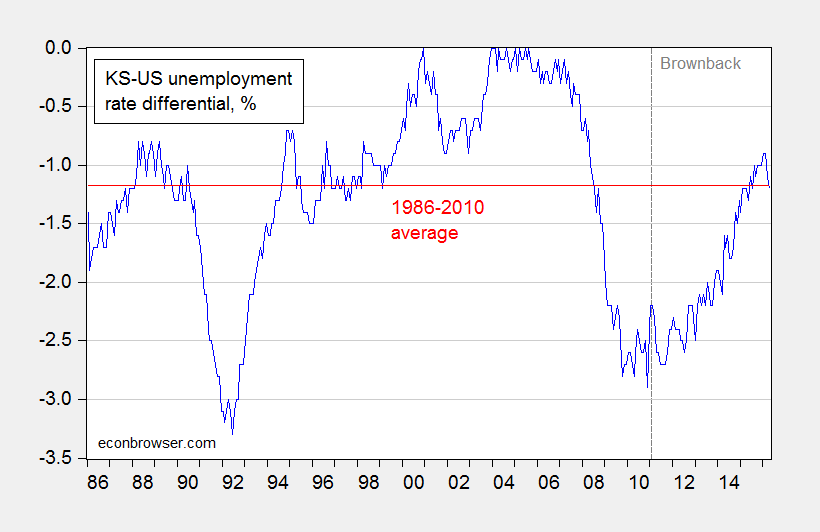
Figure 6: Kansas minus US unemployment rate, % (blue), and 1986-2010 average (red). Higher values mean higher Kansas unemployment relative to US. Source: BLS and author’s calculations.
Update, 6/21 12PM Pacific:
Reader Kien Tran asks what is the role of oil. In real terms, it’s not much, as shown in Figure 3 (mining category). Still, it might matter in nominal terms; hence I recapitulate Figure 3, but in nominal terms, in Figure 7 below. There is a big negative component associated with mining in 2015Q1, but not in the past two quarters.
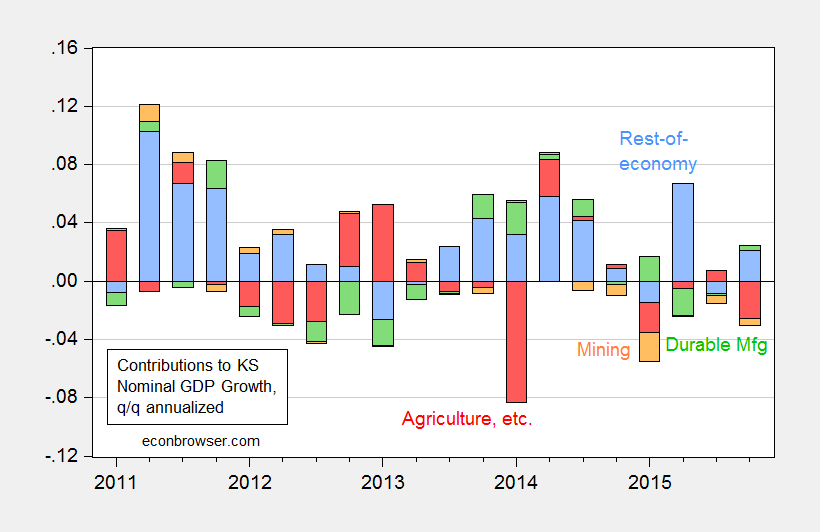
Figure 7: Contributions to Kansas nominal state GDP growth, from agriculture (red), durable manufacturing (green), mining (orange), and rest-of-economy (light blue). Source: BEA and author’s calculations.
Professor Chinn,
Would you consider sharing your EViews model so I can see what I seem to be doing incorrectly? I am not quite matching your equation.
AS: I’ve added links to results and data, just below description for equation 1. I omitted a first difference lag coefficient from the equation I wrote originally; that equation is now corrected. Now you should be able to replicate. Apologies for the oversight.
Professor Chinn,
Thank you. With the data change and the additional terms, my model agrees with yours. One more question: I have not used the Elliott-Rothenberg-Stock unit root test in the past. Would you consider showing the output for one of the unit root tests. I am not getting the correct result.
Thanks
Success! Now they will just have to cut more and they can be at zero in no time.
Maybe the citizens of Kansas are happy with the result? Maybe they want a government small enough to drown in the bathtub. They elected him twice so they must be happy with his policies.
No need to worry about government becoming too small. So, we should focus on the best places to cut spending and the best places to add spending, to reduce the enormous dead weight and lighten the tax burden.
so kansas leadership followed the prescription of austerity, and the result was further depression conditions. and so the fix is to further provide austerity, because that must be the ideological solution? kansas is a shining example of the failure of conservative economic policies in a downturn economy. it is possible some conservative policies have merit, but not when the economy is already struggling. you still have a lack of demand in kansas, and the economic policies have blown up the state revenue stream. it is time for the state to rethink its economic policy paradigm.
I think, the goal was to limit government and lower taxes. A more efficient government with higher disposable household income is a worthy goal.
For example, more efficient government output and greater private output can make GDP less expensive and slow GDP growth. However, living standards rise faster.
The downturn ended in 2009. The country is still in a depression, since the recession ended. Maybe, politicians of both parties were too optimistic about or in spite of Obamanomics.
“I think, the goal was to limit government and lower taxes. A more efficient government with higher disposable household income is a worthy goal.”
that is a worthy goal, but i do not believe that was the goal. the goal of the policies were an improved economy, the method was lower taxes and limited government. the method failed and the goal was not achieved. it should make you wonder if limited government and lower taxes really does achieve the outcomes you expect, in the manner you expect.
Kansas is such a red state that voters will not vote for any other party. I have seen many people run for office as Dem. and could not be elected dog catcher but, one they change party’s to Rep. then they are electable.
Interestingly, Kansas unemployment rate is at a historically low level and lower than before the “Great Recession.”
http://www.davemanuel.com/historical-state-unemployment-rates.php
PeakTrader: But the Kansas unemployment rate is on average lower than the US unemployment rate, by about 1.17 ppts over the 1986-2010 period. The KS-US differential has been higher than that over the past few months, and is as of 4/16 at the historical average. See Figure 6 added to the post.
Based on this: http://data.bls.gov/timeseries/LASST200000000000003?data_tool=XGtable
Kansas appears to be at “full employment”. This was an issue I raised previously which hasn’t really been addressed. So, I’ll ask again, given the demographics of Kansas (not a state with a desirable climate or significant natural beauty… unless you like wheat fields… and population fairly stagnant), are there not “practical limits” to employment and growth?
High tech firms are not going to move to Wichita from Happy Valley, er Silicon Valley. Manufacturing is not going to abandon the Great Lakes for trucking products to the Mississippi River. It’s pretty much a blah prairie state. Kansas State University reported:
Long term population decline
Two-thirds of KS counties had their population peak in
1930 or before
One-third of KS counties had negative net migration in
every decade since 1950
Only nine counties had population growth above the
national average between 2000 and 2010
◦ 19 others grew some, the rest declined
Only three rural counties grew more than 1% since
2000 (Stevens, Dickinson, Gray)
Demographics is destiny for Kansas. 2008-09 just gave it a little shove.
Additionally, Bruce, several other states have implemented tax reforms over the last several years. Some have performed well, others haven’t. Perhaps it’s the specific tax policies or the method of implementation. Who knows. Lowering taxes in and of itself doesn’t seem to be the issue.
http://mercatus.org/publication/case-studies-political-economy-state-tax-reform
the issue seems to be the policy and implementation of economic policy of brownback in the past few years. it is called austerity, and this real world example indicates it was not successful in the least.
So if austerity is itself the key factor, how do you explain the counterexamples I linked to above? I agree the implementation was bad and have roundly criticized the governor and legislature (despite Prof Chinn’s insistence that I’m some kind of “apologist”). In fact, North Carolina actually cut spending and has done quite well. How does this prove the case that austerity is bad?
Levi Russell: See this post.
Thanks Prof Chinn. It’s good to see that in the NC post you decided to refrain from name calling.
Again, though, I’m simply pointing out that skepticism of your conclusion that recent attempts at tax reform are 100% certainly the cause of poor economic performance is not warranted. It would be interesting to see your analysis of the other states mentioned in the link I provided above.
Levi Russell: As we have confirmed in our previous exchanges, I never called you any particular name. I did cast aspersion on the level of analysis embodied in your piece critiquing the analyses of Kansas by Krugman and myself (I would link to your post, but that post has been deleted), equivalent in tone in my view to your assertion that I was “spouting nonsense”.
I am willing to allow that (1) Kansas underperformance could be due to model uncertainty (although not at conventional levels), and/or (2) specification error, and/or (3) other confounding factors. However, I have attempted to rule those factors out as best one can. In contrast, all you have done is assert that I have not fully ruled out those factors, without providing any contradicting statistical evidence.
I fully agree that the empirical literature on tax effects is ambiguous. Moreover, not all tax cuts are equal — on that we agree. One relevant piece of information I have repeatedly cited in past posts is Kolko, Neumark and Cueller Mejia (2013).
I would say the Kansas “reform” was particularly ill-conceived in design, and the resulting revenue loss and associated spending cuts were almost assuredly going to lead to a drag on output. That is, after all, the implication of the Keynesian balanced budget multiplier. The other features of the Brownback agenda appear to have stifled whatever offsetting supply side effects would have occurred, particularly in terms of immigration and relocation of plant activities into the state.
Excuse me, I meant to say that skepticism is warranted.
I left another comment on the NC post you link to.
You called me an “apologist,” a term that 1) doesn’t apply to me, and 2) you clearly meant to be malicious. Admit it. Good grief, you’re digging through 60 days of my twitter feed now? That’s hilarious. It’s sad that I have to explain the difference between a criticism of one’s words and name calling, but here goes: if I had said “Chinn is a nonsense peddler and a shill” that would have been similar to you calling me an apologist. Basic logic. As I say, it’s good you’ve decided to stop with the name calling.
It seems we agree on more than I thought previously. The bulk of the recent literature I was able to find is quite clear: higher taxes are bad for growth. A few papers found no effect. If one is to draw any kind of conclusion, it would be that higher taxes are bad. It’s good to see you admit that.
Levi Russell: I think I see — it’s the word “apologist” that you object to. I’m not sure what a more appropriate word would be. You mentioned weather, aircraft, as reasons for why GDP might have been stagnant; if you think more appropriate, I am happy to term you “provider of excuses”. I must confess, the first synonym for “apologist” typically provided is “defender”, and if you are not a defender of the idea that tax cuts are not a cause of the downturn in Kansas, what are you?
I believe ceteris paribus, tax cuts stimulate growth in general. But at the state level, tax cuts are not typically cet. par. because of either balanced budget requirements, or the fact state governments are not able to borrow like other sovereigns. Then, a tax cut that is structured towards, let’s say high income groups, might have little impact on aggregate demand; or lump sum tax cuts might have no incentive effects, essentially forestalling supply side effects. Similar caveats can be made about the nature of government spending. That type of nuance is exactly what is highlighted in for instance the Kolko et al. paper.
Though I maintain that there’s a difference between name calling and criticism, I admit what I said was uncharitable. Please accept my sincere apologies. I’ve removed the tweet as a gesture of good faith.
Levi Russell: Thank you. I’ve edited accordingly the text in this post, and I too apologize sincerely for the use of the offending term. Let us move forward in a mission of reasoned discussion regarding the efficacy of tax cuts at the state level.
“If one is to draw any kind of conclusion, it would be that higher taxes are bad.”
levi, you seem to have taken the position that tax cuts cause growth. is that necessarily supported in the literature? and is the growth at the expense of increased deficits?
Apology accepted.
“I am willing to allow that (1) Kansas underperformance could be due to model uncertainty (although not at conventional levels), and/or (2) specification error, and/or (3) other confounding factors.”
I would only add that the best your analysis (and really any analysis of this type) can do is determine whether the tax cuts as implemented were correlated with growth. It can’t really tell whether the cuts are intrinsically to blame or if it’s an issue of implementation. All I’m asking here is that these issues be mentioned. Much of the left is making Kansas the “test case” for the way tax cuts affect growth, which I think you’ll agree is grossly unscientific. Such broad conclusions can only be drawn from more general analyses (such as the ones I mention below).
“In contrast, all you have done is assert that I have not fully ruled out those factors, without providing any contradicting statistical evidence.”
Well I did link to the case study above and several peer-reviewed articles here discussing the issue of state-level tax cuts and growth. This isn’t really high priority for me, I have too many other things going on. I only came back because of the “apologist” moniker. Water under the bridge though.
I hope you enjoy the rest of your break!
Baffling,
“levi, you seem to have taken the position that tax cuts cause growth. is that necessarily supported in the literature? and is the growth at the expense of increased deficits?”
I haven’t taken that position. Causation is a tricky concept and, as you imply, gov’t spending is really the ultimate decider of taxes over the long term. As I noted in this comment the literature seems to indicate that higher state taxes are a hindrance to growth. That’s the position I take. If the next round of 6 to 10 studies comes out the other way, I’m certainly happy to re-evaluate my position.
“higher state taxes are a hindrance to growth”
then tell me what constitutes high taxes. there is obviously a limit below which low taxes are negative for the state, because you cannot generate any revenue. you need to take a stronger position than higher state taxes are a hindrance to growth, because that is a very vague position which allows you to wiggle out of many uncomfortable situations. we already demonstrated that tax cuts in kansas were not revenue drivers. there you use the excuse of implementation, without support. its funny you question kansas when it fails to follow your ideology, but in the other cases where tax cuts and growth occurred, you did not even question if it was the tax cuts, or something else, which led to the growth. as you say, causation is a tricky concept.
Bruce,
I think you are spot on about the demographics – however Brownback stated that he had a plan for how to *grow* the economy, and he’s implemented it – and the results are in: It didn’t work – lowering taxes didn’t reverse the fundamental demographic trends, and it did worsen the economy! Case closed
How much was the Kansas economy affected by the drop of oil prices? The article wasn’t very clear (or maybe I missed it). In an economy mainly driven by the oil boom, one should not be surprised if it goes into recession when the price falls. Thus the “Deal with the Devil” which is oil. I can still hear everyone from 2000: Drill baby drill!
Kien Tran: Good question. I’ve added Figure 7 which expresses contributions to nominal GDP growth. Mining took a noticeable hit in 2015Q1, but has not subtracted measurably in the most recent two quarters.