The implications of the tradables sector, the dollar, and Fed policy.
The employment numbers released on Friday were re-assuring, especially in light of the previous week’s GDP figures. But can we rule out an ongoing or incipient recession?
Figure 1 depicts the series that the NBER Business Cycle Dating Committee (BCDC) has in the past focused on.
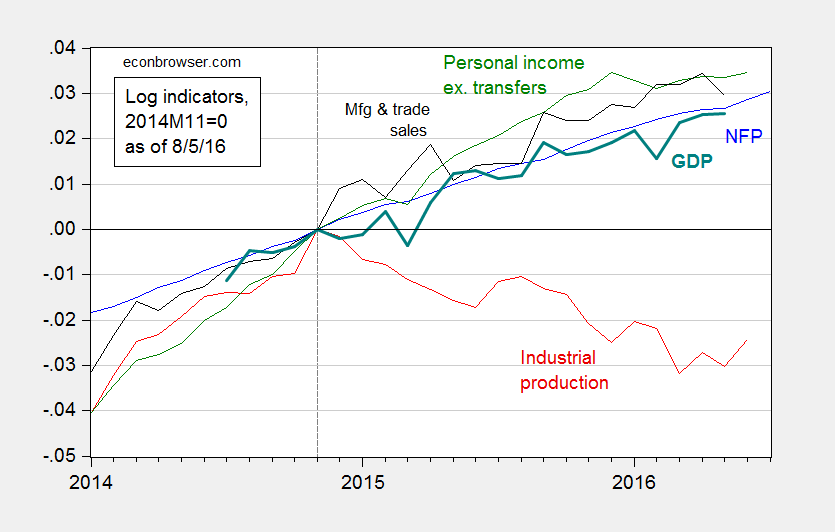
Figure 1: Log nonfarm payroll employment (blue), industrial production (red), personal income excluding transfers, in Ch.2009$ (green), manufacturing and trade sales, in Ch.2009$ (black), and Macroeconomic Advisers monthly GDP series (bold teal), all normalized to 2014M11=0, all as of August 5. Source: BLS (July release), Federal Reserve (June release), Macroeconomic Advisers (July 19), and author’s calculations.
All series have risen, save industrial production, since the IP peak in 2014M11. That decline is fairly marked, a 2.5% decline (in log terms). The initial read on June manufacturing and trade sales was also down.
Now, industrial production is less representative of overall output than it has been in the past. Nonetheless, it’s still a very important component. Value added in mining, utilities and manufacturing accounted for 19.2% of GDP in 1997, and still accounted for 15.4% in 2015. Hence, this drop is worrisome.
Why the decline? While manufacturing has not subtracted from industrial production, it has not added. Figure 2 shows the manufacturing production index (red line). The June 2016 value is the essentially the same as at the prior peak value in November 2014. (Manufacturing accounts for 12.1% of value added.)
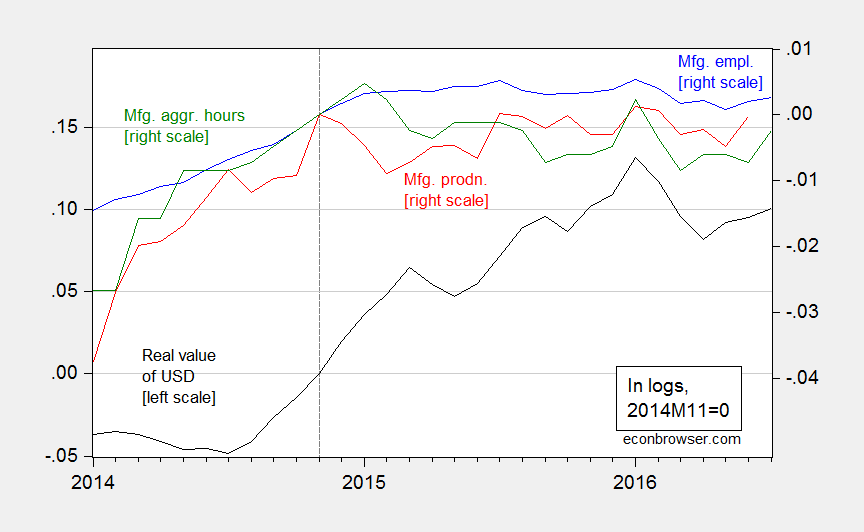
Figure 2: Real value of the US dollar against broad basket (black, left scale), manufacturing production (red, right scale), manufacturing employment (blue, right scale), aggregate hours index for manufacturing production and nonsupervisory workers, all in logs, 2014M11=0. Source: Federal Reserve Board, BLS, and author’s calculations.
The stagnation in employment and aggregate hours can be attributed, at least in part, to the 15% appreciation in the real value of the dollar since 2014M07. While the dollar is down since its recent peak, that decline is only 3%.
This is where Fed policy is of particular relevance. Fed funds futures indicate an 82% likelihood of a 25-50 bps level by September 21 [CME, accessed 8/8]. (18% is for a 50-75 bps.) To the extent that one of the few things we know moves the dollar is the interest rate (and expectations of future interest rates), further tightening seems ill-advised.
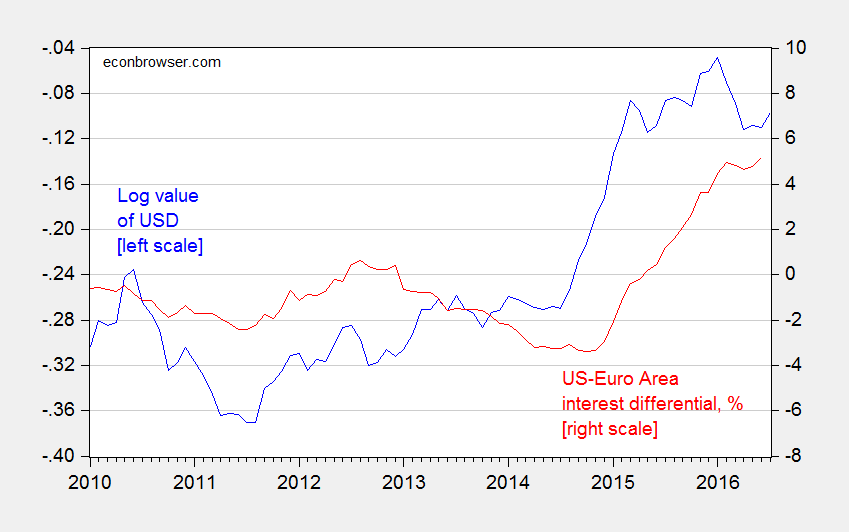
Figure 3: Log nominal value of US dollar (major currencies) (blue, left scale), and US-euro area interest differential, including shadow rates, % (red, right scale). Source: Fed, ECB, Wu-Xia, author’s calculations.
Update, 8/9, 11:30AM Pacific: PeakTrader doubts a quarter percent increase in the Fed funds rate will have much of an impact. I think any increase has to be taken in the context of previous increases in the shadow Fed funds rate.
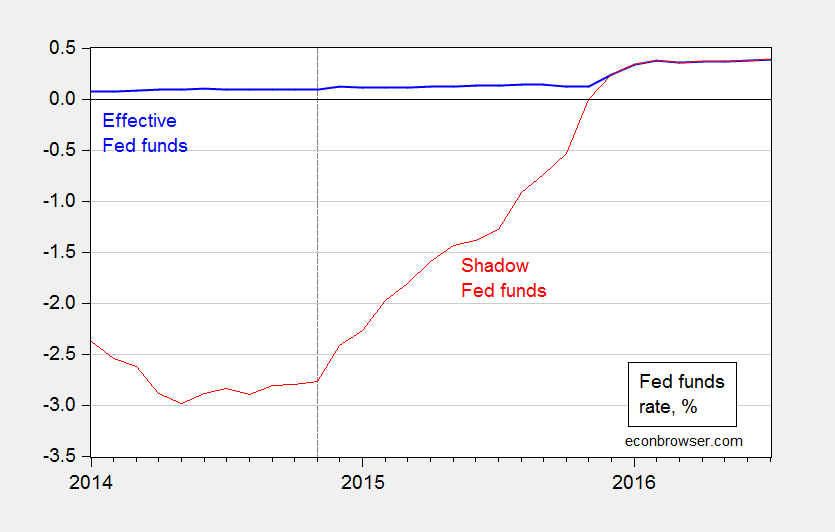
Figure 3: Effective Fed funds rate (blue), and shadow Fed funds rate (when below zero) (red), in %. Source: Fed and Wu-Xia.
Monetary policy has tightened by 3.16 percentage points since 2014M11.
We have another read on monthly GDP. Here is a graph of the some measures, including the official BEA measure.
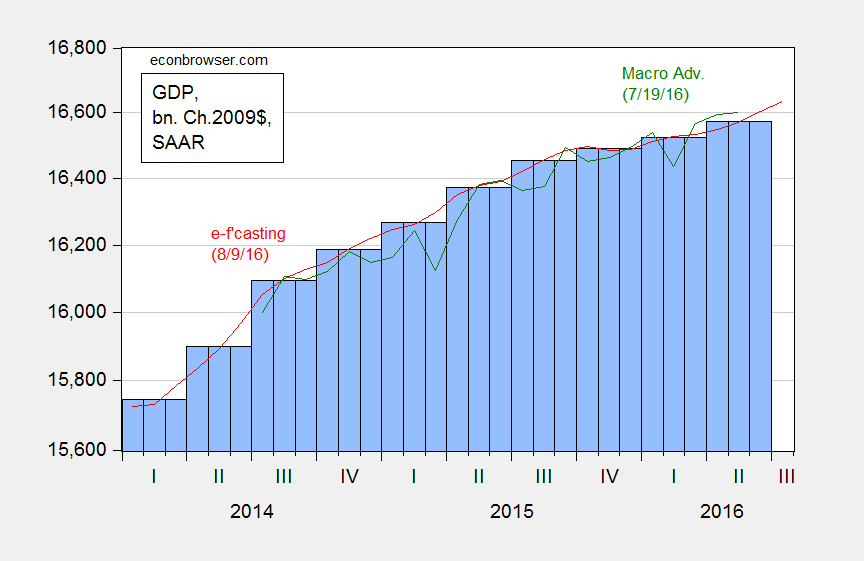
Figure 4: GDP from BEA advance release (blue bar), from Macroeconomic Advisers (green), and e-forecasting (red). Log scale. Source: BEA 2016Q2 advance release, Macroeconomic Adviser (7/19/2016), and e-forecasting (8/9/2016).
Hi,
Great Post. Very informative!
Look forward to more
There must be other factors weighing down the economy. After 2009, we had expansionary fiscal policy, the fracking boom, quantitative easings, and a weaker dollar. Yet, we had anemic growth. I doubt a quarter point change in the Fed Funds Rate, from a highly accommodative level, will make much of a difference.
Perhaps the mystery of the healthy economy/anemic economy can be visualized in this chart which shows how “record” vehicle sales are not-so-much. It’s aggregate numbers versus per capita. Aggregate, good; per capita, meh. It’s along the vein of H.R. Mencken who wrote, “The total population of the earth is growing; the total intelligence is constant.”
http://www.advisorperspectives.com/dshort/charts/indicators/vehicle-sales.html?Vehicle-Sales-Per-Capita-Index.gif
Money is cheap, oil is cheap, labor is somewhat cheap, so what is the problem?
Overly regulated economy. If we want a Clinton economy, we need to eliminate 90% of regulations passed since 1996.
“To the extent that one of the few things we know moves the dollar is the interest rate (and expectations of future interest rates), further tightening seems ill-advised.”
The Fed has been threatening imminent rate increases since 2009. This has been the great failure of the Bernanke and Yellen administrations. If anyone has been a drag on “confidence” it has been the Fed and its threat to choke off any recovery at the first sign of 2.000% inflation.
How can you conclude the Fed has been a failure for keeping the interest rate at zero for so long and with quantitative easings? The Fed deserves a lot of credit (pun intended) for doing its part to stimulate the economy.
Of course, the Fed finally raised the rate last year to 0.25%, which at this point in the business cycle is low, and continues to provide stimulus. Normally, the Fed would use “jawboning” to keep inflation expectations low and preempt accelerating inflation rather than raising the rate more after falling behind the curve. However, the rate hasn’t been raised much, which continues to provide stimulus.
If inflation gets out of control, then the Fed will lose “confidence.” A much higher interest rate, than otherwise, will be needed to slow inflation.
And, there hasn’t been “threatening imminent rate increases since 2009.” The Fed actually raised the Fed Funds Rate to 0.25% last year. Also, the Shadow Fed Funds Rate (shown in article) declined since 2009, although it began to rise in 2014.
Good post.
The decline in industrial production might explain the drop in productivity growth given the pro-cyclical nature of productivity indices.
As for tightening…. the Federal Reserve should continue tightening so the overnight rate is at or close to 1%. To leave rates as low as they are strongly signals that all is not well.
But then I am not a fan of dual-mandate monetary policy. Using monetary policy to solve structural economic problems and foreign policy blunders is risky.
You could make a pretty strong argument that manufacturing production is likely to accelerate in the coming year since inventory accumulation is running below the pace to keep steady with final demand growth. The rebound in the ISM manufacturing PMI is also encouraging. Will the Fed go in September? Probably not. But, I think the case you are laying out here is on pretty thin ice.
Neil: Sorry, what part of the case is weak? Is it the idea that growth prospects are not terribly bright? Or that the dollar’s appreciation is having a discernible negative effect on the tradables sector?
Focusing on manufacturing in particular while ignoring everything else seems odd. Don’t you take any signal from the fact that core inflation has been largely stable despite the significant appreciation in the USD that you lament? To me, it implies there is room for core inflation to rise now that the USD drag has eased up. “Growth prospects are not terribly bright” and yet the labor markets remain pretty tight and there is a reasonable case to be made for continued tightening. It seems to me like you are fighting the last war. I will go out on a limb and say manufacturing output will be reasonably healthy in H2 2016 as inventories build an final demand remains healthy.
A few casual observations: Total vehicle sales (TOTALSA) seem to have peaked in October 2015 and now seem to show a decline similar to INDPRO, while retail sales (RSAFS) and total non-farm employment (PAYEMS) seem to continue on an upward trend.