From CNNMoney, President Trump:
“With Mexico we have $70 billion in deficit. … It’s unsustainable. … We’re not going to let it happen, can’t let it happen,”
Here is actual data on the US-Mexico trade balance:
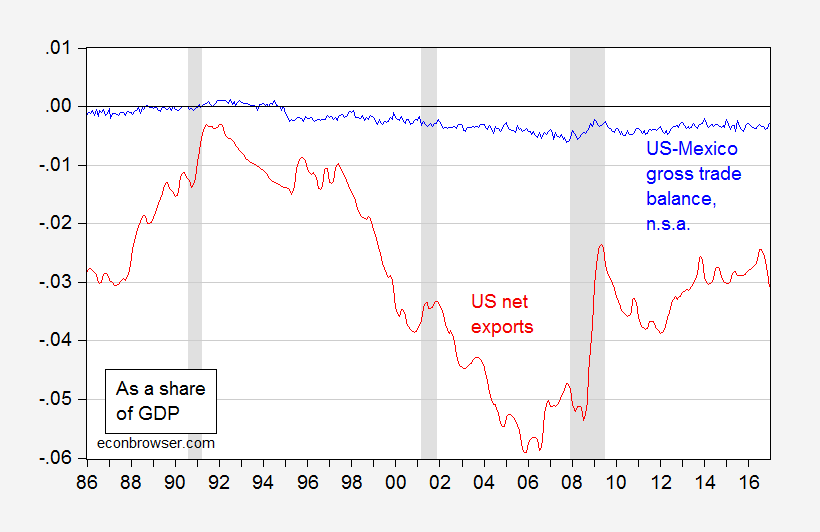
Figure 1: US-Mexico goods trade balance, n.s.a., as share of nominal GDP, interpolated (blue), and net exports of goods and services as share of nominal GDP, both interpolated (red). NBER defined recession shaded gray. Source: BEA, GDP 2016Q4 advance, and trade release for December 2016, and author’s calculations.
To further elaborate on the (relative in)significance of the imbalance, note that the balance in value added is even smaller.
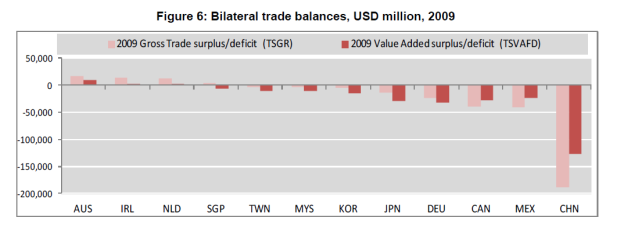
Source: OECD/WTO Trade in value Added (TIVA) Indicators: United States.
The US-Mexico trade deficit in value added is noticeably smaller than the gross trade deficit.
This infographic highlights the deep integration of Mexican producers into the North American supply chain.
Some back of the envelope calculations of the impact of some proposed measures here.
It is kind of curious that all your libertarian trolls have become white economic nationalists and protectionists overnight. The Alpha Chief’s orders to his tribe must be obeyed.
A technical point, I wonder how much of the trade deficit with Mexico is oil and gas imports?
At the end, Trump is amazingly stupid.
Same things happened at blogs like Marginal Revolution and Reason, to name just 2 that I visit from time to time. It is fascinating.
$70 B (trade deficit) versus the gross trade deficit as a percentage of GDP is not a good example of the “actual data”.
What is good for the goose is good for the gander.
Erik Poole: I’m not sure what your point is. Both the US-Mexico deficit and the net exports are expressed as a proportion of GDP in the graph… that’s a very standard normalization.
Menzie Chinn: You lead with Trump’s tweet.
In Trump’s tweet, the cardinal amount of $70 Billion is given, not a percentage or some other index or ratio.
Erik Poole: So would you be happier if I reported the 2016 US net export figure in dollars as well? It’s $500 billion.
Remember, the trade deficit is determined by the gap between domestic savings and domestic investments with the federal deficit counted as negative savings.
Since Reagan in 1980 the single most important driver of the domestic savings-investment deficit is the federal deficit which in turn has been dominated by Republican tax cuts.
As long as the Republicans continue to create large federal deficits the trade deficit with Mexico is sustainable.
Just as an aside, in all the discussions of the border adjustment tax I have seen no discussion of the impact of the tax on the federal deficit and in turn on the savings-investment gap. When I take this into consideration, I find that the impact of the border adjustment tax on the dollar is indeterminate.
I think, Republicans want a balanced budget amendment, at least in the ’90s.
The U.S. became an open economy after 1980 and had much stronger growth. Consequently, trade deficits increased. Trade agreements and policies benefited foreign producers and U.S. consumers. Lower taxes and less regulation helped spur growth. Taxes have been raised and lowered, since 1980, in expansions and recessions.
Trade deficits increased when we had budget surpluses in the 1990s and decreased when we had huge and persistent budget deficits in the 2010s.
We needed big tax cuts rather than a housing bubble and a depression, since 2000, to “refund” U.S. consumers to allow the spending to go on. So, the U.S. could continue to consume more than produce at full employment in the global economy and in the long-run.
Hate to rain on your use of alternative facts, but from 1950 to 1980 US real GDP growth averaged 3.5%. From 1980 to 2010 — the next 30 years –real GDP growth averaged 2.7%.
If you can not even get this right, why should we pay attention to anything you say?
You don’t dispute anything I stated. Rather you just give GDP growth data, which doesn’t explain anything. Where did I give wrong GDP data? Here are some facts about U.S. GDP: From 1950 to 1980, per capita real GDP averaged 2.28% a year, and during the height of the Information Revolution, from 1982 to 2007, per capita real GDP averaged 2.30% a year. However, it should be noted, from 1950 to 1980, there were two major wars, not including the Cold War, the economy was much smaller (smaller economies grow faster), and there weren’t huge trade deficits (up to 6% of GDP), which subtract from GDP. Moreover, after WWII, U.S. production, as a share of global production, was much higher, till the ’60s, while Europe and Asia rebuilt. U.S. living, labor, and environmental standards are much higher today than the 1970s.
When it comes to comparing the US economy over long periods of time, from say the post-WW2war era as compared to the period after 1970, or when it comes to comparing the economy of the Obama tenure to that of the Reagan or Clinton presidencies, using GDP figures, whether per capita or not, all seems rather pointless. The US has been slowly but surely transforming into a less and less productive economy, with more and more wealth not applicable to GDP. During Obama’s presidency for example, GDP numbers were of course weak, but with more than 50% of the population directly benefitting from the rapid growth of asset values during that time, and with an unprecedented number of households deferring income while waiting for a better return before selling those assets, many trillions of dollars in wealth accrued without being applicable to GDP, and a record amount.
Anyway, it seems that as the US economy shifted gradually from one type to another, a different system for measuring broad gains overall was needed but not forthcoming.
GDP growth doesn’t measure improvements in living standards accurately. We’ve seen high GDP growth in China. Yet, improvements in their living standards are much slower.
In the U.S., since 1980, GDP growth doesn’t fully capture the tremendous improvements in living standards. The Information Revolution, where the U.S. leads the rest of the world combined (in both revenue and profit) helped create tremendous wealth and doubled the affluence class (now representing 20% of households). The material well being of Americans, along with important standards, improved substantially.
Also, I may add, is a good like the microwave oven reflected in GDP accurately? Right after the microwave was invented, it was expensive, heavy, didn’t last long, and had few features. Now, they’re very cheap and the quality improvements have been tremendous.
Rising riches: 1 in 5 in U.S. reaches affluence
December 6, 2013
“New research suggests that affluent Americans are more numerous than government data depict, encompassing 21% of working-age adults for at least a year by the time they turn 60. That proportion has more than doubled since 1979.
Sometimes referred to by marketers as the “mass affluent,” the new rich make up roughly 25 million U.S. households and account for nearly 40% of total U.S. consumer spending.
In 2012, the top 20% of U.S. households took home a record 51% of the nation’s income. The median income of this group is more than $150,000.”
James Fallows studied American history and literature at Harvard, where he was the editor of the daily newspaper, the Harvard Crimson. From 1970 to 1972 Fallows studied economics at Oxford University as a Rhodes scholar.
January/February 2008
“Through the quarter-century in which China has been opening to world trade, Chinese leaders have deliberately held down living standards for their own people and propped them up in the United States. This is the real meaning of the vast trade surplus—$1.4 trillion and counting, going up by about $1 billion per day—that the Chinese government has mostly parked in U.S. Treasury notes. In effect, every person in the (rich) United States has over the past 10 years or so borrowed about $4,000 from someone in the (poor) People’s Republic of China.
Any economist will say that Americans have been living better than they should—which is by definition the case when a nation’s total consumption is greater than its total production, as America’s now is. Economists will also point out that, despite the glitter of China’s big cities and the rise of its billionaire class, China’s people have been living far worse than they could. That’s what it means when a nation consumes only half of what it produces, as China does.
Neither government likes to draw attention to this arrangement, because it has been so convenient on both sides. For China, it has helped the regime guide development in the way it would like—and keep the domestic economy’s growth rate from crossing the thin line that separates “unbelievably fast” from “uncontrollably inflationary.” For America, it has meant cheaper iPods, lower interest rates, reduced mortgage payments, a lighter tax burden. The average cash income for (Chinese) workers in a big factory is about $160 per month. On the farm, it’s a small fraction of that. Most people in China feel they are moving up, but from a very low starting point.
This is the bargain China has made—rather, the one its leaders have imposed on its people. They’ll keep creating new factory jobs, and thus reduce China’s own social tensions and create opportunities for its rural poor. The Chinese will live better year by year, though not as well as they could. And they’ll be protected from the risk of potentially catastrophic hyperinflation, which might undo what the nation’s decades of growth have built. In exchange, the government will hold much of the nation’s wealth in paper assets in the United States, thereby preventing a run on the dollar, shoring up relations between China and America, and sluicing enough cash back into Americans’ hands to let the spending go on.”
Peak,
From the Wiki page on ‘Triffin Dilemma’:
“In the wake of the financial crisis of 2007–2008, the governor of the People’s Bank of China explicitly named the Triffin Dilemma as the root cause of the economic disorder, in a speech titled Reform the International Monetary System. Zhou Xiaochuan’s speech of 29 March 2009 proposed strengthening existing global currency controls, through the IMF”
What is a conversation about the persistent trade deficit without a mention of the Triffin Dilemma? Americans trade paper assets for actual goods and then complain about the arrangement, lol.
Peak,
Yea, GDP is not very telling when it comes to living standards. The median income figures can also be misleading however. The net worth of US households and non-profit organizations had nearly doubled by Q4 2015 ($86.8 trillion) from a starting point in Q1 2000 of $44.2 trillion.
Naturally, the net worth of the top 1% has been growing faster than it should, but we hear so much about this inequality that it is easy to miss the fact that about 10% of the population has a net worth of over a million dollars. And the average net worth of the decile between 80% to 90% was $428, 000 as of 2013. Compare that to the $150, 000 that you provided for median income, combined with how fast net worth numbers have been rising since 2009, and the common notion that there is split between the 1% and the 99% becomes folly. A more telling notion being that about 25% of households are rich and getting richer.
Peak Trader, if things have been as great as you say could you explain how all those middle income, working people decided to take a chance on Trump? I find that the best argument against your alternative facts.
Spencer, excessive regulations, including Obamacare and Dodd-Frank, made the middle class poorer. Also, many Americans lost high-paying manufacturing jobs and ended up with low-paying service jobs, e.g. in retail. Given Obamacare made the middle class pay too much for health care, they had less discretionary income, e.g. for retail goods. Dodd-Frank helped lower the homeownership rate to a 50 year low last year and had a huge negative impact on small business loans. Fortunately, we had the fracking boom. Otherwise, it would’ve been even worse. The country has been in depression, since the recession ended in 2009. We need more pro-business and fewer anti-business policies. That’s a major reason why Trump won. It doesn’t argue against my prior statements, which you call “alternative facts.” The long boom, from 1982-07, was real.
“Given Obamacare made the middle class pay too much for health care, they had less discretionary income, e.g. for retail goods. ”
considering obamacare only directly impacted a much smaller number of people than the middle class, this statement is false. and since many in obamacare obtain subsidies because they have limited income, there was a limited impact on that subgroup as well.
peak, you need to acknowledge that obamacare was not as costly as you want to portray. and it produced a positive outcome, access to affordable health care.
you want to imply that any increase in anybody’s health care cost is directly related to obamacare. that is factually incorrect, and the work of a hack.
“Dodd-Frank helped lower the homeownership rate to a 50 year low last year and had a huge negative impact on small business loans. ”
NO. the poor risk management of the financial industry during the runup to the financial crisis is what produced this outcome. today, people who are qualified for a loan can get a loan. people who are not qualified for a loan, cannot get a loan. you want a repeat of the financial crisis? then you can try and blame the government for your poor behavior once again.
Baffling, who do you believe pays for Obamacare’s higher taxes, fees, premiums, and deductibles? It’s not surprising businesses are dropping health care coverage.
The middle class directly and indirectly pays for the Obamacare mess.
I’ve shown in many ways the financial industry is much more responsible than the federal government, which has selfishly and stupidly caused financial devastation. And, then has to spend, and regulate, even more trying to compensate for the devastation. You need to accept the policies you support are tremendous failures.
“It’s not surprising businesses are dropping health care coverage.”
only small businesses. large businesses are operating as usual. but small businesses have always provided very limited health care coverage. they have never been very supportive of health care coverage. this was true before obamacare as well as after. and remember, employer based health insurance is just another form of compensation for work done-it is not a gift. cutting back on health insurance benefits at work is simply a way to cut compensation costs-ie a pay cut. decoupling the ability to obtain decent insurance away from the workplace is a good thing. prior to the ACA, this was difficult and costly.
“I’ve shown in many ways the financial industry is much more responsible than the federal government, which has selfishly and stupidly caused financial devastation.”
at least you can make me chuckle! i hope you realize how absurd this statement is.
you can learn about how employers have responded to obamacare here
https://www.nytimes.com/2016/04/05/business/employers-keep-health-insurance-despite-affordable-care-act.html
it provides a picture quite different from your opinion.
The added standards of Obamacare drove-up insurance premiums and deductibles. Moreover, taxes were raised and fees added. Almost all of that burden fell on the middle class.
https://www.google.com/amp/s/amp.cnn.com/cnn/2015/03/04/opinion/atlas-obamacare-poor-middle-class/index.html
What’s absurd is you simply dismissing any proof that contradicts your statements. That’s the real joke.
“The added standards of Obamacare drove-up insurance premiums and deductibles. ”
no it did not. the vast majority of employer sponsored plans, where most people get their insurance, already handled those standards. any increase in their premiums and deductibles was the result of other private sector forces. you keep repeating this argument, hoping it will become true. it is false.
you sent me to a 2 year old op-ed from somebody who does not have an interest in providing coverage to the poorest people. that is his opinion, and since obamacare does that at a cost, he considers it a failure. that is not the position most folks have begun to take on the issue of obamacare. people are very much interested in creating affordable access to health care.
on the other hand, if you want to provide coverage to people, but change and improve the cost structure, by all means continue with your efforts. that is not repealing and replacing obamacare, that is simply improving obamacare. that is the problem facing republicans today. they actually want to improve it, but find it politically unsatisfying to admit this goal. they are backed into the corner of “repeal”. but at the end of the day, the progressive goal of increasing access to affordable healthcare will be achieved. this never would have occurred without the push from obamacare. even if republican’s want to call it by another name, such as romneycare or trumpcare.
My CNN article has actual studies.
Your article by the New York Times paints such a rosy picture of Obamacare, why would anyone get rid of it?
yes, let’s use a 2 year old article that uses a 3 year old study based on data that is at least 4 years old, from 2013. we use these “studies” to describe the operation of health insurance in the year 2017. his data has essentially no impact from the full effect of the obamacare years. your are foolish on sooooo many levels peak.
“Your article by the New York Times paints such a rosy picture of Obamacare, why would anyone get rid of it?”
in case you haven’t noticed, lots of people around the country are coming to the same conclusion since the election. that is why you are getting the hesitation from the republicans on the repeal process.