Today we are pleased to present a guest contribution written by Cécile Couharde (EconomiX-CNRS, University of Paris Nanterre), Carl Grekou (CEPII), Anne-Laure Delatte (CEPII, EconomiX-CNRS and CEPR), Valérie Mignon (EconomiX-CNRS, University of Paris Nanterre and CEPII) and Florian Morvillier (EconomiX-CNRS, University of Paris Nanterre).
The widening and persistence of current account disequilibria at the international level have refocused real exchange rate distortions at the core of international debates. What are the exchange rate adjustments needed to correct excessive imbalances? How to assess whether a currency is fundamentally misaligned, i.e. under- or over-valued? We introduce a new database, EQCHANGE, which includes nominal and real effective exchange rates, as well as equilibrium real effective exchange rates for more than 180 countries from 1973 onwards. It represents the longest and largest publicly available database on equilibrium exchange rates and corresponding misalignments.
Due to the key role played by currency misalignments in economic research and policy analysis, several institutions publish their own assessments of equilibrium real exchange rates and corresponding currency misalignments that rely on more or less sophisticated measures. With the exception of the Big Mac Index developed by The Economist, these measures are based on the real effective—i.e., multilateral—exchange rate and derive from three main methodologies: (i) the macroeconomic balance approach, which calculates the difference between the current account projected over the medium term at prevailing exchange rates and an estimated equilibrium current account; (ii) the behavioral equilibrium exchange rate (BEER) approach (Clark and MacDonald, 1998), which directly estimates an equilibrium real exchange rate for each country as a function of medium- to long-term fundamentals of the real effective exchange rate; and (iii) the external sustainability approach, which calculates the difference between the actual current account balance and the balance that would stabilize the net foreign asset position of the country at some benchmark level. However, whatever the selected approach, there is no publicly available database providing these indicators for a consistent and large sample of countries over a long period of time.
In order to bridge the gap, the CEPII has developed a new database—the EQCHANGE database—which is freely available at: http://www.cepii.fr/CEPII/fr/bdd_modele/presentation.asp?id=34. This new database includes:
- indices of nominal and real effective exchange rates for 187 economies over the 1973-2016 period. The effective exchange rates indices are calculated for two panels of trade partners (186 and top 30) and are available for two weighting schemes. The first one is time-invariant and consists in two weight sets respectively representative of foreign trade between (i) 2008-2012, and (ii) 1973-2016. The second weighting system is time-varying and is essentially based on non-overlapping five-year average weights.
- estimates of equilibrium real effective exchange rates based on the BEER approach and corresponding currency misalignments available for 182 countries and from 1973 to 2016.
In a more comprehensive paper (Couharde et al., 2017), we document the process of construction and specific choices concerning the database in greater detail.
Methodology: a short description
To assess equilibrium exchange rates, we have opted for the BEER framework which has the advantage of being entirely data driven and not requesting additional assumptions—contrary to the macroeconomic balance approach requiring assumptions on the long-run values of the economic fundamentals. Instead, the BEER approach consists in assessing directly the equilibrium level of real exchange rates through the estimation of a long-run relationship between real exchange rates and their fundamentals. This approach is then relatively simple and easy to implement and requires few data. This point is crucial given the paucity of reliable data in numerous developing and emerging economies. Overall, the BEER framework allows us to provide equilibrium real exchange rates estimates for the vast majority of countries in the world and over a reasonably long time-span.
To give plausible estimates of the extent to which currencies are misaligned, equilibrium real effective exchange rates provided in the EQCHANGE database are derived from the estimation of three BEER models based on alternate assumptions underlying real exchange rate fundamentals. The first model (Model 1) includes only a measure of sectoral productivity relative to trading partners and is drawn on the findings that the Balassa-Samuelson effect (BS, thereafter) is the most important economic force shaping real exchange rate behavior. Equilibrium exchange rates derived from this first model can be interpreted as PPP-based equilibrium exchange rates adjusted by the BS effect. We also consider two additional models which augment Model 1 by adding (i) the net foreign asset position (Model 2), and (ii) the net foreign position and the terms of trade (Model 3). These three BEER models are estimated in a panel data setting and for different sub-samples to tackle the issue of heterogeneity. Specifically, we consider sub-samples of countries (i) classified according to their level of development (i.e. advanced economies, emerging markets, and developing countries), (ii) depending on their geographic location, and (iii) belonging to a currency block (such as the European Monetary Union).
Currency misalignments are calculated, for each country, as the difference between the observed real effective exchange rate and its equilibrium level given by the estimation of the considered BEER model. By providing these two series for each country of the panel, the EQCHANGE database allows users to identify exactly the roots of currency misalignments in a particular country, i.e. a change in real effective exchange rates and/or a change in equilibrium real exchange rates. Furthermore, EQCHANGE also provides alternate currency misalignments’ indicators depending on the selection of (i) the estimated BEER model (Model 1, 2 or 3), (ii) the countries’ sample (whole sample or sub-samples depending on the level of development, geographical or exchange rate regime considerations) used in the regressions, and (iii) the index for the real effective exchange rate (narrow or broad). The availability of different currency misalignments’ indicators gives then some idea on the robustness of our estimates, and allows any researcher using these estimates to perform robustness checks.
Outcomes: assessing currency misalignments and identifying macroeconomic imbalances
The following figures deliver more concrete illustrations of subsequent analyses that can be conducted with EQCHANGE, taking the example of the Eurozone countries. We not only assess the sign and relative magnitude of currency misalignments across the zone, but we can also give a hint on their drivers.
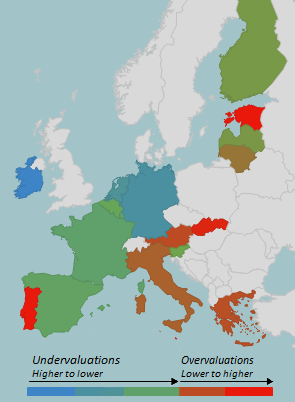
Figure 1 provides evidence on the configuration of currency misalignments in 2016 (the most recent year for which data are available) within the euro area.
Figure 1. Currency misalignments within the euro area (in 2016). Note: Assessments of currency misalignments rely on equilibrium exchange rates derived from the estimation of Model 2 over the Eurozone sample and on broad indices for real effective exchange rates (186 trade partners) computed with time-varying weights. Colors are automatically scaled from the lowest to the highest misalignment with a color gradient green-blue /orange-red. Green (orange) means lower undervaluations (overvaluations), while blue (red) means higher undervaluations (overvaluations).
The current functioning of the euro area is still characterized by large currency misalignments meaning that, in most countries, real exchange rates have diverged from their fundamentals. This trend is even more worrying given that it has triggered wide disparities between overvalued and undervalued currencies, which is fundamentally incompatible with a well-functioning monetary union. Undervaluations have mostly prevailed in founding euro area countries—except in Austria, Italy and Portugal—though in different degrees: undervaluations were relatively sizeable in the core members of the euro zone, i.e. Germany, Luxembourg, the Netherlands and, to a lesser extent, France (up to 21% in Germany), and in Ireland while being more modest in Belgium, Finland, and Spain (below 5.5%). On the other hand, some peripheral countries as Greece, Italy and Portugal were still affected by the effects of the sovereign debt crisis, with overvalued currencies, especially in Portugal. Finally, the euro has also placed a real burden on the competitiveness of most recent members, with overvaluations particularly sizeable for Malta, Slovakia and Estonia.
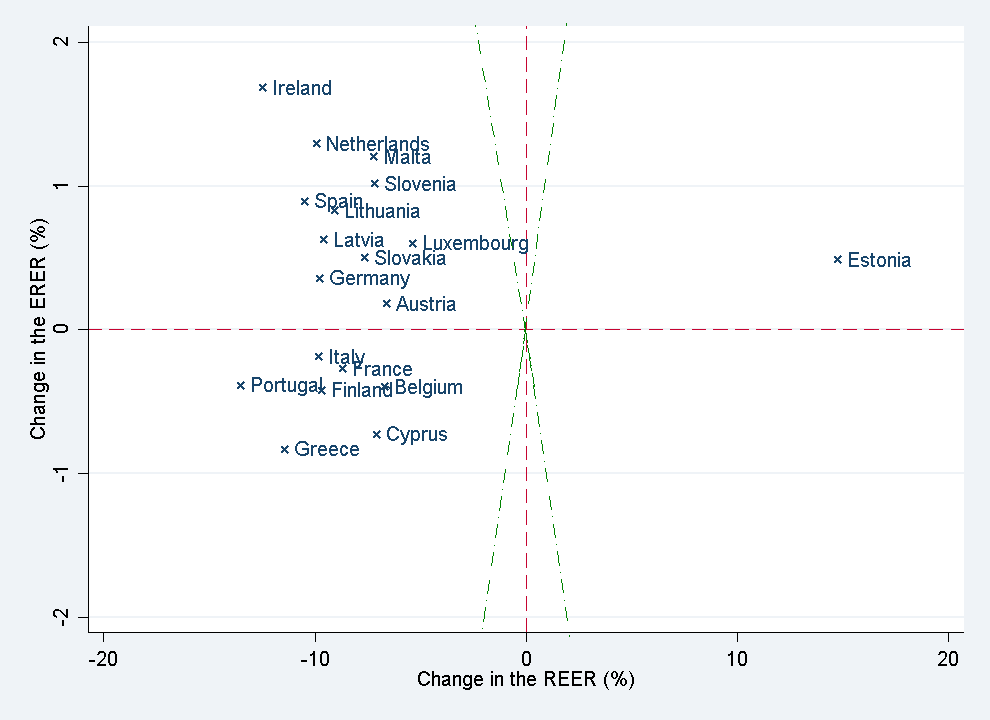
Do misalignments result from (i) variations in real effective exchange rates (REER), i.e. from the nominal variation of the euro towards third currencies and/or inflation differentials, or from (ii) variations in equilibrium real exchange rates (ERER), i.e. due to fundamental factors shifting the equilibrium value? A way to quickly grasp it is to plot the changes of both REER and ERER on the same graph, as illustrated by the scatter plot of Figure 2. This figure displays the relative contribution of variations in REER (x-axis) and in ERER (y-axis) to changes in currency misalignments that occurred from 2015 to 2016. By construction, countries that are close to the main diagonal register similar changes in their REER and ERER, meaning that they experience no or small variations in misalignments. The further away from the main diagonal (the green line), the larger the change in the misalignments.
Figures 2. Euro area, changes in currency misalignments (2015-2016) Variations in REER versus variations in ERER. Note: The green “dash-dot” lines represent the main diagonals. x-axis and y-axis scales are different (x-axis scale is 10 times larger than y-axis scale).
Figure 2 offers some interesting insights. Changes in currency misalignments are mostly explained by variations in REER that have been much higher than those in ERER. More precisely, all countries, except Estonia, have experienced depreciated real exchange rates from 2015 to 2016. The reason for this generalized movement of real depreciations in the euro area is a nominal depreciation of the euro coupled with some structural reforms and internal devaluation. This general trend has led to two different patterns of changes:
- It has resulted in increased undervaluations in the core members—especially in France, Germany, Luxembourg and the Netherlands—as well as in Ireland whose currencies were already undervalued (Germany, Ireland, Luxembourg, the Netherlands) or close to their equilibrium value (France) in 2015.
- On the contrary, currencies of most peripheral countries—Italy, Greece, Portugal and Spain—as well as currencies of new members, became less overvalued (even near their equilibrium value in the case of Spain and Slovenia).
Therefore, the main take away of Figure 2 is that the correction of overvaluations in peripheral countries and new members was mainly explained by real exchange rate depreciations that have offset deteriorating fundamentals (Cyprus, Greece, Italy and Portugal) or a too low improvement in fundamentals to achieve this adjustment (Latvia, Lithuania, Malta, Slovakia and Slovenia). It is then quite likely that this correction, which is not driven by a real strengthening of fundamentals, will not be sustainable in the long run. In particular, it could be profoundly altered by the recent appreciation of the euro.
The euro area provides a good illustration of the potential applications of the EQCHANGE database. Indeed, by offering a detailed picture of changes in currency misalignments on several grounds (magnitude, direction and, finally, roots), EQCHANGE constitutes a powerful tool to clearly identify signs and sources of macroeconomic imbalances in the economy and hence to improve policy choices.
References
This post written by Cécile Couharde, Carl Grekou, Anne-Laure Delatte, Valérie Mignon and Florian Morvillier.
Update, 9/15: To download the data:
– Go to the link: http://www.cepii.fr/CEPII/En/bdd_modele/presentation.asp?id=34
– Then, click on: REGISTER (on the right)
– Once you have registered, you will receive immediately an email allowing you to download the data.


Thanks. But can’t seem to locate the estimates/database on their website. Can you publish a link please?
Dear Keith,
Thanks for your message. The link is in the text: http://www.cepii.fr/CEPII/fr/bdd_modele/presentation.asp?id=34
Best
very interesting thanks (little biased here since my alma mater was nanterre…).
nice complement to the IMF dataset.
just checked the dataset and was a bit surprised that equilibrium rates for 2016 were not available for big countries (USA for example) with the full specification (BS, NFA, TOT).