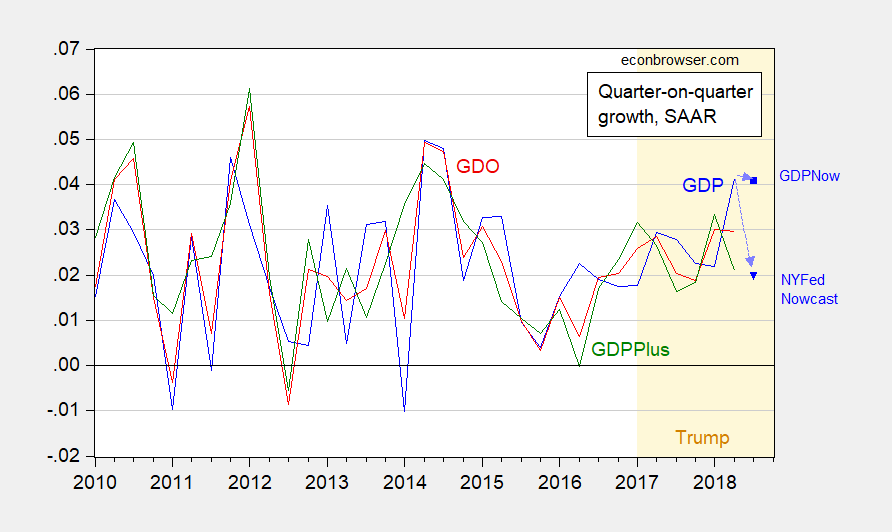
Figure 1: GDP (blue), GDO (red), and GDPPlus (green), q/q SAAR growth calculated as log diferences, and GDPNow (blue square) and NY Fed Nowcast (blue open triangle). Source: BEA 2018Q2 2nd release, Philadelphia Fed, Atlanta Fed (8/30),
NY Fed (8/31), and author’s calculations.
Darts, anyone?