…using plain vanilla 10yr-3mo probit regression, over 1986M01-2019M08 period, using data shown below in Figure 1
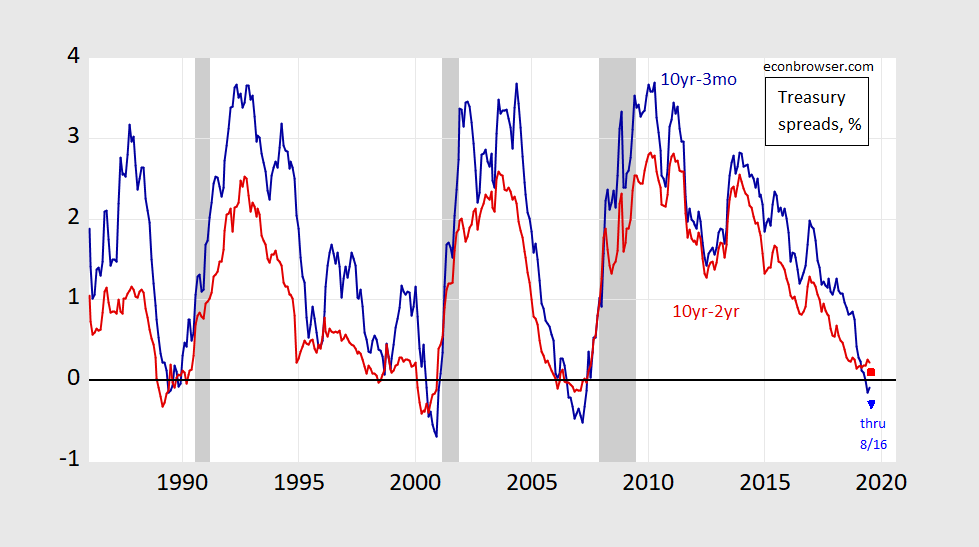
Figure 1: Treasury 10yr-3mo spread (blue), and 10yr-2yr spread (red), both in %. August observation is average over 8/1-16. NBER defined recession dates shaded gray. Source: Federal Reserve via FRED, Treasury, NBER, and author’s calculations.
The critical assumption is that the 10yr-3mo Treasury spread over the rest of August is the same as the first half, and the spread does not move toward zero, nor continue to fall.
The regression estimates:
Prob(recessiont+12) = -0.329 – 0.869 spreadt + ut+12
McFadden R2 = 0.29, NObs = 392. Coefficients significant at 5% msl bold. The spread is in percentage points.
Here are the predicted probabilities:
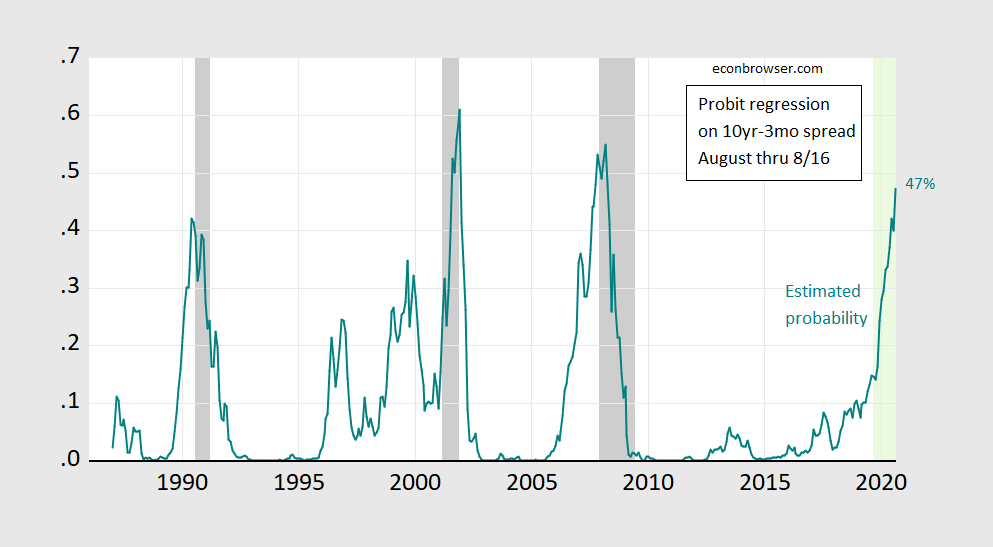
Figure 2: 12 month ahead probability from probit regression on 10yr-3mo spread, (teal). NBER defined recession dates shaded gray. Forecast period shaded light green. Source. NBER and author’s calculations.
If the rest of August is like the first half, then the probability of recession in August 2020 is 47%.
Should one deliver a recession call? That would depend on the threshold. Over the last three recessions, a 40% threshold would catch all three recessions, and yield no false positives. 47% > 40%.
Obviously, if one believes this time is different — so one should use a term premium adjusted spread — the implied probability of recession would be lower (as demonstrated in this post).
This “Yellowhammer” thing seemed to cause a rhubarb in Britain yesterday. Thought some parties like 2slugbaits would take an interest. And yes, before you feel the need to “inform” me of the obvious, I am aware this supports your side of the Brexit argument, more than my side of the argument:
https://www.theguardian.com/politics/2019/aug/18/number-10-furious-leak-document-predicting-no-deal-brexit-shortages
Remember that in 2008 the Fed started paying interest on excess reserves. This created a floor on most short term rates and, perhaps most important, put huge quantities of ER on bank balance sheets. The regressions have no way of accounting for shifted Fed operating procedures. I’ve got no idea what the positive floor does wrt the inversion indicator, but it’s worth thinking about.
Bob Flood: Good point. Have been busy thinking about the long end and QE. If the non-term-premium component of the long rate is the mean of future expected short rates, I don’t see how this changes the calculation. But I suspect it’s in the term premium component and the covariance of the mean future rates with the term premium that might change.
The outhouse economist says here comes 1987.
So, we are moving from 40 to 47 percent, assuming late August looks like early August. Thanks for the update, Menzie.
Menzie, this is a fascinating saga because your “probit” probability and Hamilton’s Recession Indicator Index are so different!
Arthurian: If you understood Jim’s indicator, you would know that his indicator is current (or retrospective, since it pertains to the previous quarter — i.e., July’s assessment is regarding Q2 (April-June). The yield curve regression is for 12 months in the future. I hope that is clear.
NYC has some new information displays on some of its major streets. One claimed today that “economists” have placed a 34% chance of a recession in 2021. It did not say which economists. Betcha they polled Kudlow and Navarro.
31% of recession in 2021 skips 2020. They think the Trump recession will be so bad that things will still be shrinking in 2021. Must be.
Over the last three recessions, a 40% threshold would catch all three recessions, and yield no false positives. 47% > 40%.
Isn’t that a rather thin data set?
I know that it is a fundamental problem in econometrics, sampling sizes…
SecondLook: Yes, it is. If I estimated over the entire sample, I’d have more. That is the NY Fed’s model, see https://www.newyorkfed.org/medialibrary/media/research/capital_markets/Prob_Rec.pdf
I use a method where the threshold pegs at 100%. Captured 6 of the last 7 recessions (missed the relatively mild 1990 recession with a max reading of 89.32%).
Beginning from the first month the 100% threshold is hit, the average length of time until recession is 12 months, in a range of 6 months to 17 months. Indicator has been at 100% starting this past June, so if average holds that would put recession start at June 2020. Independent confirmation should be seen in slowly but steadily weakening (“slowly at first, then all at once”) coincident indicators. Additional Fed easing would be a significant confirmation, as well.
JMO, FWIW, YMMV.:)
Sebastian
@ Sebastian
I can’t tell if this is satire or not…… by any chance do you work for Kopits’ Clueless Consultants LLC ???
https://youtu.be/nVlVTY-Pn9Q?t=194
Sebastian, your comment is intriguing but impossible to judge without some specifics. What is your method?
this is why the trump administration retreated on the tariffs until after the holiday. and this is why china may be willing to “suck it up” and stall on trade until next year. gives them an opportunity to directly interfere with the election. just like russia. and trump let them both do it, without even knowing so. incompetent.
But wait – Navarro told us that Americans do not pay the cost of the tariffs. He claimed Chinese producers do. Sorry maybe Trump wanted to give the Chinese a Christmas present by suspending these tariffs!
As you pointed out, the risk for the 2020 election isn’t just that Russia might work to support Team Trump, but that China and Iran might work to support Not-Trump. But GOP secretaries of state seem to believe that the only risk (or in their view “upside”) will come from Moscow. Of course, it’s also possible that China would hope for Trump’s re-election. Trump’s clumsy foreign policy has been a gift that keeps on giving for Beijing. I’m sure the rice wine was flowing when Trump killed TPP and is flowing once again with Trump’s apparent indifference towards what’s going on in Hong Kong. And thanks to Trump pulling out of the nuclear deal, Tehran is well on its way to becoming a Chinese client state. Winning!
I figured GW Bush was an Iranian double agent for invading Iraq and essentially handing it to Iran as a client state. It didn’t work smoothly, but that’s essentially what it is now. So, maybe Trump is a Chinese double agent. He hasn’t ‘fessed up to Uncle Vlad just yet. That might get ugly.
Anthony Zinni knew more about this situation than anyone back in 2002 as he headed Centcom through 2000. He told anyone that would listen that invading Iraq would be the biggest blunder of all time because it would make Iran the big boy on the block and revive Al Qaeda. He was clearly right. BTW Zinni was a conservative Republican but the Bush apologists tried to paint him as some sort of socialist.
With the exception of 08-09 recession, most recessions (even the nasty oil price ones) were more pauses than crashes. What are the tea leaves saying about the nature of the next one whenever it might be? Do we expect massive inflation as oil jumps to $150/barrel in a few months’ span? Will unemployment reach 10%? Will inflation reach 15%? Or will it just be a “oh, things are slower?” type of recession followed by the upward march of GDP? https://fred.stlouisfed.org/series/GDP/
Single statistic Bruce! Let’s take the recession that started in December 2007 (not 2008). Yes the economy hit bottom in 2009 but we had a large output gap for many years after. Yes the 2001 official recession was brief but we were not back to full employment until 2006. The 1982 recession gave us a huge output gap that was not eliminated until 1986.
But for Single Statistic Bruce – the output gap does not matter. Hey Brucie – I eagerly await your next utterly stupid Single Statistic!
Okay, you win. 12/07 would be considered the month of the start (with 11 months not part of the recession), so yes, 2007… it started in 2007. Actually it started in 2006 in Michigan.
As for nominal GDP, it does give a picture of the adjustment for inflation in those earlier occurrences. The UAW had a lot of people out of work for a short while, but the inflation adjusted wages made up the temporary loss. Housing was hit because of the interest rates, but then recovered nicely (I sold two houses with nice inflation-adjusted gains that wiped out a lot of mortgage debt). But you didn’t really try to address the questions, did you? Predicting is much easier after the fact.
“As for nominal GDP, it does give a picture of the adjustment for inflation in those earlier occurrences.”
WTF? That is a stupid statement even for you. BTW – you just skipped my comment about the output gap. Then again you excel in Single Statistic analysis!
pgl: Concur. It is either the most economically illiterate statement ever made on Econbrowser, or the most poorly worded. Observational equivalence…
BTW Brucie – I just checked what happened to nominal GDP during the 1981/82 recession. Nominal GDP continued to grow as real GDP fell. By 1982QIV – we had the largest output gap since the Great Depression.
Reagan should have had you as his economic spokesperson because you would have declared “what recession”? In a word even dumber than the village idiot we call Kudlow the Klown.
You asked FRED to plot nominal GDP? Are you really this incredibly stupid? After all with prices rising, nominal GDP can rise even as real GDP falls.
Oh as far as my question asking if you are really this incredibly stupid – no need to answer. We have know for a long time that you are.
It will be more like 1987, but that’s still going to hurt a whole lot of people. “Oh, things are slower” isn’t much fun when you have bills and no work. More people will be in that situation when “oh, things are slower” happens this time.
Brucie the other day declared the 4000 person decline in Michigan manufacturing sector employment to be statistically insignificant. Yep – he does not go to the local bars out of fear that one of those unemployed workers might be reading his heartless garbage.
“Oh, things are slower”
the problem will be this time around we have a lot of assets that are over valued. At the same level as real estate a decade ago? No. but when a broad set of asset classes-stocks, bonds, real estate-are over valued, then very low interest rate environments coupled with loss of job security and pay raises will make even a mild recession hard on quite a few people. it will be rather difficult to gain traction out of this slowdown. when the fed causes a slowdown with rate hikes, we have a mechanism to reverse it with rate drops. but we continue to be in this over valued state. logic has it that as those assets drop in value, people jump back in and kick start the economy. but we just saw how slowly some of these assets can drop in value-especially real estate. these are difficult slowdowns to exit from.
Which brings up a few questions.
How does the current deficit enter into the fed’s ability to control rates? My expectation is that the fed has less rate setting capacity when the US government is borrowing as much as it is under Trump. But, I don’t know.
How does the end of QE along with the low rate environment affect both long and short term rates and the inversions we are seeing now? Maybe there’s an effect. If this one has been addressed, I missed it. No surprise there.
I’m having a brain cramp. Not 1987, 1990.
I had one of these when looking at a graph on this blog recently, don’t worry I won’t tell anyone. Uncle Moses never finks on the good guys.
Trump tweets would have us believe that there is a conspiracy among economists (say our host), the Federal Reserve, and our allies who all want to tank the economy so Trump will not get re-elected. Of course it is clear Trump cares a lot about getting re-electing, the economy be damned. Yes – it is all about THE DONALD!
Nobel Prize winning economist Kelly Anne Conway is nailing Menzie!
https://globalnews.ca/video/5784448/kellyanne-conway-calls-recession-the-sesame-street-word-of-day
Kellyanne Conway calls recession the ‘Sesame Street word of day’
She claims that we never mention the economy unless we are talking about recessions. I guess it hurts to be criticized this way by a complete and utter BIMBO. Alternate Facts. MAGA!
As a public service, FRED publishes:
100*(Real Gross Domestic Product-Real Potential Gross Domestic Product)/Real Potential Gross Domestic Product
https://fred.stlouisfed.org/graph/?g=f1cZ
Note that output gaps tend to be rather prolonged even during periods where Single Statistic Bruce thinks they are short lived. Of course Brucie only knows how to plot nominal GDP. Go figure!
@ Menzie
Menzie, I thought you would take an interest in these numbers. I don’t know how to post the graph here, so you are just gonna kinda have to take my word on it or use your web skills to find it. If you look at the Cass Freight Index (both shipping and expenditures), it has been dropping (with a few very small jagged-ie upticks) roughly since Feb-March of 2018 (17 months ago). And the drop is pretty steep, even when you look at a graph going back 7 years.
Also, when you separate USA trade from the numbers, China’s export growth still seems relatively healthy when stated in RMB terms.
“Due process”??? Isn’t that like….. Obama-ish and stuff??
https://www.revealnews.org/article/leaked-immigration-court-officials-directive-could-violate-rules-that-protect-families-from-deportation/
“James R. McHenry III, director of the Executive Office for Immigration Review, the Justice Department agency that runs its immigration courts”
Maybe we should figure out who this jerk is. Is he a Trump appointee?
Apparently McHenry graduated from Vanderbilt Law School in 2003. He seems to be one of the people Sessions brought in to Make America White Again:
https://law.vanderbilt.edu/news/james-r-mchenry-iii-jdma-03-appointed-director-of-the-executive-office-for-immigration-review/
I repeat, coolest dude ever. LIVE In 15 minutes from the time I hit “post comment”.
https://www.youtube.com/watch?v=4BN8s9XmWgU
Hello Professor Chinn,
1)
I got close and still looking over my work:
Coefficients:
Estimate Std. Error z value Pr(>|z|)
(Intercept) -0.4021 0.1504 -2.674 0.00749 **
avgspread -0.8262 0.1326 -6.231 4.63e-10 ***
—
Signif. codes: 0 ‘***’ 0.001 ‘**’ 0.01 ‘*’ 0.05 ‘.’ 0.1 ‘ ’ 1
There were 392 obs in my training set
and my probability for recession in August 2020 is 44%.
My calculations in July were a little bit lower, too. I am still going through the model.
2)
Thank you very much for references to “The Journal of Economic Perspectives in the Classroom”.
My copy of “Intro to Econometrics” by Stock and Watson arrived two weeks ago.
3)
About 30 years ago, one of the Ph.D. engineers gave me a detailed explanation of a model he was building. He was reading peer-reviewed journals. He was extracting the equations and building a model. That was one of the most educational experiences I ever had. I thought peer-reviewed journal articles were too dense for me to understand. The most important thing I learned was, that with some effort, I could understand peer-reviewed journal articles.
Unfortunately, that experience has proved very useful in this current environment.
If I could suggest anything to the pedagogy in the economics department, I would suggest adding a simple example of going through a peer-reviewed journal article and reproducing the author’s results.
I never thought this would be the new normal.
Cheers,
Frank
Frank,
Why do you label the usefulness currrently of being able to understand peer-reviewed journal atticles as “unfotunate[ly]”?
Hello Professor Rosser,
Well, I was thinking about the current political environment:
USDA ERS moving to Missouri to get rid of the ag economists.
The POTUS constant statements about tariffs.
The POTUS statements regarding the FED.
The Director of Trade and Manufacturing Policy under the current POTUS position on tariffs and currency manipulation.
The Director of the National Economic Council under the current POTUS, “There’s no recession on the horizon.”
Trumponomics.
The current POTUS claims regarding African-American employment.
The current POTUS claims regarding GDP.
Well, I never thought it would be the default position would be to doubt or to question the senior economic advisers. So, probably a little bit snarky, but yeah, it seems a little unfortunate those skills would be useful in creating a probit model to reproduce Professor Chinn’s coefficients or read those papers that Professor Chinn posted on tariffs or reproduce the graph presented by Dr. Phillip Levy at the La Follette School Spring Symposium 2019.
Unless I watched those Ph.D.s around me reviewing papers and creating models, I would never have thought to try to reproduce that graph by Dr. Levy. Those Ph.D. guys would see an interesting table or a graph in a peer-reviewed paper and pull out a calculator. I would never have thought to attempt to download data sets and reproduce the author’s results.
I am taking those Principles of Econ MOOC course for fun. I really do like the modern technology used in those Principles of Econ courses. I don’t know when it would be an appropriate time to induce the peer-reviewed literature in the classroom. Without my prior experience, I doubt I would ever go beyond the class textbook. I doubt the thought would ever occur to me to try to reproduce that cool graph or table by Dr. X at Symposium Y or peer-reviewed paper Z.
I guess it is unfortunate that I cannot trust the senior economic advisers and have to go through the calculations myself.
Cheers,
Frank
Hello Professor Rosser,
It’s Wednesday.
After work, I was catching up on my Principles of Economics work and EconBrowser.
Today, the POTUS rage tweeted about the FED.
Today, the POTUS rage tweeted on NATO.
This is crazy.
And still, the POTUS has a 40 percent approval rating.
This is crazy. Why do 40 percent of the US pop support this crazy?
In my Principles of Economics opinion, the POTUS is doing real economic damage to the United States and the world and there are people that are enabling the POTUS.
I think I will change my “unfortunate” to “the POTUS appears to be mentally unfit and doing real damage”.
I think the 25th amendment applies to the current POTUS.
Cheers,
Frank
Frank,
In other words, an ironic usage of the word. Fair enough.