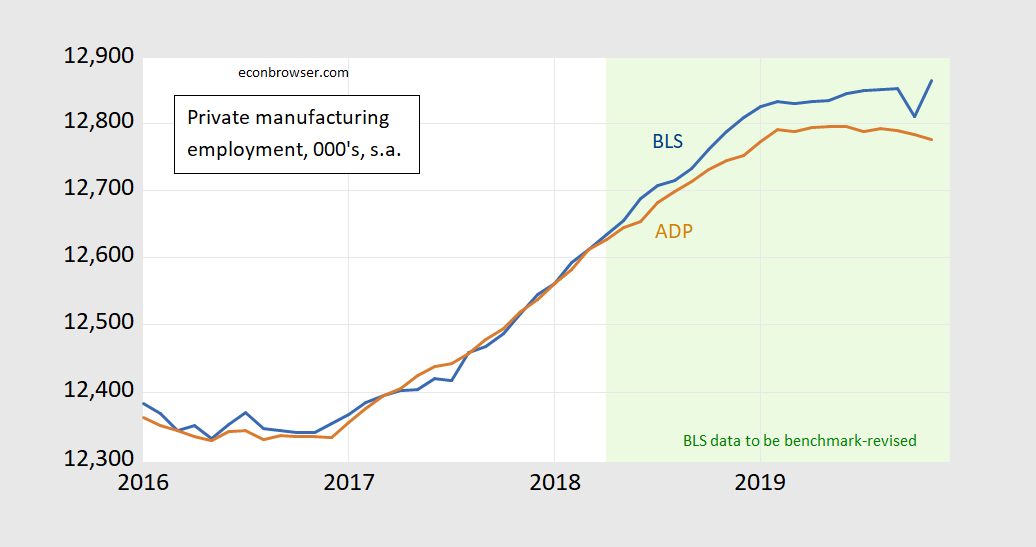
Figure 1: Manufacturing employment, in 000’s, s.a., from BLS (blue), and from ADP (brown), on log scale. Light green shading denotes data that will be benchmark-revised in February release. Source: BLS and ADP via FRED. [Updated 12/7 to include November BLS data]
Manufacturing peaked a little earlier in the ADP data (June) vs. BLS (August), but ADP suggests a much less pronounced rise to peak during 2019.
Average weekly hours of nonsupervisory employees in the manufacturing sector have also fallen rather sharply over the last 15 months. Fewer workers working fewer hours.
https://fred.stlouisfed.org/series/AWHMAN
But, in a shrinking sector of the economy.
Yea but what did Trump promise? That he would create lots of high paying manufacturing jobs. He didn’t.
So he lied. It’s a big surprise, based upon his long history of truthiness, huge success running profitable airlines, casinos, and the like, and all the straight forward and reasonable behavior he has exhibited throughout his long, lurid career.
The areas that voted for him are arguably doing worse now that before he was elected. They still think he’s just hunky dory. Those same voters seem to discount decades of evidence of abject Trump failures. By definition, half the country is below average.
Menzie, do you know who this guy is?? His name looks familiar. I must have read it on one of those goofball blogs I sometimes visit:
https://www.youtube.com/watch?v=MQnm06psEIs
https://www.youtube.com/watch?v=X-Y6YfDBmh8
Moses Herzog: To be honest, I skip almost every link to youtube I see on the comments. Life is too short…
Cam Harvey, Research Affiliates partner and Duke Fuqua School of Business professor of finance, explains why the inverted yield curve may portend a recession. This was some Bloomberg show.
Moses Herzog and pgl: Ah. I did cite in this post.
That was my attempt at humor, I’ll try and cutback on the Youtube nonsense. Most of it is meant in good humor.
The CV for Dr. Campbell Russell Harvey is rather impressive:
https://people.duke.edu/~charvey/vitae.htm
Dear Folks,
For those, like me, who have no idea what ADP is, please see
https://www.adpemploymentreport.com/
J.
“The ADP National Employment Report provides a monthly snapshot of U.S. nonfarm private sector Employment based on actual transactional payroll data.”
In other words, it does not capture the employment of the government sector. BLS does but note BLS relies on survey data.
Professor Chinn,
I wonder if you may consider discussing the cointegration of NPPTTL and BLS nonfarm-private employment. I am having some difficulty showing that NPPTTL should be able to forecast BLS nonfarm private employment from 2010m1 to 2019m10.
It appears that both log(NPPTTL) and log(BLS nonfarm-private) are I(1), but I run into issues relating to cointegration and the ability of log(NPPTTL) to forecast log(BLS nonfarm-private), when using methods shown by Professor Dave Giles on his website in which he discusses Toda and Yamamoto (1995) procedure to test for Granger causality.
https://davegiles.blogspot.com/2011/04/testing-for-granger-causality.html
AS: In the case of the two series, I think it matters a lot whether you are looking initial unrevised or final vintages for forecasting, and perhaps even for cointegration. I know of folk wisdom that ADP does not help in predicting Private Nonfarm, above and beyond lagged Private Nonfarm. Don’t have a reference, unfortunately.
Thanks for your comments. Just trying to learn something, not trying to join the folk wisdom.
AS: Well, if you find a stylized fact, you can add to the folk wisdom. On these sorts of issues, there are few formal studies.
Any thoughts on (seeming) divergence between the two series?
This Friday will be a weird one. The GM workers on strike in October are back on the job and that’ll inflate the manufacturing NFP figures in the BLS Establishment data.
What all the data is telling me is that the economy has not broken out of the some 2% growth trend established in Obama’s second term. Sure, sometimes it is stronger and some times it is weaker.
Maybe the only exception is coal mining where employment is growing at about a 2% annual rate versus falling under Obama. I suspect that growth is in Wyoming rather than West Virginia.
Considering the prices, I doubt there is any growth. They are lying. I do not like the BLS as you see.