Today, we are pleased to present a guest contribution written by Valerio Ercolani and Filippo Natoli, both of the Directorate General for Economics, Statistics and Research of the Bank of Italy. The views presented in this note represent those of the authors and not necessarily reflect those of the Bank of Italy.
After the economic downturn that followed the outbreak of the Covid-19 crisis, private forecasters see a rebound in the third quarter of 2020 both in the US and worldwide. While this appears as the most plausible scenario assuming lockdown and social distancing measures are soon relaxed, a recessive dynamics through the end of the year cannot be ruled out. A simple probit model augmented with market volatility, which reached its maximum last March, forecasts a more prolonged recession in the United States. Historically, turmoil in financial markets informed us that the associated recessions were not close to the end.
Private forecasters currently see a deep fall of US and global GDP in 2020:Q2, a big economic rebound in the third quarter and a still significant growth in the following two quarters (see, among others, Barclays, 2020 and JP Morgan, 2020). This entails that already in three to four months from now, positive GDP growth should materialize. While this appears as the most plausible scenario assuming lockdown and social distancing measures are soon relaxed, a recessive dynamics through the end of the year cannot be ruled out a-priori.
Useful insights into this can be offered by economic indicators that are fast-moving and forward-looking, i.e., financial prices. In March, implied volatility in the US stock market, captured by the “fear gauge” VIX index, rose to its highest level, further realized volatility reached a historical peak (Figure 1). Baker et al. (2020) stress that current uncertainty is greater than the levels associated with (i) the financial crisis of 2008-09 and (ii) past epidemics like Ebola and SARS.
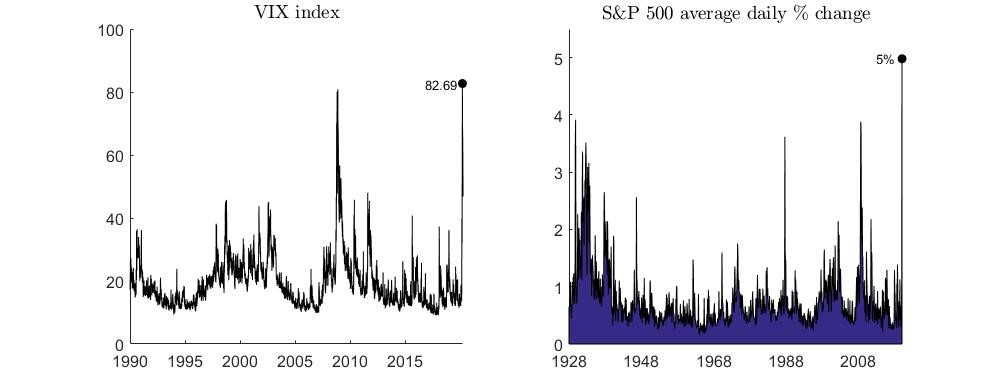
Figure 1: Indicators of financial volatility over time (daily frequency)
Market volatility could convey some information about the timing and shape of the expected recovery. In 2 out of the 3 recessions occurred since 1990, when its availability begins, the VIX reached its peak at least 6 months before a positive turning point shows up (Table 1). Moreover, historical data since the Great Depression show that the largest stock price drops within recessions – as the one of last March – occurred much before recessions ended: in roughly 65% (87%) of the actual recessions, daily returns reached their low at least 6 (3) months before the end of the recession (Table 2).
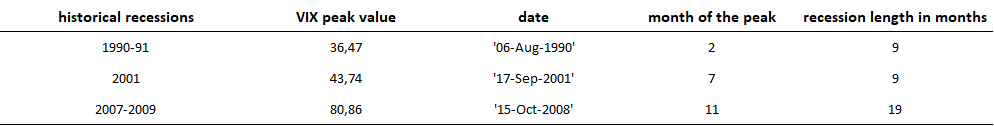
Table 1: peaks of the VIX index during past recessions, in US
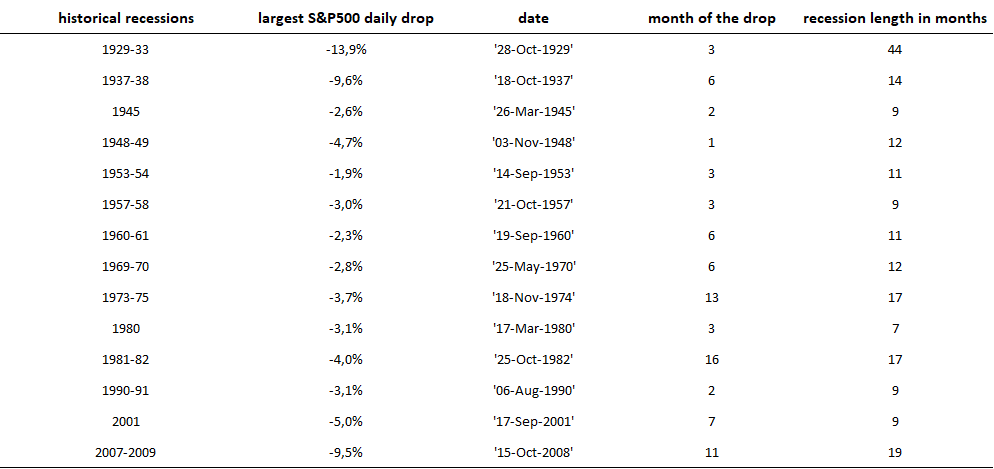
Table 2: largest stock price drops during past recessions, in US
We try to use the information conveyed by the VIX, augmenting a standard forecasting model based on the slope of the yield curve. Slope-only predictive models have performed well in the past as leading indicators of incoming recessions, but there are reasons to believe that such predictive ability has diminished after the global financial crisis: in particular, both secular forces and large-scale intervention by the Fed have contributed to depress long-term yields.
We therefore run an otherwise standard probit model, in which the probability of the economy being in recession is regressed on the yield curve plus the VIX:

where the dependent variable is a dummy equal to one (zero) if the US economy is (is not) in a NBER recession (Rec) at time t+h, h being the forecast horizon; the yield curve slope (slope) is proxied by the 10-year vs. 3-month yield spread; the VIX index is the one-month implied volatility of S&P500 options; is a constant and F(.) denotes the standard normal cumulative distribution function. The model is estimated by maximum likelihood using monthly data from January 1990 to March 2020. In principle, we do not yet know whether or not the US economy was in recession in the first months of the current year: however, in accordance with recent nowcasts (e.g., those produced by the Federal Bank of New York) we set March 2020 as it was in a recession state.
The VIX index shows up as a significant predictor of recession: the marginal effects of the model reveals that higher market volatility increases the probability of recession from 1 up to, at least, 12-month horizon (Figure 2). The negative sign of the slope is also expected: a flatter yield curve increases the probability of recession.
Figure 2: Average marginal effects from 1 to 18-month horizons of the VIX-augmented model, with associated 68% and 90% confidence bands.
We then make out-of-sample forecasts from April 2020 to March 2021, i.e., with h going from 1 to 12. As Figure 3 shows, recession probabilities generated by the augmented model (red line) stay at 90% until September 2020, i.e., the end of the third quarter; only subsequently they start falling, but still remaining above 50%, 12 months from now. For comparison, recession probabilities associated to the standard slope-only model (blue line) never go above 20%. It is important to point out that the VIX-augmented model performs much better than the model with the slope alone at any horizon according to standard goodness-of-fit statistics such as Pseudo R2 (as in Estrella, 1998), BIC (as in Wright, 2006) and AUROC (as in Berge and Jordà, 2011). Taken at face value, market volatility is signaling that the current recession may go well beyond the second quarter of 2020.
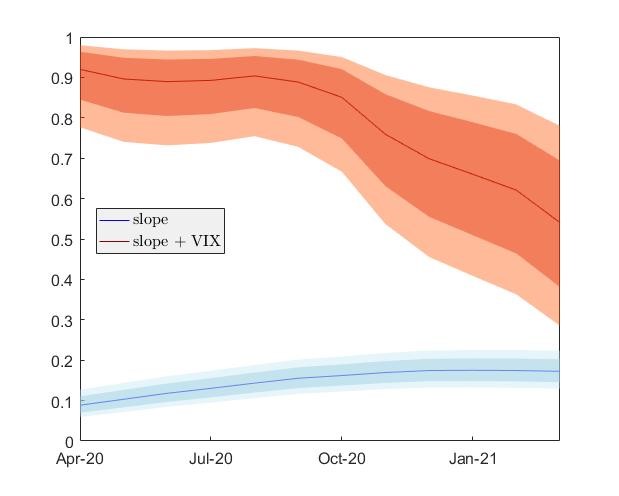
Figure 3: Out of sample forecasts: probabilities of recessions from 1 to 12-month horizons, with the associated 68% and 90% confidence bands.
We are not the only ones to raise concerns that the current recession could persist well beyond the second quarter. For example, Fornaro and Wolf (2020), within a New Keynesian framework, show that the Covid-19 shock could give rise to an expectation-driven stagnation trap, where agents might coordinate in an equilibrium where output remains permanently low featuring a prolonged recession. Further, Baker et al. 2020 use US stock market information to calibrate first- and second-moment aspects of the COVID-19 shock within the Baker et al. 2019 disaster model. They find a peak year-on-year US GDP contraction of 11% in the last quarter of this year, followed by anemic growth in 2021. More than half of the projected output contraction is caused by Covid-19-induced uncertainty. Similarly, Ludvigson et al. (2020) show that the negative effects of the crisis would persist for at least the next 10 months, with macroeconomic uncertainty being one of the drivers of the crisis. The role of stock-market uncertainty in the last two analyses is causal, and should not be confounded with the role it plays in a purely forecasting exercise such as ours. Yet, and sadly so, they also point to a more protracted contraction than many observers currently presage.
This is a time when traditional macroeconomic data, available with lags, are less helpful than usual in making forecasts. Furthermore, the standard macro models used for processing that information may not be up to the task, given the very unusual nature of the current shock and the difficulty of modelling how its effects will play out going forward. Therefore, the need emerges to combine those data and models with additional information and approaches. Looking at higher-frequency data is warranted, and trying to exploit financial markets is another, potentially informative effort. Our admittedly simple approach suggests, unfortunately, that a turning point may have to wait for longer than some observers believe.
Bibliography
Baker I., N. Bloom, S. Davis and S. Terry (2019). “Does uncertainty reduce growth? Using disasters as natural experiments”, mimeo Stanford, http://people.bu.edu/stephent/files/BBT.pdf
Baker I., N. Bloom, S. Davis and S. Terry (2020). “COVID-induced economic uncertainty”, VoxEu Column, 13 April
Barclays (2020), “Global Economic Weekly”, April 2020,
Berge and Jordà (2011), “Evaluating the Classification of Economic Activity into Recessions and Expansions”, American Economic Journal: Macro, 3 (2)
Estrella, A. (1998), “A new measure of fit for equations with dichotomous dependent variables”, Journal of business & economic statistics 16 (2)
Fornaro, L., and M.Wolf (2020). “Coronavirus and macroeconomic policy”, VoxEu Column, March 10, 2020
JP Morgan (2020), “Global Data Watch”, April 2020
Ludvigson S., S. Ma and S. Ng. (2020). “COVID19 and the macroeconomic effects of costly disasters” NBER Working Papers 26987
Wright (2006), “The Yield Curve and Predicting Recessions”, Federal Reserve Board
This post written by Valerio Ercolani and Filippo Natoli.
Will we recover in 2020QIII? I do not put it past this incompetent, uncaring, and lying White House. Look who was just fired for reporting on how Trump botched the COVID-19 crisis:
https://www.msn.com/en-us/news/politics/trump-moves-to-replace-watchdog-who-identified-critical-medical-shortages/ar-BB13uLtH?ocid=spartandhp
The level of incompetence of the White House in addressing COVID-19 is staggering but our inspectors are being warned not to report it. Those that do will be fired by King Donald – or is this Emperor Nero who fiddled while his citizens needlessly died?
Kayleigh McEnany- I will never lie to you. You have my word on that:
https://www.msn.com/en-us/news/politics/kayleigh-mcenany-makes-a-thoroughly-trump-ian-debut/ar-BB13ukwM?ocid=spartandhp
And then she lied and lied and lied!
Lovely effort by Ercolani and Natoli. I suspect, however, that the historic relation between financial markets and the real economy is not a good guide to the current case.
In the current case, social distancing efforts led to a very sharp drop in economic activity, unlike what generally happens in a recession. Financial markets, on the other hand, have enjoyed the largest injection of official money ever, as have firms and households. Output is artificially low, financial prices are artificially high, in an fashion unprecedented in modern economies. Importantly, the Fed has been trying to limit the transmission of financial shock to the real economy, with the aim of preventing the very problem that Ercolani and Natoli have identified.
What I would guess this all means is that the bottom in output will come when restrictions on gathering begin to be lifted. The effect that Ercolani and Natoli show will, I’d guess, have a profound effect on the pace of recovery – the Fed cannot fully undo the harm to credit flow and confidence that has been done by the pandemic.
Just one guy’s guesses.
To put it another way, the official response to the pandemic has been to move the drop in output forward in time so that the overall drop will be reduced, while limiting financial harm from that sudden, administered drop in output. If either of those efforts is successful, the bottom of the recession should come sooner than otherwise would have been the case. Good policy can help, but the long-run performance of the economy after the quarantine will depend mostly on private sector behavior.
The fed and the stimulus, however botched it may be, will help keep this from being a bottomless pit. The economy will not come roaring back. Too many people will not have the money to spend and will be nervous if they do have money. People will be wary of travel, gatherings and the like. It will take a few quarters to get to some semblance of normal.
buffet dumped all of his airline stock. this would imply he thinks there is little discretionary spending to occurring the next half of year, at least. i would agree. travel and all the derivatives that entails will halt over the next 6 months. this will not produce a depression, but it certainly keeps the economy from bouncing back like some have hoped. unless a strong therapeutic arrives, we are in for a slog for 6 months. perhaps remdesivir helps, or some other treatment, and changes this outcome. i think we can move that needle somewhat.
on the other hand, many states have decided to reopen the economy. the calculus of this is that we are now looking for herd immunity, the outcome of which is we still will have hundred(s) of thousands die from this disease, many of whom are elderly. as i argued months ago, this is going to be a demographic changer. many of the young will not get sick, but will pass this onto their parents and grandparents, who will die. a decision has been made by the conservative governors to sacrifice the elderly in order to restore the economy as quickly as possible. since this is the path chosen, it seems a bit foolish to pursue vaccines at all cost, since that is not the outcome we have chosen. by rushing to open, we have minimized the impact of any vaccine.
we have rushed to reopen the economy without much discuss to protection of the elderly and sick. this has been a choice made by some governors-it was not a mandate. those that lose loved ones in the coming months will realize those folks were unnecessarily sacrificed for political posturing. many will be faux news viewers, being told to return to the economy while the network continues to social distance and operate remotely. this is not how i hoped the story would end.
Using data ending April 30, 2020, I notice that the beginning one month ahead probability of recession drops to about 81%, but still is above 40% by April 2020. This assumes that I followed your model correctly. Very interesting model with caveats mentioned by macroduck.
“this appears as the most plausible scenario assuming lockdown and social distancing measures are soon relaxed”
Then we get this:
Office of the Governor
State of Oregon
EXTENDING THE COVID-19 DECLARATION OF EMERGENCY (EXECUTIVE ORDER NO. 20-03) FOR AN ADDITIONAL 60 DAYS, THROUGH JULY 6, 2020 https://www.oregon.gov/gov/admin/Pages/eo_20-24.aspx
Oregon is ranked 40th in US coronavirus deaths. 40TH! The state has had 104 deaths (out of a population of 4.14 million) and ranks next to South Dakota, a state that NEVER shut down!
Comparing a state on the West Coast to one in the middle of nowhere. Dumb even for you Sammy. Come on man.
Theproper comparison is deaths (infections, or whatever) per capita, not total deaths. The press generally gets that wrong, as does sammy. Seems like somebody expressing strong opinions should try to get this sort of thing right.
Even for the math-challenged, there is a way to get something like a per capita comparison. Oregon is 27th in terms of population, 40th in Covid deaths (accoring to sammy).. Oregon has done a better job than the average state in dealing with the virus. South Dakota is 47th in population and (assuming I read sammy’s claim correctly) 41st in deaths, so has done a worse than the average state and much worse than Oregon. Oregon has a strong set of limitations on contact, South Dakota does not. Q.E.D.
Thanks, sammy, for pointing out this stark bit of evidence that social distancing works.
So more like a lazy J imitating an L than a V, as I previously suggested.
@ Barkley Junior
“Imitating” something you very recently said didn’t even exist—an L shaped recovery. Interesting. So that’s how you perceive you’re always right, you just change the goal posts every 3-5 days of what you originally said. You should get a MacArthur Fellowship Grant for that, I bet no one has ever thought of refashioning their own past statements to say something would act like something else they said 3 days before had never happened. Tell me Junior, do you have one of those motorized mattresses where you can fold it up and blow yourself when you bring into existence these past quotes??
Wow you are screwed up, Moses. Something can imitate something that does not exist if that something is a theoretical possibility. I am simply repeating something I said earlier, that we might have a lazy J that imitates an L, but is not an L, although Jeffrey Frankel might be right that we get a wiggly W. I did challenge you to name a single macro fluctuation in US history that looked like an L, and as with many other challenges I have put to you, you have failed to deliver and probably will continue to do so, because we have never seen such a pattern, at least not since macro data became reasonably reliable well into the 20th century. Still going to produce one? If so, then you can continue with your silly ridicule. In the meantime, we certainly know what an L would look like, even if we have not actually seen one, so it is perfectly reasonable to describe a pattern of a “lazy J” (my coinage) as “resembling an L,” even if it not.
I also note that I have granted that we may have seen an L or even more than one in some poorer nations. Indeed, I mentioned Mexicco in the 1980s as a possible example, and I have since checked on it, and indeed my memory was correct: it looks pretty much like a real L. There was a sharp collapse in 1982 associated with an international debt crisis in Mexico (partlyi driven by a decline in oll prices), and indeed for the rest of the decade the GDP growth rate in Mexcio was barely above zero and was negative in real per capita terms: pretty much an L.
From the great Harrisonburg bait-and-switch con artist: “As it is, I would say there are three cases, although we have very rarely seen one of them. The one rarely seen is the L-curve, that lots of peeople are talking about but which there is almost no evidence of being likely to happen, and indeed, I cannot name a depression or recession that has clearly exhibited that, which would involve a long flat bottom period of zero growth (uh oh, there I go again, indulging in oxymorons!). Can anybody name any suvh [sic] event in US economic history? I know of none.”
https://econbrowser.com/archives/2020/04/guest-contribution-will-the-recovery-be-j-shaped#comment-235923. <—-Look for Barkley's fantasized mentioning of Mexico in the 1980s, because it is not in this comment or in ANY of Barkley’s comments in this blog related to the shape of economic recoveries. I could ask Junior to link to any such comment, but Barkley doesn’t clean car windows, and Barkley doesn’t provide links to comments he’s fantasized himself making in the past.
Also, Junior wants all of you to know he is the first person to coin the term “Lazy J”, so, if anyone else uses this term, you are stealing it from the great neologist Barkley Junior. So, use of this term without proper credit to Barkley Junior or similar “suvh” event is copyright infringement.
Moses,
What a waste of time. I have to go digging through past posts because you are lying again,.
I first mentioned the Mexico case in the thread on “From 2020: Some Economists…” the one about the letter to Bernanke about inflation. So, you are just plain wrong.
In digging around I did finally open that link you provided, which you could have easily described to us. It shows Japan in the 90s, which is a possible case, although in two years in that decade Japan’s growth rate exceeded 3%, so not a definite L. Mexico better, although in one year in the mid-80s it did have a somewhat higher growth rate.
In the digging I finally found where this talk of an L came from, the Conchrane link in the earlier thread based on the Papell paper that was posing the J shape in the first place. It seems that Cochrane thinks that the example of an L is the US after the Great Recession, but this is ridicuous given that after 2009 the US growth rate was solidly positive if not spectacular, generally ranging between about 1.5% and 3%. Indeed, that is precisely the sort of thing I would call a lazy J, fell much harder than it went up by afterward, but it did go up. An L does not go up. It just sits there, and it remains that we have never seen that in the US, even if we may have seen it in Japan and Mexico.
I also remind you that not only have you failed to find a US pattern that looks like an L (I revised my demand after I though of Mexico) you also have not responded to the one asking for David Ignatius making errors, other than to charge him with ethical violations, not spelled out by you, and which is not the same thing.
You are simply sitting in a pile of embarrassing doo doo here, Moses. Clean yourself off and apologize for lying.
A couple more remarks on this this farciccal situation, not the first time you have leveled fals accusations against me, Moses.
One is that I understand why nobody commented on your wonderful WB graph that you thought showed an L. Infact, while I think Japan is a possible L case, that figure does not look remotely like an L. It is a bunch of large ups and downs one aftet the other, a 3% rate followed by about zero then jumping up again and down again. Does not look like any letter at all.
The other has o do with the apparent source of talk about L patterns, John Cochrane, although perhaps there have been others before him talking about them. His line that the US looked like an L after the Great Recession is actually a Trump/GOP piece of anti-Obama propaganda that they pushed repeatedl: the claim that there was no growth (or not much) under Obama after the Great Recession. I mean, that is what an L is, a sharp collapse followed by zero (or near zero) growth, which has been more or less what thie partisan line on Obama claimed.
But regulars here indeed know better: Obama had fairly steeady positive growth, even if it was not alll that spectacular. But then the record under Trump has not been all that muc hbetter, despite the claims made by Trump followers. In any case, the hard fact is that this Great Recession and its aftermath looks like what i have called it: a lazy J.
From the dementia saddled mind of Barkley Junior:
“I first mentioned the Mexico case in the thread on ‘From 2020: Some Economists…’ the one about the letter to Bernanke about inflation. So, you are just plain wrong.”
Junior, can you tell those assembled here why those Hoover wankers would write a letter to Bernanke on a policy, lobbying him to change his stance on Fed asset purchases, since the man has not been Chairman since 2014?? You know, in your best non-senile way try to explain how you pulled the year “2020” out of that one??
The correct title of that link is “From 2010, Some Economists on the Conduct of Large Scale Asset Purchases”
Anyone who wants to read it to see my comments in full context, along with Junior’s to see how he adjusts his stance roughly every half day when caught in a factually false statement:
https://econbrowser.com/archives/2020/04/from-2010-some-economists-on-the-conduct-of-large-scale-asset-purchases
Again, you don’t get to change the markers after you said L-shaped recoveries “don’t exist and have never happened”. I am glad you admitted looking at the World Bank link I gave, even though everyone here knew you were LYING through your phony mouth when you said you didn’t. This is a step forward in your progression to admit what everyone already knew—you LIED. That link didn’t agree with your fantasy playworld where L-shaped recoveries “haven’t happened” in relatively recent years. So the fact you pretended you didn’t click on the World Bank link I gave 2 seconds after you read the comment is no surprise to anyone here.
My personal favorite part of Barkley Junior’s sad flailing in the deep waters after he’s been busted:
“Oh, I just noticed.. Mosrs charges me with a “petty error” by saying athat L-shaped recovery curves do not exist.
Well, OK, Moses, name one thaat ever happened, ever,anywhere. ”
For all people’s reading pleasure, here is a DIRECT link to the comment. Please enjoy:
https://econbrowser.com/archives/2020/04/from-2010-some-economists-on-the-conduct-of-large-scale-asset-purchases#comment-236099
Moses,
OK, this already absurd discussion is becoming increasingly surreal. Pretty clearly since you have been caught lying about me on multiple occasions, you now have to accuse me of lying, in super capitalized and bold letters. Except that your claim is yet another lie, just digging yourself ever deeper into a very bad hole.
Let us start with the item that had you capping and bolding “lying” and “lied” you assert that I lied about not having connected to your link until I did when I said I did, which was when I did just yesterday when I went dredging back through all this crap, a huge waste of time, to find where it was I first nentioned the Mexico example of a possible L pattern, which you claimed I had not said. This claim by you led to a claim that I was lying, but then I found it showing that you were lying about your claim that I was lying on that. Truly gag.
So now you claim that I am lying about not having looked at thet atupid link you put up about Japan in the 90s from the WB. No, Moses, I had a policy of not reading your worthless links, but broke down and looked at it when I came across it a day or so ago during while wasting my time showing that you were luying aout me lying. As it is, you should be seriously embarrassed about that link. it does not remotely show an L. IIt shows a bunch of sharp ups and downs, whereas an L pattern should show a flat horizontal line. If I had looked at it way back when you claim I did, I would have pointed that out then. There you were putting up this piece of supposed evidence of an L-shaped pattern that not remotely resembled that. If i had produced that with what you claimed it would have shown you again behaving like a total idiot, but until you dragged it back it up here it was being ignored. In any case, sorry, you are lying with your cliem that I am lying about this. I onlyi looked at it when I said I did, only to find the figure does not remotely show what you said it did, even though I am open to granting that Japan in the 90s is a candidate for this.
On the matter of the title of the thread, yeah, I did a typo. It is 2010 not 2020. Big deal.
So, although this is now getting old, I made a claim that I then soon after modified on further thought. Yeah, I said there were never any L-shaped patterns, and then very quickly admitted that I was wrong and that there might have been some, but never any in the US. I mentioned Mexico in the 80s as such an example, still the best I am aware of, which you would later lie that I did not say then. I guess you think your WB figure from Japan in the 90s showed such an exmpale, but it does not do so remotely..
Let us keep in mind that this whole discussion using letters to describe macro fluctuation patterns is not scientific and is not susceptible to econometric testing. It is all handwaving. So we have had people throwing around V versus L versus J versus W, with me throwing my modifications of two of these, the lazy J and the wiggly W, which you have chosen to ridicule although without a shred of any substantial argument.
While we cannot test any of these economettically tny of these, there are important implications tied to them. Cochrane’s claim that we had an L pattern after 2008 plays into a false claim that there was near zero growth while Obama was president, a clear lie. The repeated claim by many in this discussion that we might have a V or a non-wiggly W implies that nothing has happened structurally to our economy as a result of this pandemic, that the Trump fantasy that all we need to do is reopen and the old economy will simply reassert itself as people rush out of their homes to spend like mad based on a huge amount of pent-up demand. We shall return almost overnight to “the greatest economy ever.”
No, neither of those looks right or reasonable. People will come out of their homes slowly, and many will not have money to fulfil their pent-up demand because they have been laid off, not to mention that many will be afraid for some to come to do many things they used to that involve large crowds. So, while I think we shall see some increase in GDP as people come out of their homes, meaning we shall not have a no-growth-at-all L, likewise that increased spending and growth will be slow, far slower than the previous decline was, the asymmetric pattern that leads to a lazy J, which might in turn become a wiggly W if a second virus wave appears to push the economy back down again.
I suggest that rather than attempting to find somehow some way I might have lied, Moses, how about addressing the issue in this discussion, what kind of pattern are we in ? What is almost certain is that it will not be an L, my original claim you have reproduced here. I stick with that and also the argument that the US has never seen an L.
Mexico in the 1980s might have been an L, and Japan in the 90s is a lower probability such case, although the figure you showed does not remotely look like an L, although apparntly you thought and still think that it does. Go look at it again, please. Not remotely an L.
BTW, Moses, please srop lying. This has long gone way over the top, but you just keep digging yourelf deeper and deepr into a hole of lies.
BTW, Moses, if you wanted to make your case for Japan having been an L in the 1990s, you should have linked to a figure showing GDP levels, not growth rates. I have not looked at one (not going to waste more time chasing down this stuff), but I am sure it would look more like an L, if probably kind of a bumpy one, than the growth rates one you linked to, which does not look like any letter at all and certainly not an L.
Interesting…… Well as Menzie should be well aware of by now I am the master of finding FREE gunk online. Visitors to the AEA journal website might find some fascinating facets therein…… happy hunting kids…..and get while the gettin’ is good.
I can’t remember if I posted this up already, but the great Evangelical “Christian” Mike Pence is now telling journalists, that if they don’t LIE about when and what Mike Pence and his wife heard before heading to the Mayo Clinic, then that journalist is not allowed to participate in coverage:
https://www.vanityfair.com/news/2020/05/mike-pence-mask-steve-herman
Mike Pence is about as Christian as David Koresh.
https://www.texasmonthly.com/articles/david-koresh-and-the-myth-of-the-alamo/
Also, as a side note so I can just wrap this up in one comment, the NRA wants you to know, “It’s good guys with guns that save us from bad guys with guns”. Or maybe just dumb guys that have a gun, and then shoot their own wife inside their own vehicle:
https://www.news9.com/story/5eab88ebf14ec70bb4f34afe/suspect-arrested-following-guthrie-walmart-shooting
These barbarians are embarrassing themselves. Haven’t they read the recent writings of world-renowned epidemiologist Barkley Junior??
https://www.japantimes.co.jp/news/2020/05/04/national/japan-closure-unregulated-meat-markets-china-coronavirus-wwf/#.XrCDoC2ZMkh
Well, the Japanese are so infamous for their truncated public education school hours, and their half-ass attitudes on science and math— I guess it makes sense they would poll opinions out like the one just above:
https://www.japantimes.co.jp/news/2016/11/29/national/japanese-students-mark-record-scores-math-science/#.XrCF6S2ZMkg
https://www.natureindex.com/news-blog/top-ten-countries-research-science-twenty-nineteen
http://ncee.org/what-we-do/center-on-international-education-benchmarking/top-performing-countries/japan-overview/
Certainly we know it couldn’t match the science education some old American fart got in the 1960s and ’70s so…… Yeah….. it was probably a “lab created pandemic”.
the japan times article makes no mention of the possibility that the virus could/not come from a research lab. it only indicates people have a concern about wet markets, something most of the world agrees with. it says nothing about a lab.
i would be careful extending peoples “opinion” into fact. many trumpsters are of the opinion that hydroxychloroquine will cure coronavirus. that does not mean it is a “fact”, even though it is believed by many. similar line of reasoning applies to wet markets.
at this point, we know the source of the coronavirus is in the same area as both the wet market and the virus research lab. as of today, we do not have the data to indicate which was the true source (or if another source exists). this is all that we know (at least publicly).
@ baffling
Your man-crush on Junior is so lovely.
I never tried to make people’s opinion into a fact. What I was trying to proffer for an audience of two (I thought it was and audience of one on this blog that thought the COVID-19 came from a lab) but thanks for setting me straight) was that the opinions of those with a better than average education in Science should probably take rank over a half-senile man educated mostly in numbers with only a very basic education in the sciences related to disease in the 1960s-’70s era, and/or a newspaper columnist who made his bones smooching the CIA’s a$$ by dishing out their “leak du jour” of any particular week.
my, you are a sensitive snowflake moses. one of your many problems is a similarity to trump. both of you thrive on the drama of the fight, even when it is pointless. i point out that popularity polls do not equate with fact, and you meltdown. and of course, you are incorrect about my assessment of the source of the virus. you simply created a strawman in order to vent. which is ok, i usually let crazy people talk if it eventually calms them down. consider it my pro bono contribution to your therapy.
@ baffling
Think of all the CIA crimes against humanity David Ignatius miraculously keeps silent on as he attempts to make very CIA agent he’s ever met into the most ethical Eagle Scout you could dream up.
https://www.counterpunch.org/2017/01/27/david-ignatius-the-cias-apologist-in-chief/
And Ignatius is “so concerned” about a supposed lab problem, that no one can verify other than people who want to climb the CIA leadership ladder to play snuggles with the orange creature and Mike Pence. And dumdum Junior, and the guy who follows dumdum junior like a puppy, get led to the CIA media “leak” sewage. Annoying….. and yet somehow hilarious at the same time.
Moses,
Ah, we are back to Ignatius made errors because he did not speak about things some people think he should have written about. Ethical violations are not the same thing as errors. YOu still have not delivered on that one. And of course the issue at hand is did Ignatius accurately report on views among some people in the intel communicity, and it is clear that this has turned out to be correct. There is an ongoing debate within the itnel community over the origin of the virus, with there being no resolution oof this at this time. It remains undetermined.
Of course the fact that Trump and Pompeo have loudly procleimed that the virud did come from a Wuhan lab absolutely guarantees that China will now do nothing to aid in actually determing the rea source, especially as it is now being reported that three more Chinese journalists have disappeared and apparently the Chinese government is cracking down on relatives in Wuhan of dead covid-19 victims for demanding answers to various questions. The Chinese govenment is notgoing to answer any questions from anybody, home or abroadd.
As for the WHO statement: absence of evidence is not evidence of absence. My bottom line is the same as Ignatius’s and apparently of all the US intel agencies: we do not know what the source was, but it cannot be ruled out that it came from accidentally from a Wuhan lab.
baffling,
Somehing more mysterious here is why Moses thinks anything I said here is connected at all to Japan or the things he links to about Japan, or appears to, such as their educational outcomes. I did agree with him that Japan in the 90s might have exhibited an L-shaped recovery pattern, even if the graph he showed awhile ago does not remotely look like an L.
YOu have to be careful here, baffling. He has gone completely nuts since I mentioned that maybe some of his obvious problems have something to do with the spouse of his father.
The good news is, donald trump doesn’t have to share evidence. Donald went to The Barkley Junior Vocational-Technology Community College of Harrisonburg Virginia, where donald learned if you keep repeating “the sky is red” at some point the people gathered around you will start repeating in mantra rhythm “the sky is red”….. “the sky is red”…… “the ky is red”…….
https://thehill.com/policy/healthcare/public-global-health/495983-who-says-us-hasnt-shared-any-evidence-linking
No news yet on if Barkley Junior has checked with CIA lapdog David Ignatius to see if the CIA approves of the WHO “wandering off the MAGA reservation”.
Gosh, Moses, you have caught me out. It was indeed my Junior Vocational Technology CommunityCollege of Harrisonburg where Trump learned how lie.. It must be true because David Ignatius told me so, :-).