From FT, by nation/group:
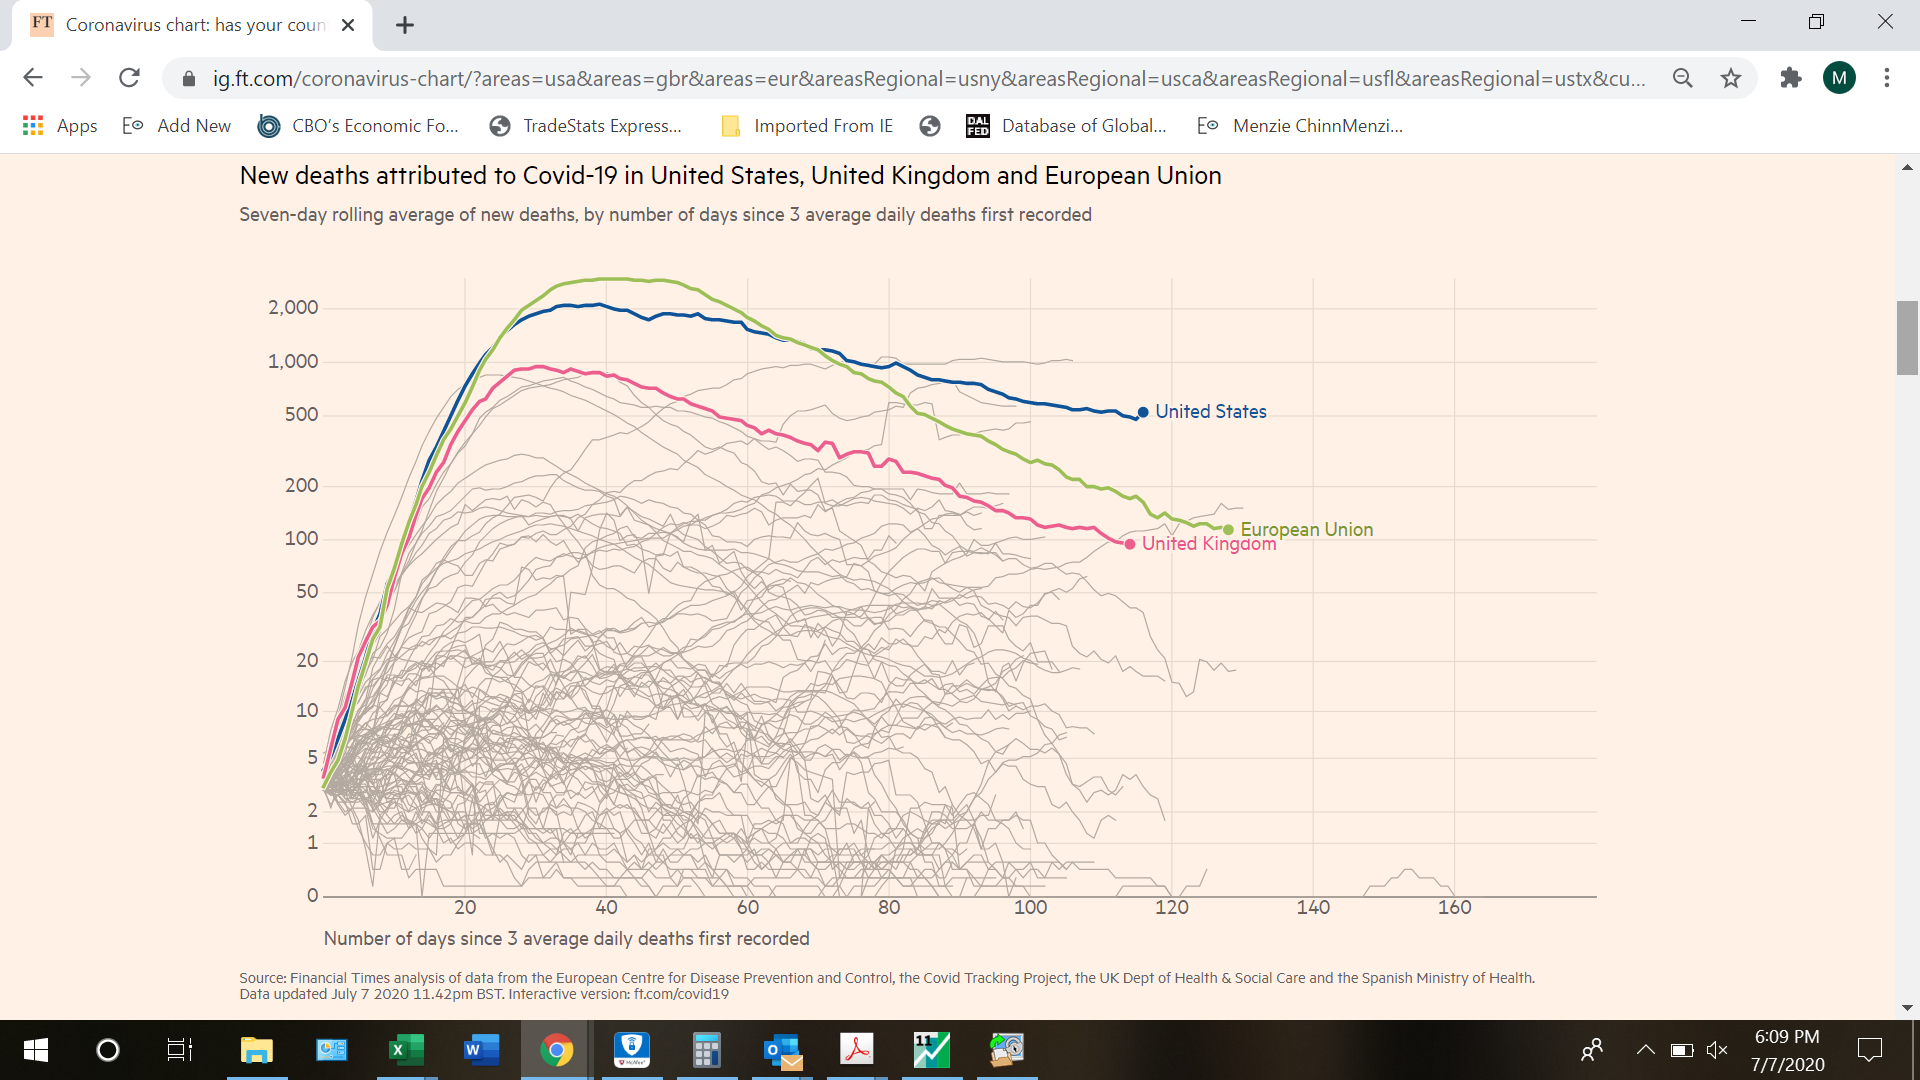
If you access the FT interactive feature, you will see that the 7-day moving average for US fatalities rose from 484 to 525 going from July 5th to July 6th.
By state:
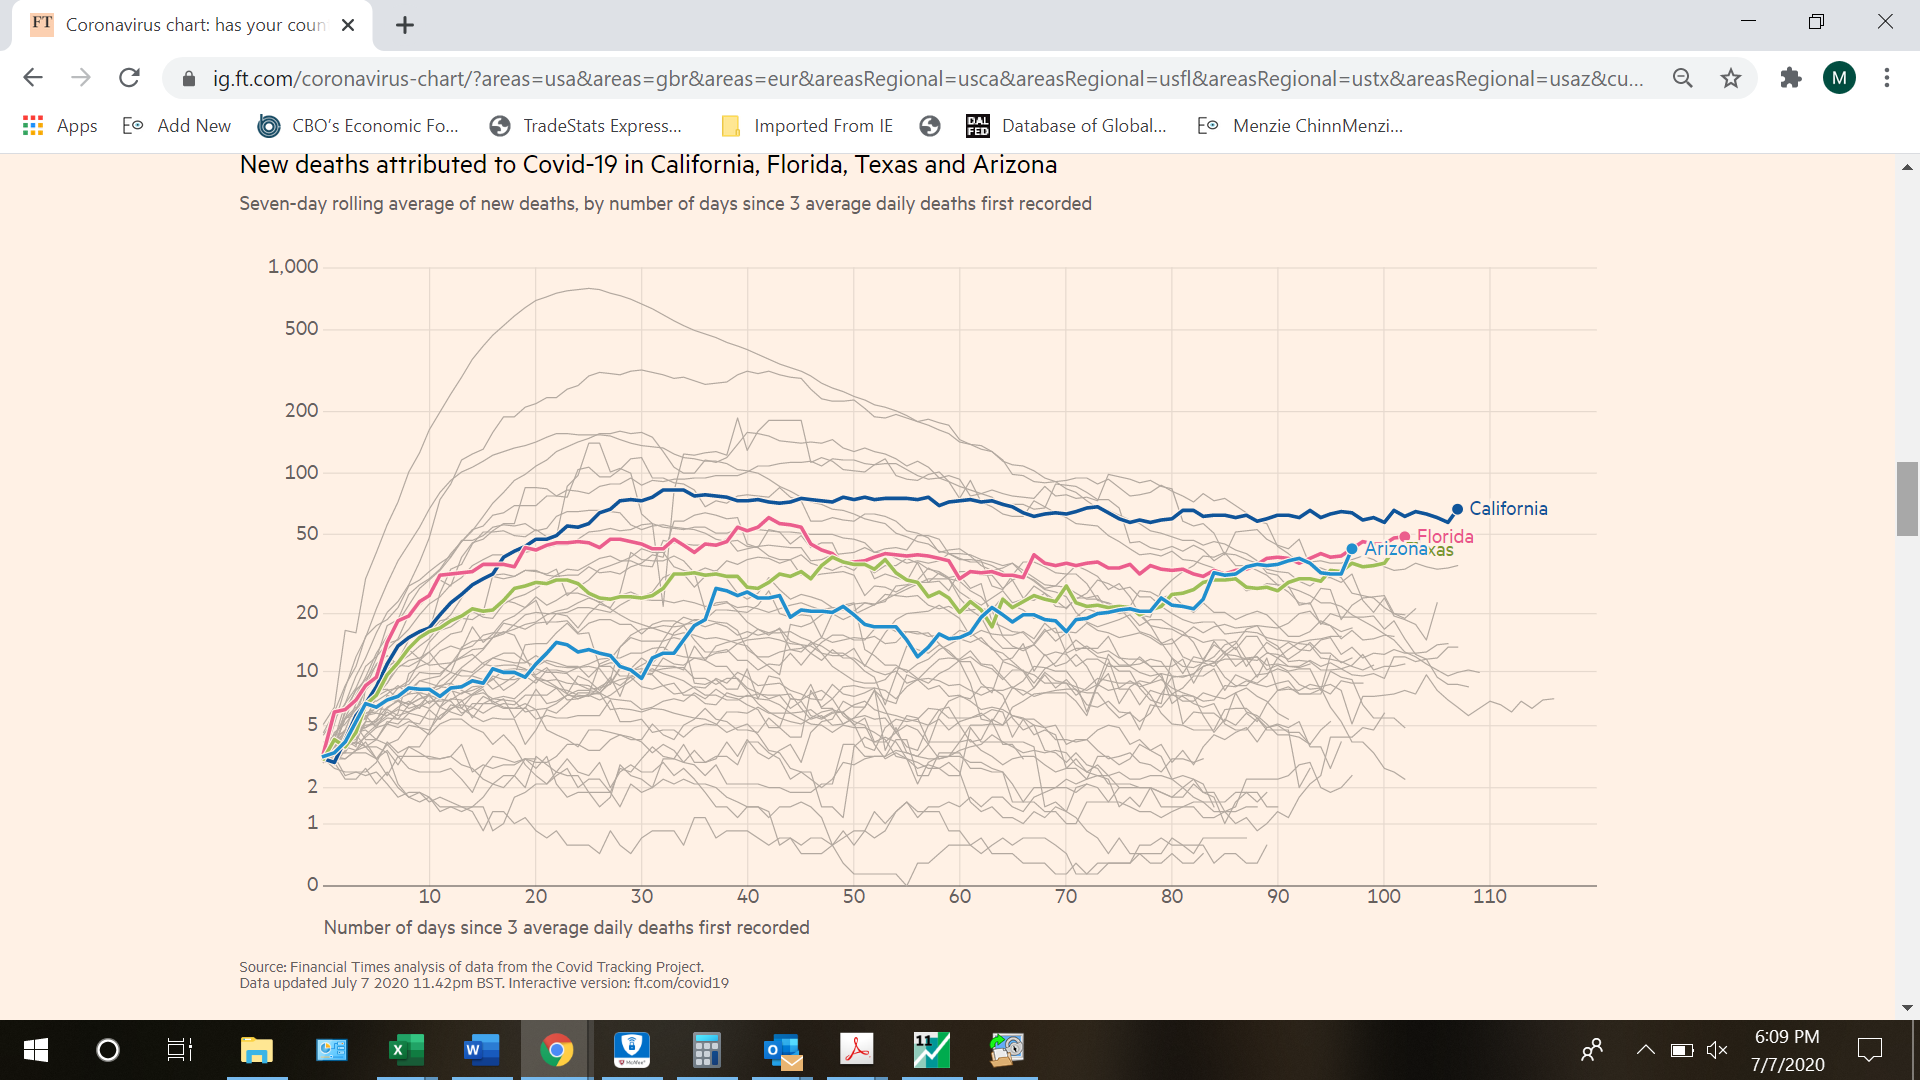
Accessed on 7/7/2020, 4:15 Pacific.
From FT, by nation/group:
If you access the FT interactive feature, you will see that the 7-day moving average for US fatalities rose from 484 to 525 going from July 5th to July 6th.
By state:
Accessed on 7/7/2020, 4:15 Pacific.
Under Kennedy we went to the moon. Under Trump we can’t even go to Europe.
Log charts are, in my opinion, inherently deceptive for this use and should not be used. They can make a huge increase in numbers look mild.
Wally,
Have you read Professor Hamilton’s explanation related to using logarithms?
https://econbrowser.com/archives/2014/02/use-of-logarithms-in-economics
I have now.
So here is specifically why the log graph is the wrong method in this case.
1. Note that every chart in Hamilton’s article is for a single case. (ie: growth in time of one asset or something like that). A log chart is fine for that. But none of those charts were meant to show a relative comparison.
2. When you make a chart intending to compare two or more things, the chart should visually do the same thing that it does numerically: it should make the comparison in an intuitive way. For instance, if the death rate from Covid is twice as great in one country as another, the line or bar should ‘read’ as twice.
So I stand by my comment: a log chart is an incorrect way to illustrate the point those graphs are intended to show. They are intended as comparisons – quite clearly – so they should visually compare.
If someone is continually and unfairly being accused of being “Biased”, using “log” can be a way of making the number look more conservative, thereby rendering the criticism less valid. I think it’s really he’s going to “catch shit” from people no matter what he does. I think under the circumstances “Log” is really not the bad way to do it.,
Checking this by state is informative. NY’s decline masked the rise in places like Florida. Evidence that doing the right thing is important. Of course we will like see Bruce Hall finding someway to misrepresent the data. He always does. MAGA.
Interesting discussion of how the happy news over the mortality rate from Team Trump compares to reality:
https://talkingpointsmemo.com/news/trumps-bogus-claim-about-our-lowest-mortality-rate-is-part-of-a-pattern
These charts would be much more informative if you normalized using per capita. Whenever I see totals graphed like this, I want to avert my eyes.
Neil Hornbeck: You can do this using the FT app. It’s easy!
I find it more useful to track the classic Case Fatality Rate (CRF) as this is commonly used in looking at previous epidemics. At present, it is an imprecise number as the total number of infections is not known with precision. I look at the numbers daily to see what the trend might be. The US stands at 4.3%. I continue to believe as more accurate numbers come in this will drop by about a factor of 10 but that is still higher than any other influenza outbreak other than the Spanish Flu of 1918-19.
One can do the thought experiment based on herd immunity. In the absence of a vaccine, we will need to reach the herd immunity point which is unknowable right now. To make the math easy, assume it to be 60% of the population getting infected and recovering. That is 198 M people and we are no where close to that. If you assume my CFR, total mortality ends up at 990 K deaths, totally unacceptable which is why we need to be doing so much more.
Like families, all pandemics are different in their own way. The Spanish Flu hit the young and otherwise healthy harder than the elderly, possibly because a genetically similar but less lethal version of the virus (probably) hit the world about a generation earlier and might have provided limited immunity to older folks during the Spanish Flu.
I agree that the observed CFR based on confirmed cases seems especially high, but what’s bothersome is that we’re well over four months into this pandemic and that number hasn’t budged much. It’s been hanging around 5% in the US for months and the global rate has been hanging around 5%. It’s fallen a little bit, but given millions of confirmed cases at some point we have to start taking that 5% number seriously. Some of that 5%-ish number can be explained away as hitting the elderly especially hard coupled with the unlikelihood of finding very many octogenarians who are COVID asymptomatic, whereas twentysomethings are more likely to be underrepresented in the number of confirmed cases. That would tend to drive up the observed CFR. Another possibility is that some of the serology tests (which were known to be bad) tended to generate a lot of false positives. A scarier possibility is that young people might get mildly infected just enough to generate some anti-body response without producing any meaningful immunity; i.e., it might require a heavy viral load to generate cell immunity. In that case, it might be better to just look at confirmed cases when thinking about the CFR.
As to the herd immunity threshold. Your 60% number is entirely plausible. Early estimates of the virus put the “R nought” for a non-immune society at ~2.4, which would indeed work out to a 60% herd immunity threshold. Of course, we’re no longer in “R nought” land and now we’re in “Rt” land, which is probably somewhere around 1.2, which works out to around a 15% herd immunity threshold. We’ve achieved the lower “Rt” because of masks, social distancing and lockdowns. But the herd immunity threshold doesn’t mean people stop getting infected, it simply tells us the additional percent of the population that must become infected before the number of new infections settles into a steady state “Rt” of 1.00; i.e., the number of new cases is neither growing nor declining. We really, really, really need to get that number well below 1.00 if we want to avoid hundreds of millions of people getting sick. Getting the number below 1.00 will extinguish the virus. Getting it well below 1.00 will extinguish even quicker.
some recent data does not bode well for the immunity path, and herd immunity. it does appear quite possible this virus does not create long term immunity. and the severity of first case seems to correlate with how strong of an immune reaction we get going forward. this very well means that we will not be able to obtain an effective long term vaccine and herd immunity, and will probably need to learn to live with this virus for a number of years. social distancing and masks will not go away soon. they will become a new way of life. i am most optimistic that a therapeutic will lead us out of this new normal. vaccines will probably need to be yearly, if they can last the long. we don’t have a vaccine against the coronavirus cold for many reasons, many of which also exist with covid19. rather than wishing this virus will go away, we need to develop a 2-3 year plan for living with it while we get it under control. otherwise the sudden starts and stops we place on the economy will be disastrous.
Yep, this is gonna be a slog. I don’t expect much from the early vaccines. There will be an initial shot and then a few weeks later a booster shot. The government will have to mandate vaccines except for medical reasons. I have no patience with anti-vaxxers at either end of the political spectrum. The vaccines will have to be free and easy to get. That’s going to be expensive, but it will be a lot cheaper than not doing it. As both a practical matter and a moral imperative the developed world needs to make the vaccine available to the less developed world.
The graphical presentation of quantitative data is inherently interesting. Whole books can be written about it. As a matter of fact, they have been. Anything by Edward Tufte is a good starting point. A statement to the effect that log charts are inherently deceptive is reductive silliness in the same league as claims that 99% of all coronavirus cases are no big deal (made at a time when the real-time death rate exceeded one percent–though that number will go down, hopefully).
Log charts are inherently deceptive when used to compare the size of one thing to another.
Trump blackmails schools if they do not reopen in the fall. They could have reopened if he had done things to help control the virus, rather than policies to try and get him reelected. Schools and the economy could reopen if he only pursued an agenda that reduces, not enhances, community spread of the virus. Simply a complete lack of leadership from the trump administration. Time for a change.
Of course it is misleading to say that Trump is not doing anything about the virus because he is pursing policies “to get him reelected.” In fact, it is a sign of his massive incompetence that all along he has been under the delusion that not closing and rapidly reopening while discouraging mask wearing and social distancing will “help him get reelected.” It should be obvious by now to him, although apparently not yet, that this approach is what may guarantee that he does not get reelected.Those govs following his bad advice are overseeing most of the states where we see the virus surging again, with these govs having to shut things down again (or for the first time), with the ujpshot that their economies will be damaged. Trump has somehow failed to figure out that the way to have a sustained economic recovery is to get the virus under control once and for all.
as recently reported about sweden, their model has resulted in more deaths and infections. furthermore, it does not appear to have helped the long term performance of their economy. they stayed open, some people got drunk, and the economy still tanked. and the death toll went higher. sweden has shown that a lock down saves more lives and provides similar longer term economic performance than no lockdown. we will show this once again when florida and texas renew their lockdowns, either officially or by default from people simply staying home. the second lockdown will be highly disruptive and will drag out the economic uncertainty associated with the virus.
Trump has somehow failed to figure out that the way to have a sustained economic recovery is to get the virus under control once and for all.
Worse still, the Idiot-in-Chief doesn’t seem to understand that kicking foreign students out of US universities actually hurts economic growth because it lowers Net Exports. What a moron.
Even the wretched Prime Minister in Australia recognizes that the Hong Kong security law presents an opportunity to attract and retain intellectual talent. He announced 5-year visa extensions and a path to citizenship to students and others from Hong Kong
https://www.theguardian.com/australia-news/2020/jul/09/australia-offers-five-year-extension-hong-kong-visa-holders-extradition-treaty
Our best offer: covid and a cage.
but it rallies his base. is all about gratification from an adoring audience.
even with the current school reopening thing, its about his base. while he makes everybody around him take a coronavirus test before contact, he is pushing to reopen schools with no protections for the students or teachers. but many in his base dislike teachers and their union. and since he argues publicly (and incorrectly), that youngsters are immune to the virus, his ultimate target is the teacher who is vulnerable. and many in the community relish the opportunity to stick it to the teachers-that is his base. teachers are forced to resign for health reasons, or risk their health for a job. trump is all about forcing people into making choices they would never otherwise make. he thrives in this type of disruption, mostly because he is a sociopath.
https://talkingpointsmemo.com/muckraker/as-covid-surges-again-experts-forecast-hundreds-of-thousands-more-us-deaths
‘Epidemiologists and demographers painted a dark picture in conversations with TPM, estimating that total U.S. COVID-19 deaths this calendar year could range from 260,000 to 500,000.’
Wait what? Trump said there would be only 1 death. Then he said it would be only 60 thousand. Oh wait – we have already past 130 thousand.
Of course Team Trumpsters tell us that Obama did a horrible job during the swine flu. Team Trumpsters like Bruce Hall tell us only death matters but how many Americans died from the swine flu? Two.
Now Bruce Hall wants us to believe we will have very few deaths going forward. But the low end of this forecast has our death toll double by year end. I guarantee this – Bruce Hall will call 260 thousand deaths no big deal.
pgl
It’s no big deal because the deaths are concentrated in immigrant and brown & black families. Apparently they don’t count…and he sure doesn’t want their votes to count. If you’re a sociopath like Donald Trump, minority deaths from COVID are a feature, not a bug. Trump intends to keep “Murica” great for the true “Muricans” who live in places like The Villages.
For those who prefer data:
https://scontent-ort2-1.xx.fbcdn.net/v/t1.0-9/107502953_792820681535146_3318813338955876139_o.jpg?_nc_cat=110&_nc_sid=1480c5&_nc_ohc=LLAJmqTEA_AAX9N1_au&_nc_ht=scontent-ort2-1.xx&oh=61999160638238ee4cba9f6d4d8a5d66&oe=5F2CE28B
Bruce Hall: Or, better yet, see CDC spreadsheet and graphic depicting underlying data, statistical significance, all here. A real analysis, here.
“There were approximately 781 000 total deaths in the United States from March 1 to May 30, 2020, representing 122 300 (95% prediction interval, 116 800-127 000) more deaths than would typically be expected at that time of year. There were 95 235 reported deaths officially attributed to COVID-19 from March 1 to May 30, 2020. The number of excess all-cause deaths was 28% higher than the official tally of COVID-19–reported deaths during that period. In several states, these deaths occurred before increases in the availability of COVID-19 diagnostic tests and were not counted in official COVID-19 death records. There was substantial variability between states in the difference between official COVID-19 deaths and the estimated burden of excess deaths.”
I guess we will have to wait for the authors to measure the COVID deaths for June. Or we can use Bruce Hall’s outstanding analysis which would show zero deaths for June. How did he get this result? Wilbur Ross told him.
Menzie
Thanks. I have all of that data downloaded. I know that there are some objections to using official death counts because they require actual death certificates indicating cause of death and don’t rely on models or The Washington Post. And I realize that the CDC does try to categorize overlapping causes of death for Covid-19, pneumonia, and influenza. I also realize that the system is rife with inconsistencies. But for now, it is the best available for a national look. https://www.cdc.gov/nchs/nvss/vsrr/covid19/index.htm
Once you burrow down to state levels, there are all manner of strange reporting inconsistencies which must be overlooked for aggregating to a national level.
The gap between reported COVID-19 deaths and excess deaths can be influenced by several factors, including the intensity of testing; guidelines on the recording of deaths that are suspected to be related to COVID-19 but do not have a laboratory confirmation; and the location of death (eg, hospital, nursing home, or unattended death at home). For instance, deaths that occur in nursing homes might be more likely to be recognized as part of an epidemic and correctly recorded as due to COVID-19. As the pandemic has progressed, official statistics have become better aligned with excess mortality estimates, perhaps due to enhanced testing and increased recognition of the clinical features of COVID-19. In New York City, official COVID-19 death counts were revised after careful inspection of death certificates, adding an extra 5048 probable deaths to the 13 831 laboratory-confirmed deaths.19 As a result, the all-cause excess mortality burden from March 11 to May 2, 2020, is only 27% higher than official COVID-19 statistics.19 This aligns well with our estimate of 26% for a similar period in New York City, using a slightly different modeling approach.
I’m not trying to estimate missing death reports or project future deaths. What I am showing is that, as the death certificates are processed, there has not yet been shown an increasing trend of deaths overall, despite revisions and despite the fact that the states “opened for business about 7 weeks ago. I don’t see any inconsistency between what I provide as a graphic and the CDC graphic of “excess deaths” https://www.cdc.gov/nchs/nvss/vsrr/covid19/excess_deaths.htm. It shows the same downward trend in deaths since early April which should not be surprising because it is the same data. Only the “excess deaths” dimension is added and that’s fine, but hardly adds much to the discussion since the deaths have already been categorized.
I pointed out that “cases” are correlated to the amount of testing because now asymptomatic/very mild infections are being identified through such widespread testing so April cases ≠ July cases. I have also provided a link to information that looks at the changes in “case” testing and, specifically for the state of Florida, issues with some of the testing facilities having no negative results. As I stated in other posts: cases ≠ deaths. Treatment options and policies concerning nursing homes have been improved.
So, while all of these elaborate reports and “excess deaths” estimates are fascinating, they don’t show the changes to death counts from one reporting period to another which I what I have provided and which clearly identifies that in the current report, more than half of the “new deaths” were actually adjustments to the 2/1-6/6 data, not current deaths. I fully expect such adjustment to the June/July period in future weeks, but we won’t know until then the scope or if there is a reversal of the downward trend in the CDC reported death counts.
Until then, all other reports are estimates, not official. Perhaps they are good estimates; perhaps they are not. If the CDC does not feel confident in using the estimates from modeling sources for reporting deaths, then I guess I’m not all that confident either. After all, what could be better than “official” data?
https://www.dropbox.com/s/jl8vlw7vkzzmtjt/Covid-19%20Weekly%20Death%20-%207-14-20%20Report.pdf?dl=0
Wow. “Analysis” like that explains why I never bought a Ford product.
Did you learn data manipulation from John Lott or from Lawrence Kudlow? Come on Bruce – original sourced data. We’ve been over this before and you still don’t get it?
Kia Soul!!!!! Kia Soul!!!!! Kia Soul!!!!!!
For much of the pandemic, deaths lagged infections by about four weeks. If that holds true now, we in the US are about to find out the degree to which the drop in the death/case ratio is due to a younger infected population plus better-informed treatment instead of just due to the lag between infections and deaths.
Sadly, I think deaths will have to rise quickly again before we can get enough Americans to make enough modifications in their behavior. We need the rise in deaths plus some counter examples — states where individual and government-ordered behavior changes have kept cases and deaths from rising.
Good point which a lot of people would also note. But shhhh – don’t tell Bruce Hall. After all – we don’t want him to have one of his hissy fits!
As if on cue, Pence said, “Fatalities are at the lowest level since March…” Any way you look at it, log or not, they’re headed higher from here. The up trend will be very convincing by the ides of July. 🙁
Some of medical experts are predicting COVID deaths to be between 260 thousand to 500 thousand. Of course Trump sycophants like Bruce Hall will declare that this death count was no big deal.
He said that today? That will certainly help his credibility.
The percentage of positive tests is unnerving in some places. The way this virus works or seems to means that there is potential for long term damage and the resulting loss of productivity. The lessons of 1919 escaped him.
Washington is having a higher number of reported cases, but the positive percentage was 5.3 today. It means nothing by itself. The overall trend is down, which means we are testing more and finding more infections that way. It is cold comfort, but it is what is supposed to be happening. I recall that the goal here was to do enough testing that the rate goes below 5% and stays there. Keeping the positive rate down also means keeping doing the things we have been doing without any let up. That will be a challenge.
Trump today: “For the 1/100th time, the reason we show so many Cases, compared to other countries that haven’t done nearly as well as we have, is that our TESTING is much bigger and better. We have tested 40,000,000 people. If we did 20,000,000 instead, Cases would be half, etc. NOT REPORTED!
And if we stopped checking pulses we would have fewer dead people!
Republicans have a lot to answer to for inflicting this abomination on the Americans and the world.
joseph,
What did Trump say that was incorrect?
“our TESTING is much bigger and better.” That’s a lie and you know it. Oh wait – Trump lies about everything so it is all good. The words he uttered after this were perhaps the dumbest thing he has ever said. And Trump has said so many dumb things.
Come on Sammy – even a village idiot like you knows better. At least I hope you are not THAT DAMN STUPID!
confederate president trump is incorrect. if we cut the number of tests in half, we would not end up with half the number of cases. and you would have a higher test positive ratio. sorry if you are unable to understand this sammy.
All of it. Everything in that Trump statement was factually wrong. He was lying. Sammy, you seem to be one of the few grossly misinformed people who do not have the necessary facts to figure it out instantly. The number of people who avoid facts is declining for a variety of good and bad reasons. That is why trump will be a one termer.
Trump has a thing about bigger and better. I bet he tells all the ladies that he is SO big where it counts. Of course Melanie knows he is just the opposite.
Trump: “For the 1/100th time …”
He means 0.01 times? No wonder Trump had someone else take his SAT test. Explains a lot about his other problems with numbers like his 6% growth rate. You can’t be sure he understands percentage … or the number 6.
First it was “We need more testing, Trump is incompetent!” Now that there are more tests, there are more cases “Cases are rising, Trump is incompetent!”
Instead of daily trumpeting of more cases, how about a story like this: “New confirmed cases are __________, approximately __________% of the rise is due to increased number of tests and _____________% are due to the presence of antibodies, not new infections. So the true new growth in infection is ___________ or _________% The mortality rate based on the age of the new cases drops to _____%. from a peak of _______% in Mar-Apr.”
We don’t get that kind of useful information. I wonder why not.
And now a colleague of Menzie’s has died, and unconfirmed rumor has it that he died of the Covid-19.
I must update this that Menzie’s colleague did not die of Covid-19, but apparently followed the unfortunate examples of the late Alan Auerbach and Martin Weitzman, although perhaps he had become depressed about the pandemic and other things gong on now.
@ Barkley Rosser
Confused. Alan Auerbach?? Did you want to explain that??
It was Alan Krueger. Sorry about the error. I am upset about this right now. I met Krueger but did not know him well. I knew Marty Weitzman much better, and also Bill Sandholm much better. I put up both Facebook and Econospeak posts about Bill’s death, in both cases initially passing on the false rumor that he died of the coronavirus, while noting it that it was not confirmed. I did that here as well, I note, I did not mention his name here initially, basically out of not wanting to put Menzie on the spot.
I can confirm, as I am sure Menzie knows well, that Bill had a “wry smile.” I now view that in a different light than I did in the past. I was aware in both the cases of Alan and Marty that they had problems with depression, especially Marty. But I was unaware of this with Bill.
I noticed there was a large abundance of compliments relating to Sandholm’s strong attributes as a student adviser and champion for his students. It speaks very highly of the man.
Here is an In Memoriam to Bill Sandholm, who will be remembered.
People are not understanding the COVID paradox
In the USA,the exposed cases are at least 20 times the number of the current detected cases,of 3.5 million,AND THE ACTUAL INFECTED CASES ARE AT LEAST,1O TIMES the current detected cases.
The current daily count in the USA is around 70000 and was around 25-30,000,a fortnught ago.These incremental 35000 were EXPOSED around 27 days ago (at the earliest) and were INFECTED ENOUGH,to take a TEST.
Therefore,it is safe to assume that for every 70000 cases today there are at least 70000 more INFECTED BUT NOT WITH SUFFICIENT SYMPTOMS TODAY plus some more WHO DO NOT WANT TO GET TESTED AT ALL.
Further,for every 1 COVID positive person WITH SYMPTOMS – it is safe to assume an EXPOSURE RATIO OF 10:1 IN A SPAM OF 30 DAYS – starting from the time when the COVID +ve person was 1st EXPOSED.
So for the 70000 cases today, there are AT LEAST 70000 more COVID positive person (based on 1 day’s data),which makes it 140000.These people have exposed at least 1.4 million in the last 30 days !
So,if you look at the number of cases in the USA in the last 30 days at 30000 a day,so you have a ROLLING stock of 6 million EXPOSURES just in 30 days – who will show symptoms in the next 7-30 days,and so the numbers will skyrocket.
Based on a population of 350 million – IT IS ONLY WHEN THE USA has 17-20 million DETECTED CASES – that the COVID saga will end.There WILL be NO CURE,AND NO VACCINE – just trial and error diagnostics.
So we are a long way away.dindooohindoo
30 days ago,the USA COVID cases were around 1.5 million and so the EXPOSURES were at 30 million.From that 30 million – in the last 30 days – the USA has had around 35000 cases per day,in the last 30 days – which is around 3% of the EXPOSURES,as of 30 days ago.
The Rolling stock as above,WILL DOUBLE IN A MINIMUM OF 30 DAYS and the 3% will also DOUBLE IN EVERY 60 DAYS
at the minimum.These are the coordinates of doom.
There is NO STATISTIC on 1 PARAMETER.How many COVID discharged humans in the USA were re-infected,and in what
duration ? That is the ONLY HOPE – id.est., to be infected and survive.Can it REALLY BE ZERO ? Or does it show THAT releasing a COVID cured patient into the jungle – is the biggest disaster – a ticking neutron bomb ?
USA numbers look devastating,as they have the infra,to test on that scale.The situation in other parts of the world is BEYOND redemption.
Even in the USA,the sharp rise in Cases,is NOT DUE to the re-opening of businesses – BIT DUE TO LACK OF TESTING.It is the people who WERE NOT TESTED,in the last 30 days,AND HAD synptoms – which is reflecting in the current data,of 70000 a day.
You can imagine the CATASTROPHIC DOOM,in Brazil and India – where THEY WILL NEVER be able to test,on the American scale.
In essence,the entire population of 7 billion,HAS TO BE infected,and at least 10%,will die due to COVID,and 10% more will die,due to other morbidities,which will have no medical attention and another 10%,will die due to starvation.
The persons who will die,are those,with a weak and infirm constitution,and low natural immunity – and whose body,is already damaged by medicines,steroids,nicotine,cocaine,adulterated food and alcohol.
A Perfect Constitution,is an essential,for a Perfect Brain
This is the Greek Formula,updated for AI + Robotics + Nanotech
The Greeks used to discard their defective samples,at BIRTH,on Mt Olmypus,for the ravens and vultures.That was he Priori Best Practice.2000 years since then, AI + Robotics + Nanotech, has made Humans obsolete.
Thence,comes in COVID – just like Pure Providence.After the 10+10+10% culling – we will get the NEXT virus – which will be in action,by November 2021.That virus will target,in Phase 1,the clowns CURED BY COVID – as the COVID bird has laid its nest in them.Then it will target those who were infected by COVID but did not show the symptoms.
Like a never ending Geometric Progression – towards redemption and salvation,like Zeno’s Paradox.