The Fed’s new framework, as described by Chairman Powell, mentions “shortfalls” (particularly in employment), instead of deviations of the natural rate. The output analog of this shift is moving from the deviation of output from potential (i.e., output gap) to an output slack measure. If we interpret this as requiring a focus on a Friedman-esque plucking model of maximal output, rather than potential GDP as described in most textbooks, what does this mean for where we are right now? I’d say for the short run, we are still in for a world of pain, economically speaking…
Following the description in this post (see also this post), I implement a Delong-Summers (BPEA, 1988) measure of maximal output.

Figure 1: GDP (bold black), August Survey of Professional Forecasters mean forecast (light blue), CBO potential GDP (gray), pseudo-Delong-Summers (k=5) using actual data and CBO projections of GDP to 2030 (red). NBER recession dates shaded gray; assumes latest recession ends 2020Q2. Source: BEA, CBO An Update of the Economic Outlook (July 2020), NBER, and author’s calculations.
The formula used is given by recursive application of Delong and Summers (1988) equation 17:
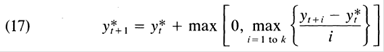
Where y* is potential GDP, and k=3 to 5. I calculate using annual data, then interpolate using quadratic match to quarterly frequency.
This implies the following for (log) output gap or shortfall:
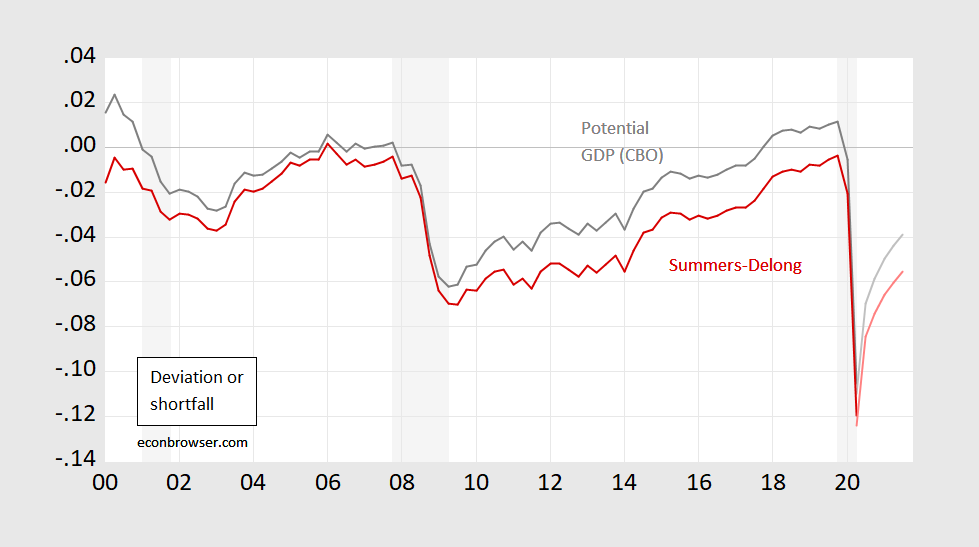
Figure 2: Log output gap using potential GDP (gray), or log shortfall pseudo-Delong-Summers (k=5) using actual data and CBO projections of GDP to 2030 (red). Q3 data uses August Survey of Professional Forecasters mean forecast. NBER recession dates shaded gray; assumes latest recession ends 2020Q2. Source: BEA, CBO An Update of the Economic Outlook (July 2020), NBER, and author’s calculations.
For the moment, economic activity looks very down regardless of measure. In Q2, it’s 10.5% vs 12% (conventional gap vs shortfall). Even after a forecasted jump in Q3, it’ll still be 6.9% vs. 8.4%
Professor Chinn,
I got a “Page Not Found” comment when clicking on “Summers and Delong (1988)”.
I was hoping to see how one computes the equation.
AS: Sorry about that. Fixed the link; the correct one is: https://www.brookings.edu/~/media/projects/bpea/1988-2/1988b_bpea_delong_summers_mankiw_romer.pdf
@ AS or, anyone really……
I just set up 2 vectors for weight and height for 6 different hypothetical people then got one vector to divide another vector after the denominator (height) had been squared (to calculate body mass index). This is probably the most complex thing I have actually done (not read about) ever in “R” program, although I think some months ago I might have done a ggplot graph basically by rote copying something out of a book.
I am now the Bruce Hall of “R” programming, can I get some applause here?? (It’s ok, I will accept fake and/or patronizing applause, I just need some applause)
I have the extreme bad habit of stutter starting on a lot of these texts, get a few pages in, getting semi-excited I may have found the right text, hitting a snag than quitting (although in defense of myself my last computer broke down right in the middle of some progress) I like the ones that kinda teach “R” and stats “side-by-side” or congruently (although yes, having the stats base first is the best way).
I am having similar experience in this book I am using now, I am still very early on in the book. But I do like this presentation VERY much. I have already (yes on a VERY simple example) done a standard deviation, and am about to run a t-test which I have not done in FOREVER (I think the last time I did a t-test would have been in the late ’90s in a “Quality Control” undergraduate stats class, that was getting me general requirement credits). There is some kind of fun in this, doing a very simple t-test, even though the basic idea isn’t gone into until Chapter 5 of this text. You’re doing something, and when your doing it the command code and proper way to use “R” starts to stick in your mind, as well as kind of “waking up” those parts of your brain that haven’t used certain things since college.
Is this just Powell’s overly-convoluted way to say “In the year 2020 and for sometime after, the FOMC will be worrying more about employment than inflation, because as far as we can see, inflation is nearly no threat now. But I can’t say we are not going to pay much attention to inflation right now, because I am a cowardly bureaucrat and if on the small chance inflation does pop up, saying this bluntly could cost me…….. Oh, and by the way interest rates offered on your savings deposits will be near zero until the Earth’s ice caps start reforming. Good night everybody!!!!”.
I must be near blind because I think I skimmed that paper 4 times before I found that equation. It is towards the bottom of page 459 of the Brookings publication the paper is in if anyone else was having issues locating that.
Moses,
I get the sense that you and I need some coaching by Professor Chinn to be able to evaluate equation 17.
He wouldn’t be the only one.
Recursion is hard.
@ AS and friends
Doing the math obviously I’m largely clueless. I think conceptually I get a decent amount of it. The y is actual production/output of an individual. y* is basically representing what he would have produced/output had there not been COVID-19/recession. “k” obviously represents how many years out you’re going. I’m assuming they use 3-5 because the farther you go out (even 5 is probably “pushing it”, the assumptions in the growth model become more unrealistic. The model of growth assumes “potential growth” (y*) is (would have been?) smooth—which explains why it is kinda a “straight line” and the margin is relatively constant between actual y and potential y*
The data for output per person is from a Christina Romer paper. The authors say that they use it because it is the least favorable to their conclusions.
If I have misread or misinterpreted this in any way I am happy to be corrected by Menzie, Prof Hamilton or whoever. Considering I mostly only skimmed it around the section with the #17 equation and them skimmed the conclusion portion, I don’t think I got the idea to bad–but again am very happy to be further enlightened or corrected in any errors here.
BTW, I found some stuff on Recursions online, and even as it relates to “R” program, but nothing that really had any lightbulbs appearing over my head or great cognitive echantment on how to crunch out the equation.
*enchantment
“e-chantment”?? I think I just accidentally created a great name for an internet dating service.
Speaking of numbers (see how nonchalantly yet slightly coy I did that??) the BEA “second estimate” of 2nd quarter GDP was quoted at 1.2% more positive (less negative??) than their initial quote. The BEA Q2 GDP number went from negative 32.9 to negative 31.7. Bringing my negative 28.88% number from 4% wrong, to 2.82% off.
The “mathematical economist” of Shenandoah Valley way says he still loves his V shape recovery call. What an amazing individual. Tomorrow we’re taking him down to D-Hall and see if he can count the number of entrées on his lunch tray.
Holy cow, Moses. Are you still claiming that what we saw after the economy turned around did not make a V? Pretty much everybody here accepts that it was exactly that. Look at the many figures Menzie has posted here. They all look more like a V than anything else. Are you blind? You have been challenged to say what it looks like, that you should put up or shut up. But you have not put up and continue to spout this utterly stupid drivel.
I remind you that I have stated from June on that the V would flatten. It has. I am right, and everybody who has commented on this, aside from you, agrees with me that we have a V that has flattened. How long are you going to continue claiming that it is not that, especially when you fail to say what it does look like? Put up or shut up.
I grant that as you said of me I shall say of you, that your morals remain above those of Rick Stryker and CoRev and some of their other pals, and a major reason for that is that at least once in awhile you are willing to admit to having made a mistake, although you do not do so very often. But they follow Trump and Roy Cohn and simply never ever do so. It is always move the goalposts or change the topic when they are nailed for being wrong. But in this case you are really sinking into their stink: you are simply massively wrong on this shape of the GDP pattern, and you really need to admit it. And if you are not and are not willing to say what your alternative to the V-that-flattened, then shut up. Put up or shut up.
Barkley,
You should follow your own admonition to put up or shut up.
A couple of days ago I called you again on your continuing BS. You claimed that my convergence result depended on certain assumptions, which you insinuated that you knew, in an attempt to pretend that you knew the result that you described initially as “blubbering gibberish” all along. But of course I know you don’t understand econometrics at all. So I challenged you to list some assumptions that were general enough that they’d be OK for the applied econometrician to proceed (or not.) Of course, you couldn’t do it as I expected. I gave you a couple of days to respond just as did before. Against my better judgment, I will now give you another free lesson in econometrics. But this really does have to be the last one. If you want more, please sign up for my free market econometrics class at Wossamotta U.
If you actually knew what you were talking about, this is one acceptable response:
The processes that RS considered were
Y(t) = a + Y(t-1) + e(t)
X(t) = b + X(t-1) + u(t)
We need to write down conditions that e(t) and u(t) should satisfy. Those conditions are
1) e(t) and u(t) have in general (but doesn’t have to be) an infinite moving average representation where for example
u(t) = M(L)v(t) and
M(L) = sum(i=0,i -> infinity,m(i)L^i) , where L is the lag operator
2) sum(i=0,i->infinity,m(i)) != 0 and M(L) is one-summable, i.e., sum(i=0,i-> infinity,i|m(i)|) is finite
3) E(v(t)|v(t-1),v(t-2), ….) = 0
4) (1/T)sum(t=1,T,E(v(t)^2|v(t-1), v(t-2),…) -> almost surely E(v(t)^2) = sigma^2 > 0 as T -> infinity
5) E(v(t)^4|v(t-1),v(t-2), ….) exists almost surely for all t