NY Fed, Atlanta Fed, St. Louis Fed, and IHS Markit released nowcasts today.
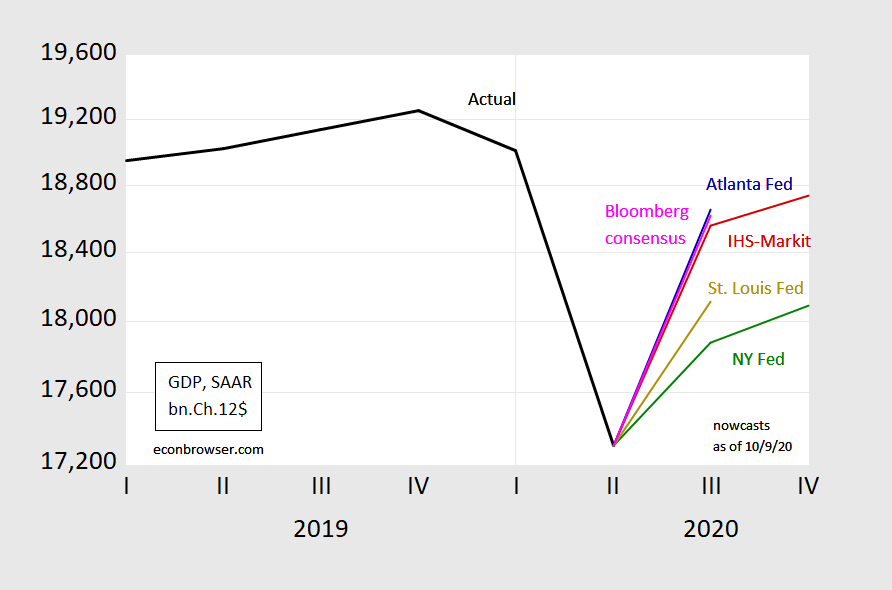
Figure 1: GDP in bn. Ch.2012$ SAAR (black), Atlanta Fed GDPNow (blue), NY Fed nowcast (blue), St. Louis Fed nowcast (chartreuse), IHS Markit nowcast (red), Bloomberg consensus. Source: BEA 2020Q2 3rd release, Atlanta Fed, NY Fed, St. Louis Fed, IHS Markit, Bloomberg, author’s calculations.
The NY Fed nowcast of growth is substantially lower than that of Atlanta Fed’s GDPNow. In normal times, with 21 days to the advance release, one would put greater weight on GDPNow.
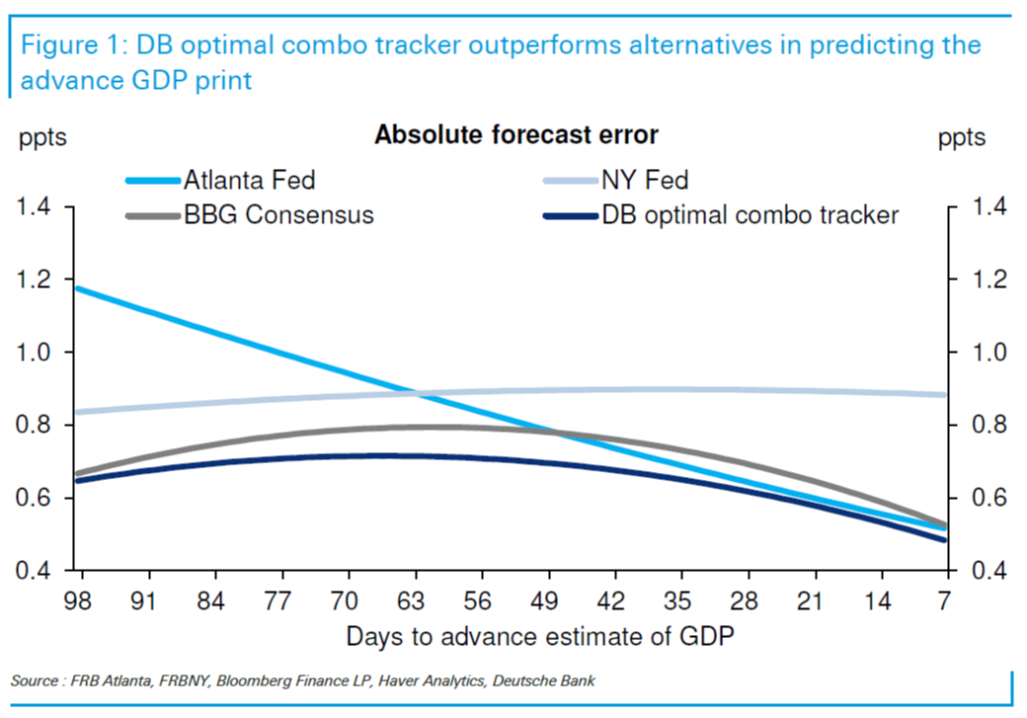
Source: Luzzetti, et al. “Tracking the GDP trackers,” Deutsche Bank US Economic Perspectives, 24 July 2019.
Jim Hamilton described how the NY and Atlanta Fed nowcasts differ:
The forecast the two approaches start the quarter with is one of the key differences between the two models. The Atlanta model begins with separate forecasts of 13 individual components of GDP, such as personal consumption expenditures on goods, PCE on services, and investment in equipment. The start-of-quarter forecast is based on a regression of each component on 5 quarters’ lags of all the components, with the regression coefficients heavily weighted toward a random walk using a Bayesian prior, according to which the best forecast of next quarter’s equipment investment is probably not too far from whatever the number was for this quarter. By contrast, the New York model begins with a “top-down” approach, starting with a forecast of overall economic activity based on the best current assessment of overall activity.
These two nowcasts, as well as that from IHS Markit (formerly Macroeconomic Advisers) use largely the same data.
The St. Louis Fed nowcast adopts an approach using different data:
Our approach augments a consensus forecast of current-quarter real GDP growth by adding the news component of several key economic data releases. To do so, we first create an “economic news index” (ENI) based on the surprise component of key monthly economic data releases and then use that index to update Blue Chip Consensus (BCC) forecasts of real GDP growth as we move across the quarter.
Using monthly data to estimate quarterly headline GDP categories such as FRED series: PCECC96, I am finding forecast values for GDP at 18,645 for 2020Q3 and 18,591 for 2020Q4. Values closer to the Atlanta Fed and Bloomberg consensus than to NY Fed. I bow to the experts, but it is fun to make the forecast effort.
@ AS
I respect your efforts probably more than you imagine. and you’re obviously way farther along in your math and work ethic than I am. However, I am not sure if you have learned your lesson from your last quarter’s “poor results” (I hate to word it that way, but your numbers were WAY off, and worse than mine were, even though I am a lazy SOB, and can’t even hardly crunch a simple OLS regression). The big “takeaway” here (as the kiddies say) in this post couldn’t be more clear than if Menzie took a large cement brick off a construction site and hit you in the head with it. Hamilton’s descriptions of the different Nowcasts and the Deutsche Bank “optimal Tracker” is what you should be focused on here as a forecaster. The MIXTURE of the different forecasts instead of just one (You can put your own results in that MIXTURE of GDP forecasts) is going to get a you a better FINAL forecast number than what you are doing.
Somebody (you, AS?) recently pointed to a 2 factor fed GDP forecast model. Is that what you’re usibg here?
For the previous forecast I used two factors, non farm payroll and real personal consumption. That forecast approximated the mean of the September WSJ forecasts. For the latest forecast, I used monthly data (where available) to forecast the various headline GDP categories, consumption, private domestic investment, exports, imports, and government expenditures and gross investment. FRED series: PCECC96, GPDIC1, EXPGSC1, IMPGSC1, and GCEC1. This model may be overly optimistic.
The two factor model is from FRBSF: https://www.frbsf.org/economic-research/files/ingenito.pdf
Moses,
Thanks for the comments.
You are right, my last PAYEMS results were bad! I understand the averaging concept, but wanted to use one model that seemed to be the best of my various attempts. As of the prior WSJ consensus release, my forecast for GDP was at the average of the participants. This month, the forecast jumped.
Being wrong, helps me to work harder, so I shared my forecast. My forecast for the change in Nonfarm payroll for October is 700,000.
If I am way off this with these forecasts, I won’t release any additional forecasts. Prior to the pandemic, my submitted forecasts to the FRED game were pretty good, and scored several times in the top 10% over the past two years.
@ AS
I hope you will keep sharing what you feel comfortable sharing on your GDP forecasts. I have learned a lot from your posts and thoughts on different things.
Off-topic FYI
https://www.latimes.com/politics/story/2020-10-10/trump-biden-television-advertising-battleground-states
Looks good. I expect another solid drop in unemployment as well. November is when the slow down becomes noticeable with NFP.
There may have been a seasonal glitch that pulled lots of women out of the seasonlly adjusted labor force number in September. If so, a month or two of offsetting distortion is likely. That would delay any large drop in the jobless rate, without much regard to underlying trends.
@ macroduck
As usual from you, a great point. Even some of the large banks have been making this analysis in their near term outlooks. Not often you see women in the labor force get that much discussion—that I’ve seen anyway. I’ve kind of made this point indirectly multiple times, stressing how Republicans want public schools (which Republicans normally spend exceeding amounts of time badmouthing as “useless”) to re-open because parents need babysitters for their kids before they can return to work. Which is how most Republicans (even parents) view public schools, as daycare or a low-cost babysitting option.
Those big banks are just cribbing off my work. Scoundrels.
: )