Tautologically, yes; maybe not so much if V (velocity) is constant.
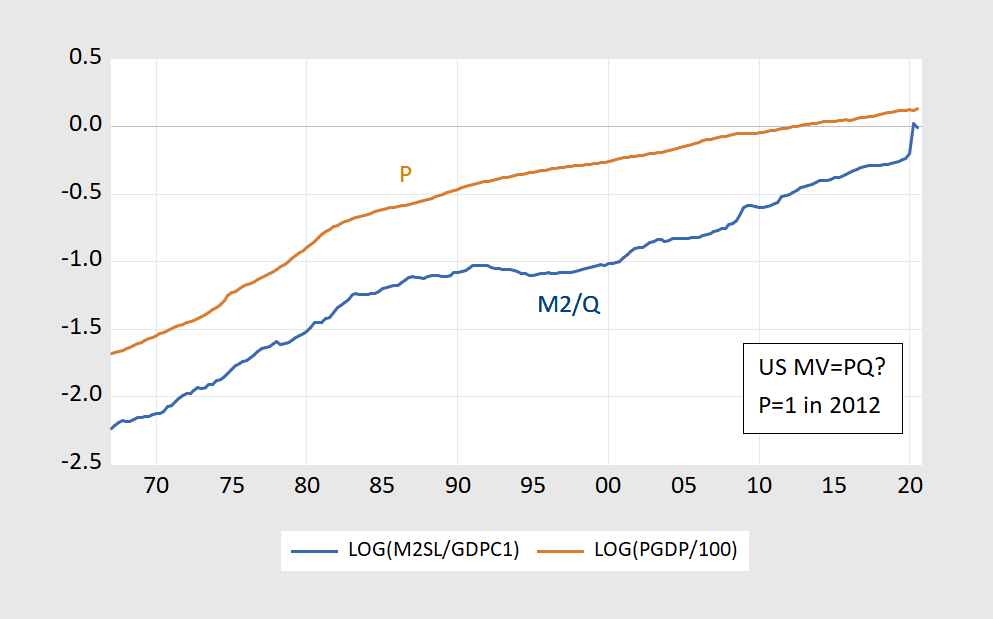
Figure 1: M2/GDP (blue), and log GDP deflator (brown), in logs. GDP in Ch.2012$, GDP deflator = 1 in 2012. Quarterly M2 is average of monthly. Source: Federal Reserve Board, BLS, and author’s calculations.
Update, 12/12 1pm Pacific:
If you were curious… using data 1959q1-2019q4, no cointegration null is not rejected when allowing for constants in cointegrating vector and/or VAR representation. In other words, only when using the most restrictive specifications (no constant in cointegrating equation and VAR, or constant w/no trend in cointegrating equation) does one reject the no-cointegration null.
I remember when I was in college and studying this, and something just always seemed to be “off” about it. Like you could inherently sense that something was false here— not quite as aggravating as the Laffer curve, or as screamingly obviously wrong as the Laffer curve…… but just like the faint sound of a Crow cawing in the distance, telling you it was bullsh*t.
Moses,
Actually the Laffer curve is right, not “sceamingly obviously weong.” It is the case that there will be zero tax receipt if the average tax rate is zero and also if the average tax rate is 100%, which means that in any given nation there is a tax rate less than 100% at which tax receipts will be maximized. If the average tax rate exceeds that indeed tax receipts will rise if the tax rate is cut.
Where Laffer has been regularly wrong has been in claiming that in the US as a whole as well as in individual states the tax rates have been that high so that cutting tax rates will raise tax receipts. That has been false and remains false, although it has been the case in some other nations. One of the few good things Putin did when he first became prez of Russia was to lower and simplify Russia’s very high and complicated tax rates. The result was indeed an increase in tax receipts. But that has not been the case in the US where Lagger’s claims about how high US tax rates have been have indeed been “screaminly obviously wrong.”
Maybe this is what you meant to say.
James Tobin once wrote an analysis claiming that if the marginal tax rate = 82% we would be at the top of the Laffer curve. Now Stephen Moore might do some of his “arithmetic” to claim tax rates are that high but please!
pgl,
There have been a lot of studies of this. Most suggest that the max revenue=generating rate is probably closer to 70%, although this can vary across countries and across time within a country. We also need to worry about marginal versus average rate.
Within the US it has been argued that when the first Reagan tax cut came in that moved the top marginal rate from 70 to 50%, there might have been an increase in tax receipts from the group paying the top marginal rate, while the revenues fell for those with lower rates, with the latter dominating and the deficit increasing substantially from about $40 billion to about $200 billion per year, going against the forecast of Laffer at the time, who indeed did forecast that the deficit would decline as a result of that tax cut.
FRED tracks GDP/M2 since 1959. Hovered around 1.8 through 1991 but has been quite volatile since:
https://fred.stlouisfed.org/series/M2V
BTW – what are the micro foundations behind this ratio which does not describe any behaviorial relationship?????
If not a behavioral relationship, then an accounting identity (which it is). If an accounting identity, then no micro-foundations needed.
But you knew this, yes?
I’m curious as to what motivated this? Is there some Trumpian candidate for the FED (Shelton, Moore, Kudlow, Ivanka) who has predicted HYPERINFLATION because M2 growth is currently high relative to real GDP? After all in their world a yuuuuge drop in real output has to be inflationary unless the FED cuts the money supply!
pgl: E.g., Institute of International Monetary Research.
Where to start with this Tim Congdon fellow. He may know historical statistics but my Lord his presentation had so many contradictions in logic, I have to wonder if the COVID-19 isolation has rotted his brain.
Let me start at the end of his presentation where he fretted about the rise in the government debt to GDP ratio and the implications for the NOMINAL interest expense to GDP ratio. He obviously knows that the difference between real and nominal interest rates and he noted real rates are negative. I guess his rotted brain has forgot that it is real interest expense that matters.
I almost fell out of my chair when he said people who were receiving 20% nominal interest rates were being robbed because inflation might be say 16%. OK an unanticipated rise in inflation could leave a long-term bond holder with a capital loss but he way overdoes this argument.
And yea- he does say that a temporary HUMP (got to love that – was he humping grandma) in the UK money supply growth had to lead to a surge (or what that a HUMP) in inflation. Which is odd since he cites the fact that nominal interest rates have turned negative, which likely means the market is expecting low inflation. I guess his rotted brain with all his useful statistics did not put that together.
I could go on but let’s have everyone else watch this 20 minute side show for a good laugh.
Congdon has an odd stint in UK politics with some of it involving for government aid to companies that he owns shares in. If you are wondering who this nutcase is – Cato Unbound loves his “research”:
https://www.cato-unbound.org/contributors/tim-congdon
BTW – this solved one mystery for me as when I was listening to this lunacy I kept thinking of gibberish that used to pop up in the comment box over at Mark Thoma’s place. Me thinks Congdon taught JohnH macroeconomics.
Forgive me as I left off perhaps the most absurd proposition made by this free market freak. He asks how real interest rates could be negative. They are negative not only in the UK but also the Euro area, the US, and even Japan. There have been a lot of really good macroeconomic explanations for this but I guess Congdon has been locked up in his little world too long to read any of them.
No the reason why real rates are low in the UK has to do with “regulation”. Pension funds are forced to put some of their funds into government bonds. WTF? A lot of retirement advisers here advocated such a portfolio mix. I guess Congdon’s next career can be suing these advisers for malpractice.
I’m sorry this is 20 minutes of utter gibberish!
The argument that (unexpected) inflation robs lenders reveals an enormous bias in its one-sidedness. Unexpected disinflation robs borrowers, but few monetarist flacks bother to point that out. Nobody forced savers to save. Lenders are not guaranteed a profit, nor should they be. That’s just more socialism for the rich.
https://www.cato-unbound.org/2011/12/05/tim-congdon/dangerous-waffle-about-liquidity-trap
This Tim Congdon nutcase took on Paul Krugman on the roles of monetary policy and fiscal policy during the Great Recession. It is a long discussion with much fanfare but it strikes me as the usual insane garbage that Cato celebrates.
I’m wondering if Krugman ever lowered himself to respond to such silliness.
I had one professor who would always bow his head and make the sign of the cross whenever he wrote MV = PQ on the chalkboard…and yes, that was back in the day when they had chalkboards with actual chalk.
At one time (not all that long ago) there was something of a serious debate about using MZM rather than M2. Today that argument looks almost comical.
My principles of macroeconomics professor would start chuckling when he wrote this ‘equation’.
FRED does have GDP/MZM – not a constant either!
https://fred.stlouisfed.org/series/MZMV
Do they even publish MZM any more? I am just wanting for our Usual Suspects to start bashing our host for not using GDP/M1. Of course if they checked this series out, it would only make his case against simpleton monetarism even stronger:
https://fred.stlouisfed.org/series/M1V
pgl: Yes, FRED has it…https://fred.stlouisfed.org/series/MZM
Just a reminder – even Uncle Milton recanted: https://www.theguardian.com/business/2003/jun/22/comment.economicpolicy
Friedman realized destabilization of velocity means targeting steady growth in nominal GDP through steady growth in money won’t work.
December 11, 2020
Coronavirus
US
Cases ( 16,295,458)
Deaths ( 302,750)
India
Cases ( 9,826,031)
Deaths ( 142,618)
France
Cases ( 2,351,372)
Deaths ( 57,567)
UK
Cases ( 1,809,455)
Deaths ( 63,506)
Germany
Cases ( 1,298,776)
Deaths ( 21,820)
Mexico
Cases ( 1,217,126)
Deaths ( 112,326)
Canada
Cases ( 448,841)
Deaths ( 13,251)
China
Cases ( 86,688)
Deaths ( 4,634)
December 11, 2020
Coronavirus (Deaths per million)
UK ( 933)
US ( 912)
France ( 881)
Mexico ( 867)
Canada ( 350)
Germany ( 260)
India ( 103)
China ( 3)
Notice the ratios of deaths to coronavirus cases are 9.2%, 3.5% and 2.4% for Mexico, the United Kingdom and France respectively.
https://news.cgtn.com/news/2020-12-12/Chinese-mainland-reports-13-new-COVID-19-cases-all-from-overseas-W9wt6fAxG0/index.html
December 12, 2020
Chinese mainland reports 15 new COVID-19 cases
The Chinese mainland recorded 13 new COVID-19 cases on Friday, all from overseas, the National Health Commission announced on Saturday.
Seventeen new asymptomatic COVID-19 cases were recorded, while 196 asymptomatic patients remain under medical observation. No COVID-19 deaths were reported on Friday, while 12 patients were discharged from hospitals.
The total number of confirmed COVID-19 cases reached 86,701, with 4,634 deaths as of Friday.
Chinese mainland new imported cases
https://news.cgtn.com/news/2020-12-12/Chinese-mainland-reports-13-new-COVID-19-cases-all-from-overseas-W9wt6fAxG0/img/ca7ab92018e745568132ed8e0e3cd873/ca7ab92018e745568132ed8e0e3cd873.jpeg
Chinese mainland new asymptomatic cases
https://news.cgtn.com/news/2020-12-12/Chinese-mainland-reports-13-new-COVID-19-cases-all-from-overseas-W9wt6fAxG0/img/7e99f89aab064dbfa54e6aa870266944/7e99f89aab064dbfa54e6aa870266944.jpeg
[ There has been no coronavirus death on the Chinese mainland since the beginning of May. Since the beginning of June there have been 7 limited community clusters of infections, each of which was an immediate focus of mass testing, contact tracing and quarantine, with each outbreak having been contained. Symptomatic and asymptomatic cases are all contact traced and quarantined.
Imported coronavirus cases are caught at entry points with required testing and immediate quarantine. Cold-chain imported food products are all checked and tracked through distribution. The flow of imported cases to China is low, but has been persistent.
There are now 293 active coronavirus cases in all on the Chinese mainland, 5 of which cases are classed as serious or critical. ]
The core problem is that MV ≡ PQ is an identity, not an equality, and it should get it’s proper symbol. When you have an identity there are no degrees of freedom for one side to “explain” the other. This is true for all the macro identities, incidentally.
Why don’t economists distinguish between equalities and identities in their notation?
Peter Dorman: Well, with identity sign, it would be a tautology. Saying V is constant immediately makes it a theory.
A theory of ??? OK we do write
Money demand = k(Y) – h(i) and if h were zero, then I guess we get a vertical LM curve. But is this anyone’s view of the money demand equation? And course GDP/M2 since 1991 has been highly volatile. I presume Stephen Moore would attribute this volatility to us not being on some metals commodity standard.
Yes, but one would then need a theory for *why* it should be constant, no? I recall some handwaving about that, but I’ve never seen a formal theory. Empirically, of course, it is obviously non-constant.
I should add that, if you leave it at an equality you have to define V in some way other than tautologically.
Peter Dorman: Well, following Goldfeld, I’d say V could vary in a systematic fashion with say opportunity cost of holding money and transactions demand for money motive. Of course, it could be much more complicated, less deterministic, a la Akerlof’s “Irving Fisher on His Head”. There is at least one theory – it’s just not a particularly “good” theory in terms of empirical fit.
Well if the LM curve were vertical. As if if a rise in the nominal interest rate would not lower the demand for money. But no one seriously believes this.
It is an identity and a very odd one at that. Whose behavior does it explain? No ones. What are its micro foundations? There are none. It is really nothing more than a strange and quite useless ratio – unless there was some compelling reason for GDP/M2 to be always near 1.8.
It has one use. By drawing our attention to money velocity, it helps us notice when monetary policy is weak.
Forgive me, but it’s been a long time since I studied this.
So what’s the exact difference between CPI and the GDP deflator? Do either of them take into account asset values? It seems to me we’re once again in the balance sheet v. income statement debate (stocks v flows) , and that both CPI and the GDP deflator measure flows, not stocks. If that’s true, could not increased M2/Q not show up in housing or stock prices, saying a housing or share price bubble? Seems to be what we have now, no?
“So what’s the exact difference between CPI and the GDP deflator? Do either of them take into account asset values?”
And I bashed Bruce no relationship to Robert Hall for your 2nd question. The answer is no and for good reason.
GDP captures the prices of goods produced here. CPI captures the prices of goods consumed here. In a world of free trade – most people would get the difference. But I guess at the Princeton Policy Review or whatever that blog of yours does, exports and imports are not recognized. Geesh!
GDP deflator also takes into account capital goods produced by investment as well as government provided goods, in short, everything that is in the GDP, where as the CPI, the consumer price index only counts privately produced consumer goods, a portion of GDP.
Good point. Of course I was thinking of the libertarian nirvana where the government produces nothing and tax cuts for the rich are so steep that luxury goods consumption crowds out all investment!! Maybe we should buy Steve a basic macro text where he can see this identity:
National income = consumption + investment + government purchases + exports – imports!
So, flows not stocks, if I understand correctly. Ergo, M2/Q has gone into assets not consumption or production, no? And if that’s true, then this might not end well.
Steven,
M is a stock while Q is a flow.
Most money is just sitting in banks, which I guess you can call an asset, although I suspect that is not what you are thinking of.
I am thinking of housing and stock prices, Barkley. If you look at capital markets, they look like a late-stage expansion before a crash.
For housing, consider this graph:
https://1.bp.blogspot.com/-BiE-Bcg41is/X71CZ6FAgTI/AAAAAAAA3KA/qIan_8dv1agLz51Xj39hT_YrSB0n9o6UgCLcBGAsYHQ/s1025/NominalSept2020.PNG
Also, SPACs are typically a late stage phenomenon, and they are very popular now. They are a typical manifestation of investors chasing yield into gray market vehicles. (I love SPACs by the way. I led a couple of them.)
Let me add that money does not sit in banks. It influences interest rates, leading asset values — notably housing and shares — higher.
So, let me try another approach, Barkley.
MV = PQ. That’s fine as it goes, but ‘P’ of what? If it is the CPI, then its consumed goods. If it’s the deflator, its produced goods. OK, that’s all income statement stuff.
What about the balance sheet, notably housing and stocks? On the graph linked immediately below, you can see the same peak as Fig. 1 above.
https://1.bp.blogspot.com/-BiE-Bcg41is/X71CZ6FAgTI/AAAAAAAA3KA/qIan_8dv1agLz51Xj39hT_YrSB0n9o6UgCLcBGAsYHQ/s1025/NominalSept2020.PNG
Meanwhile, SPAC (blank check company) issuances are going crazy, and these are typically signs of a late state financial economy which precedes a financial markets crash.
https://cms.zerohedge.com/s3/files/inline-images/gs%20spac%201.jpg?itok=jALLEruV
In terms of housing and financial markets, the situation is beginning to resemble that of mid-2007.
So Menzie’s right: the surge in M2 is not showing up in flows, either CPI or GDP. But it is very much showing up in asset markets, most notably housing and equity values. This manifestation did not end well last time.
Steven Kopits: For logical consistency, it should be the GDP deflator (chain weighted), since GDP is chain weighted. If I do use that instead of the consumption deflator (chain weighted), I get the the same answer as with the consumption deflator.
I’d be interested in your broader take, Menzie. I think there is evidence the increased M is indeed showing up in asset values, not inflation, just as was the case in 2005-2007. Usually, these sorts of things are succeeded by a financial crash, no?
I am not trying to grind an ax here, but as a guy who sat through the great meltdown in a NY investment bank, well, if I take away the covid, the underlying situation looks a lot like 2007, with the exception that there was a large overhang of excess housing then, which is not there now.
Thoughts?
Steven Kopits: In a simple Cowles Commission type macro model, or a NK DSGE, driving down interest rates will typically result in an asset boom. The 2009-17 rise in M2/GDP was much more pronounced than the 2001-03, and yet there was no “crash”. Now, if you are saying that a crash follows an M2/GDP boom accompanied by a deregulatory frenzy, I’m with you. That is why it is critical to retain the higher capital requirements and capital buffers emplaced by Dodd-Frank. The lesson I took is that there was too little capital held (particularly for investment banks) given the riskiness of the assets.
You can see a jump in M2/Q on your Fig 1 above around 2007-2008 if I am eyeballing your graph above. The rebalancing of financial markets after that was associated with the Great Recession (or China Depression, as I prefer to call it). We see a much bigger jump now, just in the last twelve months, easily visible on the graph above, with a similar jump visible in housing values. You’re suggesting…what…that current housing values are enshrined and we move on; or that housing prices will correct on the other side, but it will be okay — a soft landing; or that there will be a short quasi-recession as prices reset to a less stimulated level? Or perhaps that this will end as it usually has in the past, with a crushing recession?
Given that we are still short on housing, a deep recession would seem unlikely. On the other hand, a 1987-type event looks plausible to me.
I guess you do not realize that the value of assets is a totally different concept than GDP. Yea lower real rates will increase valuations. Ever heard of the Discounted Cash Flow concept? It seems not.
Let me help you get your head around this.
If we rapidly increase the money supply, that could ordinarily have two effects:
1. an increase in consumer prices as increased purchasing power translates into higher demand for supply fixed in the short run
2. an increase in asset prices, like housing values and stock prices
An interesting, and indeed, relevant question in macroeconomics is to what extent easy money shows up in consumer prices rather than asset values. If it shows up in consumer prices, then you have inflation. If it shows up in asset prices, then you get things like housing and stock market bubbles.
Under such circumstances, the headline would read not ‘Inflation Looming?’, but rather ‘Crash Coming?’.
Test this yourself. Create a “velocity” measure for, say, household assets. If you find that V(output) behaves differently than V(assets) – you will – you may feel gratified.
Calculating V for individual asset classes is also worth a try, showing relative sensitivity to changes in M. You could get an indication whether, for instance, stock buy-backs raise V(equities) relative to V(real estate).
On that note, 2021 may turn out to be the first year in a decade in which shares outstanding increase in the U.S. market. Hold on to your hats.
“Given that we are still short on housing, a deep recession would seem unlikely.”
I guess Stevie pooh thinks residential investment is the major portion of GDP so as long as it is strong declines in things like net exports, business investment, or government purchases will not matter. It boggles the mind what goes on in his uninformed head.
Bill McBride over at CR thinks the business cycle and the housing cycle are closely related, and I am inclined to agree. See this graph, for example:
https://1.bp.blogspot.com/-byobuhrAnG0/X7Ui7LR8qRI/AAAAAAAA3EQ/7HxZBLCHhlQqkpYoHVoTYCTSZo6Dy9yFQCLcBGAsYHQ/s1021/StartsNov2020.PNG
We have debated the difference between a recession and a depression. A recession will depress housing starts, but typically not house prices in any material way. In a depression, housing values fall and stay below pre-crash levels for a long time, say, 7-10 years. This then forces households to de-lever to, in essence, make up for the loss in equity in their homes, with a resulting dampening effect on consumer borrowing, consumption and investment for a long time. Such is the notion.
As for the impact of M on housing: In terms of flows, increasing M should decrease interest rates to the extent not fully offset by inflation. This will lead to increased housing activity and some increase likely in construction costs. These are flows related to inflation.
The greater impact, however, is likely to be on house prices. This will show up in inflation to the extent that mortgage payments or rents rise. However, if increases in property values are the result of decreased interest rates — as appears the case now and was the case in 2005-2007 — then the consumer’s budget constraint is largely unchanged, such that new mortgage payments are largely the same, with increased house values being offset by lower mortgage interest rates. In such an event, increasing M will be transmitted into housing prices without much manifestation into inflation.
This is amenable to a more formal analysis within Menzie’s skill set, and perhaps he would consider making such a presentation for us.
Once again, I suspect demographics will have something to do with the answer. If you have a rapidly growing population looking for incremental housing, then lower interest rates may well translate quickly into higher levels of construction. On the other hand, if you have a slow-growing population where the existing housing stock materially covers demand, then it seems plausible lower interest rates will tend to manifest themselves as higher house values, with a propensity for the incumbent homeowner to use this increased value as a source of equity for other purposes, as was the case in 2005-2007.
I would add that the implication is that the Fed — now Trump’s Fed — once again bungled the situation. Support of the pandemic should have come essentially from the fiscal side to sustain consumption; not lower interest rates to support investment. By throwing indiscriminate easy money into the mix, the Fed has created material bubbles in housing and stocks, and I don’t know that there are good examples of this having ended well anytime in the past, but perhaps Menzie will provide the counter-examples.
Paul Krugman asks, “If we’re so rich, how come we die so much?”
Building on work with Anne Case:
https://www.nber.org/system/files/working_papers/w28177/w28177.pdf
December, 2020
GDP, Wellbeing, and Health: Thoughts on the 2017 Round of the International Comparison Program
By Angus Deaton and Paul Schreyer
Abstract
In March 2020, the International Comparison Project published its latest results, for the calendar year 2017. This round presents common-unit or purchasing-power-parity data for 137 countries on Gross Domestic Product and its components. We review a number of important issues, what is new, what is not new, and what the new data can and cannot do. Of great importance is the lack of news, that the results are broadly in line with earlier results from 2011. We consider the relationship between national accounts measures and health, particularly in light of the COVID-19 epidemic which may reduce global inequality, even as it increases inequality within countries. We emphasize things that GDP cannot do, some familiar—like its silence on distribution—and some less familiar—including its increasing detachment from national material wellbeing in a globalized world where international transfers of capital and property rights can have enormous effects on GDP, such as the 26 percent increase in Ireland’s GDP in 2015.
https://fred.stlouisfed.org/graph/?g=yCv4
January 30, 2018
Life Expectancy at Birth for United States and European Union, 1990-2018
https://fred.stlouisfed.org/graph/?g=yzGB
January 30, 2018
Infant Mortality Rate for United States and European Union, 1990-2019
Latin American countries have recorded 4 of the 13 highest and 6 of the 24 highest number of coronavirus cases among all countries. Brazil, Argentina, Colombia, Mexico, Peru and Chile. Mexico, with more than 1 million cases recorded, has the 4th highest number of cases among Latin American countries and the 13th highest number of cases among all countries. Mexico is now the 4th among all countries to have recorded more than 100,000 coronavirus deaths.
December 11, 2020
Coronavirus (Deaths per million)
US ( 912) *
Brazil ( 846)
Argentina ( 895)
Colombia ( 756)
Mexico ( 867)
Peru ( 1,102)
Chile ( 822)
Ecuador ( 780)
Bolivia ( 767)
* Descending number of cases
Now that the Supreme Court has refused to let Trump steal this election, you would think he would be done. You’d be wrong as he is now taking this case to the High Court of Mars:
https://www.newyorker.com/humor/borowitz-report/trump-orders-space-force-to-discover-other-planets-with-courts
December 11, 2020
Coronavirus (Deaths per million)
Belgium ( 1,524)
Italy ( 1,049)
Spain ( 1,018)
UK ( 933)
US ( 912)
France ( 881)
Mexico ( 867)
Sweden ( 742)
Switzerland ( 683)
Luxembourg ( 622)
Netherlands ( 581)
Portugal ( 528)
Austria ( 475)
Ireland ( 427)
Canada ( 350)
Greece ( 334)
Germany ( 260)
Denmark ( 160)
India ( 103)
Finland ( 82)
Norway ( 71)
Australia ( 35)
Japan ( 20)
Korea ( 11)
China ( 3)
What I have used:
https://fred.stlouisfed.org/graph/?g=qSdj
January 15, 2018
Monetary Base, M2 Money Stock and Consumer Price Index, 2007-2020
(Indexed to 2007)
From a long time ago The problem with MV is what is money? Freidman preferred the money base others M3. Velocity is very volatile as well.
nd ironies of all ironies controlling the money supply only works in highly regulated systems. It is hopeless when you de-regulate as we found out.
When he first formulated his strong version of the quantity theory of money in the 1950 s and on through the 1970s into the 80s, Friedman advocated focusing on M1, arguing that V for it was reasonably stable, and also that in the long run it is neutral, so there would be the close relation between and the price level, P (however measured, usually broader GDP deflator). In the 80s the V for M1 clearly destabilized as it became easier to move money between demand and time deposits, so he shifted his advocacy and focus to M2, with then later people talking about other measures. Each has its own V, with that defined by the identity. Recently none of these Vs has been stable, which has been why this old fashioned monetarism is not take all that seriously by central bankers or most economists.
Again, Friedman himself abandoned any version of his monetarism before he died, recognizing the changed empirical situation.. He ,to advocating inflation targeting using interest rate control policies.
Is there any reason why the quantity theory is worth teaching in undergrad macro nowadays? Or even the concept of velocity?
I never understood how a theory based on such flimsy empirical foundations would have endured under the Lucas Critique / Goodhart’s Law.
Jason: Well, truth be told, I haven’t taught it for decades, although I might have mentioned it. It is an implication of the Classical view, given trend velocity.
Many years ago some New Classical Real Business Cycle freak challenged me on why I taught Keynesian economics because he was wondering if they still teach blood leaching in medical school. Not wanting to get into with this fellow, I suggested Keynes should be at least part of teaching the history of economic thought. I’d sure wish I could ask him today how he explained the Great Recession to his students.
But MV = PQ is part of the history of economic thought even if there never were any micro foundations behind it.
Very well put!
December 12, 2020
Coronavirus
US
Cases ( 16,549,366)
Deaths ( 305,082)
India
Cases ( 9,857,380)
Deaths ( 143,055)
France
Cases ( 2,365,319)
Deaths ( 57,761)
UK
Cases ( 1,830,956)
Deaths ( 64,026)
Germany
Cases ( 1,320,592)
Deaths ( 22,171)
Mexico
Cases ( 1,229,379)
Deaths ( 113,019)
Canada
Cases ( 454,852)
Deaths ( 13,350)
China
Cases ( 86,701)
Deaths ( 4,634)
December 12, 2020
Coronavirus (Deaths per million)
UK ( 941)
US ( 919)
France ( 884)
Mexico ( 872)
Canada ( 352)
Germany ( 264)
India ( 103)
China ( 3)
Notice the ratios of deaths to coronavirus cases are 9.2%, 3.5% and 2.4% for Mexico, the United Kingdom and France respectively.
https://news.cgtn.com/news/2020-12-13/Chinese-mainland-reports-24-new-COVID-19-cases-WbepxxzjLW/index.html
December 13, 2020
Chinese mainland reports 24 new COVID-19 cases
The Chinese mainland recorded 24 new COVID-19 cases on Saturday, including 5 locally transmitted cases, the National Health Commission announced on Sunday.
The local transmissions included 4 cases reported in Heilongjiang Province and 1 in Sichuan Province.
Fourteen new asymptomatic COVID-19 cases were recorded, while 195 asymptomatic patients remain under medical observation. No COVID-19 deaths were reported on Saturday, while 11 patients were discharged from hospitals.
The total number of confirmed COVID-19 cases reached 86,725, with 4,634 deaths as of Saturday.
Chinese mainland new imported cases
https://news.cgtn.com/news/2020-12-13/Chinese-mainland-reports-24-new-COVID-19-cases-WbepxxzjLW/img/0c759c8a71734aa48964b81047983e5c/0c759c8a71734aa48964b81047983e5c.jpeg
Chinese mainland new asymptomatic cases
https://news.cgtn.com/news/2020-12-13/Chinese-mainland-reports-24-new-COVID-19-cases-WbepxxzjLW/img/5d544c22c6ad45fd90ae96f7c295b255/5d544c22c6ad45fd90ae96f7c295b255.jpeg
[ There has been no coronavirus death on the Chinese mainland since the beginning of May. Since the beginning of June there have been 7 limited community clusters of infections, each of which was an immediate focus of mass testing, contact tracing and quarantine, with each outbreak having been contained. Symptomatic and asymptomatic cases are all contact traced and quarantined.
Imported coronavirus cases are caught at entry points with required testing and immediate quarantine. Cold-chain imported food products are all checked and tracked through distribution. The flow of imported cases to China is low, but has been persistent.
There are now 306 active coronavirus cases in all on the Chinese mainland, 6 of which cases are classed as serious or critical. ]
One of the unspoken factors about tax revenues has nothing to do with the health of the economy, but rather the efficiency of the tax collection system
I believe that various studies have indicated that, for the United States, every additional dollar spent on the IRS results in $3-$10 back in increased tax revenue.
A brief citation from the CBO:
On the basis of its analysis of the effects that different funding levels have had on IRS enforcement, CBO estimates that increasing the IRS’s funding for examinations and collections by $20 billion over 10 years would boost revenues by $61 billion, resulting in a $41 billion decrease in the cumulative deficit; increasing such funding by $40 billion over 10 years would boost revenues by $103 billion, resulting in a $63 billion decrease in the deficit.
CBO’s estimates for those two options are uncertain and only capture the direct effect of enforcement activities. Any indirect benefits of increasing enforcement, such as deterring taxpayers from violating tax laws, are excluded from the estimates.
However, as we all know, societally, while we accept taxation as a neccesity, we really don’t want it to very efficient.
“We” being a pretty elite group in this case. Probably no more than 1%.
there is a reason why republicans want to keep the irs as skeleton as possible.
December 12, 2020
Coronavirus (Deaths per million)
Belgium ( 1,532)
Italy ( 1,060)
Spain ( 1,018)
UK ( 941)
US ( 919)
France ( 884)
Mexico ( 872)
Sweden ( 742) *
Switzerland ( 688)
Luxembourg ( 628)
Netherlands ( 584)
Portugal ( 536)
Austria ( 489)
Ireland ( 428)
Canada ( 352)
Greece ( 340)
Germany ( 264)
Denmark ( 161)
India ( 103)
Finland ( 82)
Norway ( 71)
Australia ( 35)
Japan ( 20)
Korea ( 11)
China ( 3)
* Sweden, which is experiencing another wave of infections, only reports Tuesday to Friday
http://krugman.blogs.nytimes.com/2009/12/14/samuelson-friedman-and-monetary-policy/
December 14, 2009
Samuelson, Friedman, and Monetary Policy
By Paul Krugman
Paul Samuelson was a great economic theorist. But he was also an acute observer of the real world, to such an extent that many of the things he said in his 1948 textbook ring truer than what many, perhaps most economists believed on the eve of the current crisis.
This is especially true with regard to monetary policy. By the 1980s, I think it’s fair to say that the vast majority of economists had been convinced by Milton Friedman’s assertion that aggressive monetary policy could have prevented the Great Depression. Some of us started to have doubts after contemplating Japan’s troubles in the 1990s; but as late as 2002 Ben Bernanke declared, * on behalf of the Federal Reserve, “You’re right. We did it. But thanks to you, we won’t do it again.”
But here’s Paul Samuelson, from his 1948 textbook:
“Today few economists regard Federal Reserve monetary policy as a panacea for controlling the business cycle. Purely monetary factors are considered to be as much symptoms as causes, albeit symptoms with aggravating effects that should not be completely neglected.
“By increasing the volume of their government securities and loans and by lowering Member Bank legal reserve requirements, the Reserve Banks can encourage an increase in the supply of money and bank deposits. They can encourage but, without taking drastic action, they cannot compel. For in the middle of a deep depression just when we want Reserve policy to be most effective, the Member Banks are likely to be timid about buying new investments or making loans. If the Reserve authorities buy government bonds in the open market and thereby swell bank reserves, the banks will not put these funds to work but will simply hold reserves. Result: no 5 for 1, ‘no nothing,’ simply a substitution on the bank’s balance sheet of idle cash for old government bonds. If banks and the public are quite indifferent between gilt-edged bonds — whose yields are already very low — and idle cash, then the Reserve authorities may not even succeed in bidding up the price of old government bonds; or what is the same thing, in bidding down the interest rate.
“Even if the authorities should succeed in forcing down short-term interest rates, they may find it impossible to convince investors that long-term rates will stay low. If by superhuman efforts, they do get interest rates down on high-grade gilt-edged government and private securities, the interest rates charged on more risky new investments financed by mortgage or commercial loans or stock-market flotations may remain sticky. In other words, an expansionary monetary policy may not lower effective interest rates very much but may simply spend itself in making everybody more liquid….
“In terms of the quantity theory of money, we may say that the velocity of circulation of money does not remain constant. ‘You can lead a horse to water, but you can’t make him drink.’ You can force money on the system in exchange for government bonds, its close money substitute; but you can’t make the money circulate against new goods and new jobs. You can get some interest rates down, but not all to the same degree. You can tempt businessmen with cheap rates of borrowing, but you can’t make them borrow and spend on new investment goods.”
A few slight archaisms aside, he could have been describing our current dilemma.
* http://www.federalreserve.gov/BOARDDOCS/SPEECHES/2002/20021108/default.htm
“His seminal contributions to economics are legion, including his development of the permanent-income theory of consumer spending, his paradigm-shifting research in monetary economics, and his stimulating and original essays on economic history and methodology.”
Bernanke spends his speech on the paradigm-shifting research in monetary economics by Milton Friedman, which in many ways did shape the thoughts of economists such as Bernanke and Krugman. Notice something – Bernanke never mentions MV = PQ. People who think this was all there was to Milton Friedman have never appreciated what Friedman actually wrote.
Colin Lloyd must be a colleague of Tim Congdon:
https://www.aier.org/article/global-money-supply-growth-and-the-great-inflation-getaway/
‘Global Money Supply Growth and the Great Inflation Getaway’
Our trips down memory lane reminded me of when I had to explain how to use the International Financial Statistics to my economic professors. The tapes had a series believe it or not called the Global Money Supply. When I clicked on it, one of my professors starting laughing asking if I had turned into a Global Monetarist. I guess this Colin Lloyd fellow is a Global Monetarist!
Latin American countries have recorded 4 of the 13 highest and 6 of the 24 highest number of coronavirus cases among all countries. Brazil, Argentina, Colombia, Mexico, Peru and Chile. Mexico, with more than 1 million cases recorded, has the 4th highest number of cases among Latin American countries and the 13th highest number of cases among all countries. Mexico is now the 4th among all countries to have recorded more than 100,000 coronavirus deaths.
December 12, 2020
Coronavirus (Deaths per million)
US ( 919) *
Brazil ( 849)
Argentina ( 896)
Colombia ( 760)
Mexico ( 872)
Peru ( 1,102)
Chile ( 826)
Ecuador ( 781)
Bolivia ( 767)
* Descending number of cases