The Treasury’s semi-annual report designated Switzerland and Vietnam as currency manipulators. Without taking a definitive stand on currency manipulation, I do want to highlight where Vietnam (and Switzerland) stand if evaluated by the Big Mac Parity/Penn Effect:
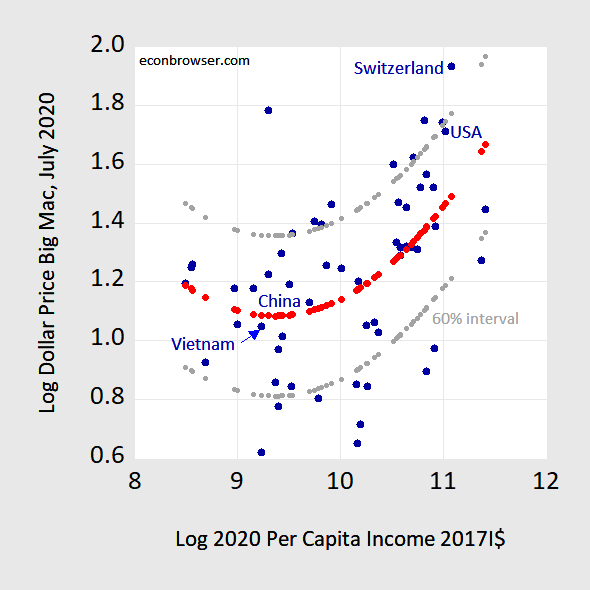
Figure 1: Log Big Mac dollar price in July 2020 plotted against log 2020 per capita income in 2017 I$. Penn Effect line estimated using regression (red) and 60% prediction interval (gray). Source: Economist, IMF World Economic Outlook October 2020 database, author’s calculations.
Clearly, if one used simple purchasing power parity (PPP), one would find massive undervaluation for the Vietnamese currency, massive overvaluation for the Swiss franc. However, as is well known, PPP — the proposition that the price of an identical bundle of goods should have the same price when expressed in a common currency — does not generally hold. That’s obvious to the tourist traveling to a variety of countries at very different levels of economic development.
Hence, I rely on the “Penn effect” which implies that a proper assessment of currency misalignment should consider the country’s per capita level of income, as highlighted in my survey for the Oxford Research Encyclopedia of Economics Finance. (A recent blogpost, using relative prices/relative incomes, and quantile regression, is here.) The nonlinear specification is due to Hassan (2016), and shown by the red dots.
The prediction interval (60%, gray dots) indicates that there is some imprecision regarding whether the US dollar is truly overvalued, whether the Vietnamese dong is undervalued, relative to a multilateral assessment of the best fit estimate of the relationship. The results suggest that if one is using Big MacParity accounting for income levels, then Trump should really be pursuing… Russia, Ukraine and South Africa.
Jason Furman and Joe Gagnon discuss the wrong-headedness of designating Vietnam a currency manipulator (separate from the issue of currency misalignment or undervaluation). See also Mark Sobel on who might better fit into the manipulator category.
The raw Big Mac data is here. (And for a deeper analysis of MacParity, see David Parsley and Shang-Jin Wei’s incredibly thorough piece on the subject in 2007 Economics Journal; ungated version: A Prism into the PPP Puzzles.)
For a recent assessment using price level data, see Cheung, Chinn and Xing (2017), referring to exchange rates in 2014.
Oh, I did not read the report when you first put it up.
So third rate protectionist nonsense has filtered down to the level of the Treasury where they make these designations. Both of these look pretty silly.
On Vietnam, the point nobody has mentioned so far, and it certainly is not in the report, is that probably the biggest likely thing that would have happened if the US had stayed in the TPP is that we would have finally ended remnant trade and other economic restrictions on Vietnam, many of which dated back to the Vietnam War and should have been removed long ago. It was and remains time for the US and Vietnam to have regular trade and economic relations.
Others have noted details of their policy, and that they do not have an obviously large current account surpluls, even if they have a large bilateral surplus with the US that has recently risen, even with the remaining restrictions in place. Regarding pricing, Menzie is right that they are about the same as PRC relative to the US.
Of course it is totally hilarious that Switzerland is being fingered. I am not sure what they are exporting to us so successfully, but obviously their price level is well above ours and has been more or less forever, with this driven by what even the report recognizes as the role of the Swiss franc has a safe haven currency even more so than the USD. Indeed, it is obvious that their interventions into the the forex market was due to pandemic induced surges of money into Switzerland that they were trying to block. Lecturing the Swiss on allowing some sort of normal “adjustment” is just hilarious, making whoever in Treasury came up with this look like utter fools.
Our trade statistics with the Swiss may include a lot of the type of transfer pricing games Brad Setser has detailed at this Follow the Money blog. Vietnam has a lot of contract manufacturing operations as well as the type of apparel production that China used to do. My understanding is that their surge in aluminum exports represent Chinese produced aluminum which has the final step of production being done by Vietnamese affiliates. So the gross value of exports exceeds the value added created in Vietnam.
on a separate note
https://www.cnbc.com/2020/12/18/suspected-russian-hack-on-us-is-much-worse-than-first-feared.html
exactly what has the usa been doing the past 4 years to prevent a national cyber attack? the russians compromised trump, and placed a foot inside of the entire us government and it infrastructure. this dereliction of duty is treasonous.
I agree with the spirit of Kevin Drum’s latest:
https://www.motherjones.com/kevin-drum/2020/12/theres-no-need-to-be-chicken-little-about-the-debt/
Congressional negotiators are working feverishly to complete a coronavirus relief bill before Christmas, but they’re having a difficult time because Republicans are insisting that the total bill come in under a trillion dollars. Why? Because, they say, they’re concerned about the federal debt. They shouldn’t be…As long as investors are eager to buy our debt—and they very much are—we’ll do fine. What’s more, investors will continue to be eager to buy our debt as long as our economy is fundamentally sound. They care much more about this than they do about whether interest outlays increase by a tenth of a percent or so, and strong stimulus spending is what keeps the economy humming until we emerge from the pandemic.
He provides two graphs for perspective. The 2nd graph shows something from OMB that suggests the ratio of interest expenses/GDP is 1.8%. But wait – OMB is using nominal interest rates. Long-term nominal interest rates are near 1.5% right now but expected inflation is close to 2%. So the real interest rate is negative 0.5%.
Kevin is a smart journalist who gets the difference between nominal v. real interest rates. So I would have expected him to do better than his OMB source. And yes – doing this right makes his case even stronger.
File this one under “keep it in perspective:”
US Federal net interest payments for debt (avg p.a.).
As a percent of GDP _ _ Dollars billion
1950s _ _ _ _ 1.2 _ _ _ _ _ _ 5.1
1960s _ _ _ _ 1.2 _ _ _ _ _ _ 8.9
1970s _ _ _ _ 1.4 _ _ _ _ _ _24.1
1980s _ _ _ _ 2.6 _ _ _ _ _ 113.2
1990s _ _ _ _ 2.9 _ _ _ _ _ 216.8
2000s _ _ _ _ 1.6 _ _ _ _ _ 200.1
2010s _ _ _ _ 1.3 _ _ _ _ _ 237.7
Nominal interest exceeds real interest if expected inflation > 0.
my better half got the vaccine the other night. very little side effects besides a sore arm, which is now gone. big thanks to pfizer. still have some arms yet to jab in the household, but making progress.