The output gap is a key concept in macro. Students in my courses have asked about the characteristics of some of the proxies. Here are some representative examples.
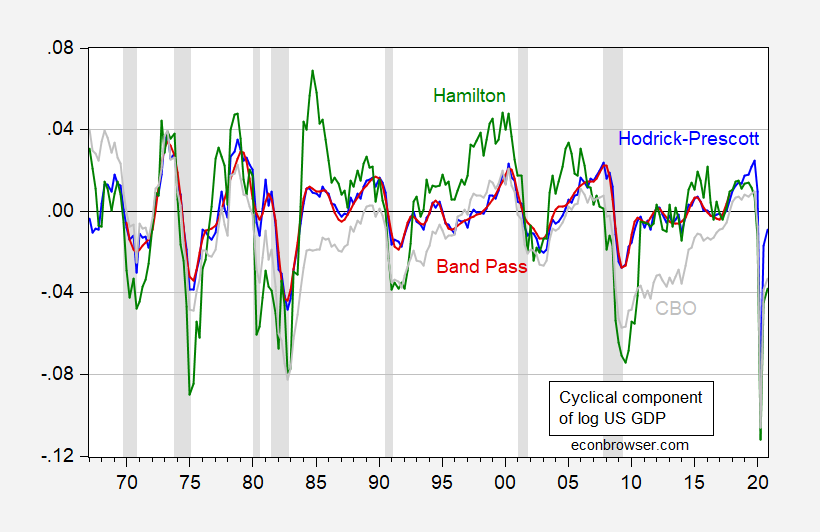
Figure 1: Cyclical component from Hodrick-Prescott filter (blue), from Baxter-King band pass filter (red), Hamilton filter (green), and output gap from CBO (gray), all in logs, estimated from 1967-2020 data. NBER defined recession dates shaded gray. Source: BEA 2020Q4 2nd release, CBO (February 2021), NBER, and author’s calculations.
Note that the HP filter (lambda = 1600) and band pass filter (EViews default) tend to imply a relatively small cyclical component. The Hamilton filter (using h=8, p=4) implies substantially larger cycles — with a standard deviation about twice that of the other statistical measures over this sample.
The CBO output gap has a standard deviation of about 2.4% (vs. 3% for the Hamilton filter).
What filter should you use? Jim explains why you should never use the HP filter here. Cogley and Nason (JEDC, 1995) have even more reasons. Van Norden discusses band pass filters.
For a discussion of “maximal output” a la Delong and Summers (BPEA, 1988), see this post.
There are also distinctions between potential and natural rates of output, as discussed here.
Remind us again – how large is the current gap using the maximal output measure a la Delong and Summers? Princeton Steve is impressed for some reason that Summers has decided that Biden’s fiscal policy is too big. Of course Summers some 12 years ago shouted down Christina Romer for proposing too much fiscal stimulus. In hindsight, she was right.
Yeah, It is way better to be too bold than fainthearted at present.
Following up on pgl’s comment and also my past remarks rising questions about the importance of output gap measures in general, I note that there have been several periods since 1985, especially the late 90s but others as well, when all of these measures showed the economy supposedly above its potential. Yet we have not seen any noticeable increases in inflation in any of those periods basically since the mid-1980s. So this indeed gets back down to it: if these are supposed to show the economy somehow above some sort of meaningful level of sustainable output, why have we not seen any of that accelerating inflation that we are supposed to worry about if the eonomy gets too “overheated”?
If I have my concepts right, any deviation from trend growth is, by definition, either cyclical variation or a change in the underlying secular pattern. Smaller variations in the cyclical component necessarily means larger changes in the secular component, relative to the deviation from trend.
Do those who rely on HP, band pass and other such filters have an economic explanation for ghe implication of relatively large secular swings? If one relies on estimates of slack to make policy recommendations, one ought to have an economic justification for the slack estimate. The random (or even not so random) choice of one bit of math over another isn’t much of a foundation for economic policy.
Macroduck: Well, no there’s not much economic justification for these filters, just as in the good ol’ days, we’d run a regression of some variable on a deterministic time trend to detrend a variable. Done implicitly in lots and lots of panel regressions if you think about it.
The thing that troubles me is that I have seen economic justifications for assuming sime change in underlying trend in the aftermath of recession. Along tje lines of “The output gap isn’t as large as so-and-so claims because the growth trend is now lower.”
If the claim that the growth trend is lower grows out of the choice of one statistical filter over another, the economic justification is not a justification because it isn’t actually based in economics.
Macroduck: We can examine how likely it is to see a change in trend at recessions, in this systematic cross-country analysis by Blanchard, Cerutti and Summers. Trend line shifts about 1/3 of the time.
The issue of comparing different output gaps is further compounded by the fact that the volatility or the “amplitude” of the cycle (and trend) is mostly super-imposed and not estimated from the data. This holds at least for HP-filter, BP-filter and T-C decomposition gaps. Output gap volatility is determined by a specific selection of the smoothing parameter (HP), business cycle frequencies (BP) or bounds placed on error variances (in T-C decompositions; since they tend converge to corner solutions when no bounds are placed). To some extent we are comparing “prior-beliefs” of practitioners instead of data driven estimates.
For this reason, I would rather not compare them in “cross-section” for specific time-points (e.g. CBO -5% in 2009 vs Hamilton -7% in 2009). Instead, I would compare their dynamics in time. For example, CBO’s output gap achieves through in 2009 and remains negative up to 2016. Hamilton’s achieves low in the same year, closes in 2011 and signals balanced growth after. The focus would be more on the “length” of the cycle. We could then use data, other than gdp, to gauge if the economy was depressed or on a balanced growth path since 2011 (unemp. rate, survey indicators, capacity utilization…).
I would avoid using inflation for this purpose since there are many papers showing that inflation is decoupled from the output gap since the great moderation. Be it for improved management of expectations by CBs, increase in CB independence, IT services, or simply good luck…
Finally, the volatility of the cycle might not matter so much for policy purposes, which sounds contradictory. But policy advice is often given not by observing the size of output gap in isolation, but by regressing gap on policy variables (say gvn. exp.). It then matters less how volatile it is because regression beta partly adjusts for its volatility.
https://fred.stlouisfed.org/graph/?g=AvnM
January 30, 2018
Real Gross Domestic Product and Real Potential Gross Domestic Product, 2007-2021
(Percent change)
https://fred.stlouisfed.org/graph/?g=AvnR
January 30, 2018
Real Gross Domestic Product and Real Potential Gross Domestic Product, 2007-2021
(Indexed to 2007)
https://fred.stlouisfed.org/graph/?g=xVUf
January 30, 2018
Real Gross Domestic Product / Real Potential Gross Domestic Product, 2007-2021
(Indexed to 2007)