With apologies to John Donne.
Jim provided some key points in his Thursday post regarding the 21Q2 advance figures. Here are my additional takeaways: (1) the Administration’s forecast locked down in February looks prescient; (2) Final sales were higher than GDP, (3) exports have not buttressed growth, partly because of slow rest-of-world growth, (4) price growth is a rising share of nominal GDP growth.
Growth Disappointment (Relative to June…)
First, the GDP release in context of forecasts.
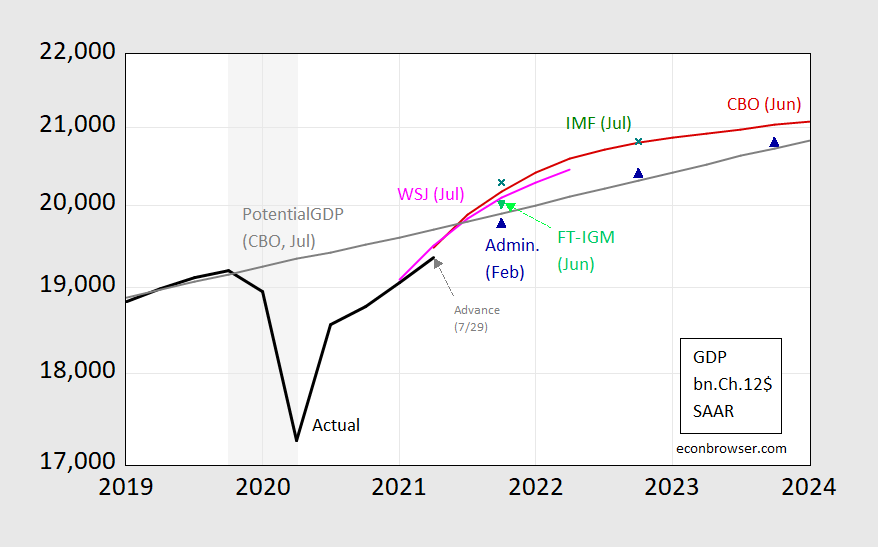
Figure 1: GDP as reported on 7/29 in 2021Q2 advance release (black), Administration FY22 forecast (blue triangle), CBO June forecast (red line), FT-IGM (light green triangle), IMF July WEO (green x), potential GDP as estimated by CBO in July 2021 (thick dark gray line). Dates indicated denote when the forecasts were “locked down”. Source: BEA 2021Q2 advance release, OMB FY’22 Budget, WSJ July survey, and FT-IGM survey (June), CBO (February, July), IMF WEO (July), and author’s calculations.
There was an annual revision which pushed down slightly reported GDP. However, the forecasted GDP levels shown (which are imputed by the author assuming latest available GDP levels at the time of forecast — the forecasts themselves are reported in growth rates) reflect the earlier optimism. The Administration’s FY2022 Budget forecasts stand out as prescient in this regard.
One shouldn’t forget that relative to last year, outcomes are better than expected (W. Edelberg).
Aggregate Demand vs. GDP
Second, final sales — that is GDP minus decumulation in inventories — differs measurably from the highlighted GDP number. Final sales are higher, reflecting aggregate demand outstripping production.
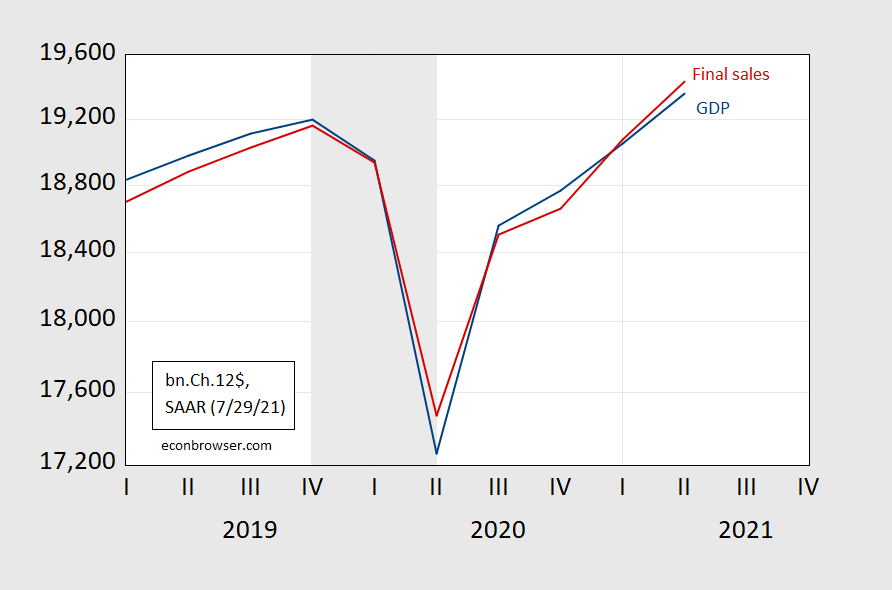
Figure 2: GDP (blue) and final sales (red), both in billions Ch.2012$ SAAR. NBER defined recession dates shaded gray. Source: BEA, 2021Q2 advance release.
This shows up in 2021H1 final sales growth outstripping GDP growth.
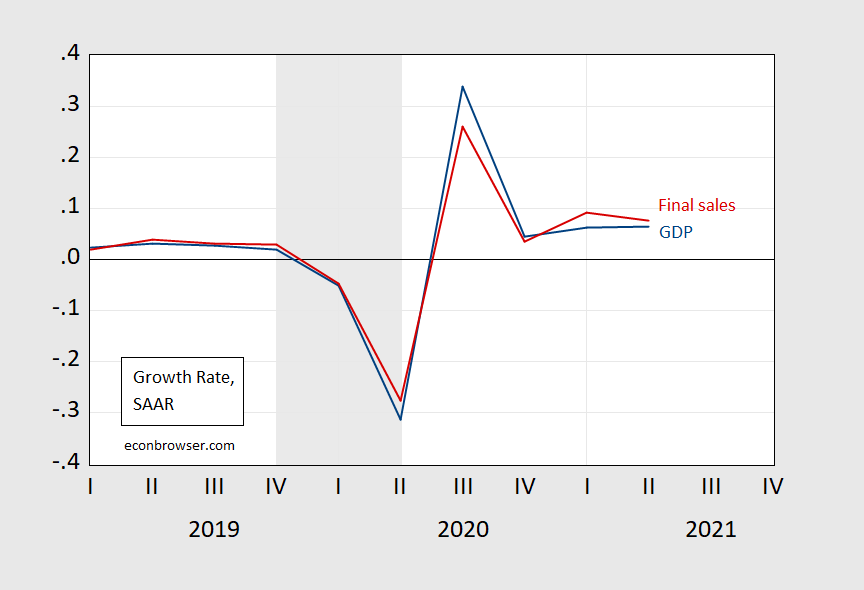
Figure 3: Quarter-on-quarter growth rates for GDP (blue) and final sales (red), in billions Ch.2012$ SAAR. NBER defined recession dates shaded gray. Source: BEA, 2021Q2 advance release.
In normal times, we would think of an equilibrating mechanism where (with supply passively adjusting to demand) inventories were rebuilt. Given these times, rebuilding (to an unknown-to-us optimal inventory-to-sales level) will take an unknown amount of time. Partly it depends on our ability to source from overseas.
The International Dimension
Imports have not recovered to the extent one might have expected in a normal recession. In addition to impediments left over from the Trump Administration, there are transport and supply constraints.
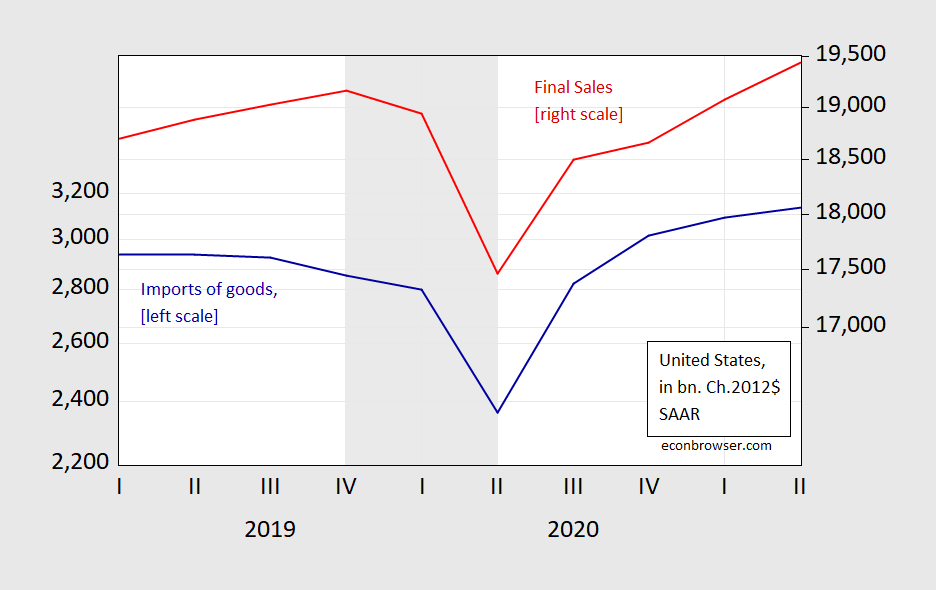
Figure 4: US Imports of goods (blue, left log scale), and US Final sales (red, right log scale), both in bn.Ch.2012$, SAAR. NBER defined recession dates shaded gray. Source: BEA, 2021Q2 advance release, NBER.
While capital goods have recovered at a faster pace, and now constitute a higher share of final sales than pre-pandemic, it’s not clear that given the reallocation of demand composition, this is “enough”.
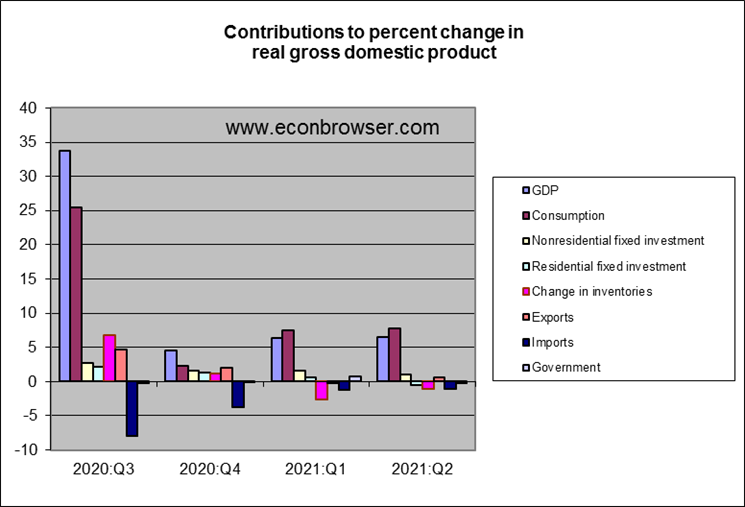
One point highlighted by Jim’s growth accounting is the small share of US GDP growth accounted by exports. This outcome is shown in a different way in Figure 5.
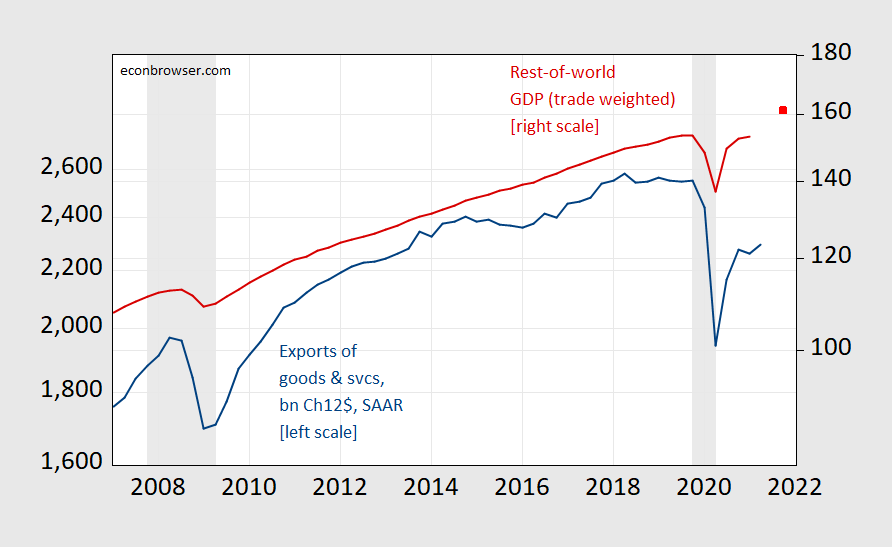
Figure 5: US Exports of goods and services, in bn.Ch.2012$, SAAR (blue, left log scale), and Rest-of-World trade weighted GDP, 2005=100 (red, right log scale), and extrapolated RoW GDP (red square, right log scale). 2021Q4 observation extrapolated using IMF WEO July update implied RoW Q4/A4 growth rate applied to 2020Q4 RoW GDP. NBER defined recession dates shaded gray. Source: BEA, 2021Q2 advance release, Dallas Fed DGEI, IMF WEO July database, NBER, and author’s calculations.
The stall in 2021H1 export growth is clearly linked to the slowdown in RoW slowdown in Q1. We don’t have a reading on Q2 RoW growth, but I used the IMF’s July World Economic Outlook forecast to impute the end-2021 level; despite the IMF’s markdown of particularly emerging market economy , RoW output is forecasted to be higher. That might provide additional support to aggregate demand going forward – although actual outcome will depend on the resolution of supply constraints. (This post outlines the impact of Covid-19 related public health measures impacting country exports — and hence our imports.)
One point that I want emphasize comes from the IMF World Economic Outlook‘s July update, wherein emerging market growth has been marked down (due in large part to the Delta variant’s spread and resulting impairment of economic activity). That means that US policymakers can not just blithely ignore developments in the rest-of-the-world. Our fortunes are tied up with the fortunes of those in the emerging market economies (perhaps as much as those who continue to refuse both to get vaccinated without specific medical grounds, and to undertake social distancing measures).
A Decomposition of Nominal GDP
The extent that supply constraints weighed on 2021Q2 is shown in Figure 6.
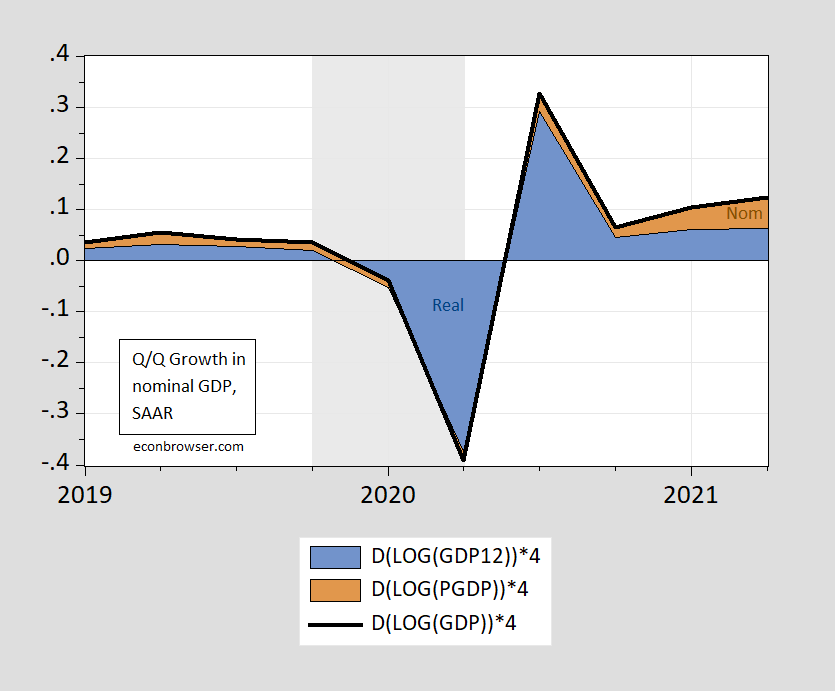
Figure 6: Quarter-on-quarter growth rate in nominal GDP (black line), in real GDP (blue area), and in price deflator (brown area), all SAAR. Growth rates calculated using log differences. NBER defined recession dates shaded gray. Source: BEA, 2021Q2 advance release, NBER, and author’s calculations.
Whether these price pressures persist depends on the extent of supply bottlenecks, the extent of elevated aggregate demand, and expectations of inflation (which work their way into pricing decisions, and into wage pressures). Yesterday’s personal income and outlays release suggested lower-than-anticipated and upward pressure on the PCE deflator, while (declining) employment compensation growth below consensus indicates that higher inflation hasn’t yet fed into substantial accelerating wage growth (see Jason Furman for more). For me, I see the Q2 share of price level growth to nominal GDP growth as a transient high.
I include the latest available market and survey based indicators in the wake of the GDP, personal income and outlays, and employment cost releases.
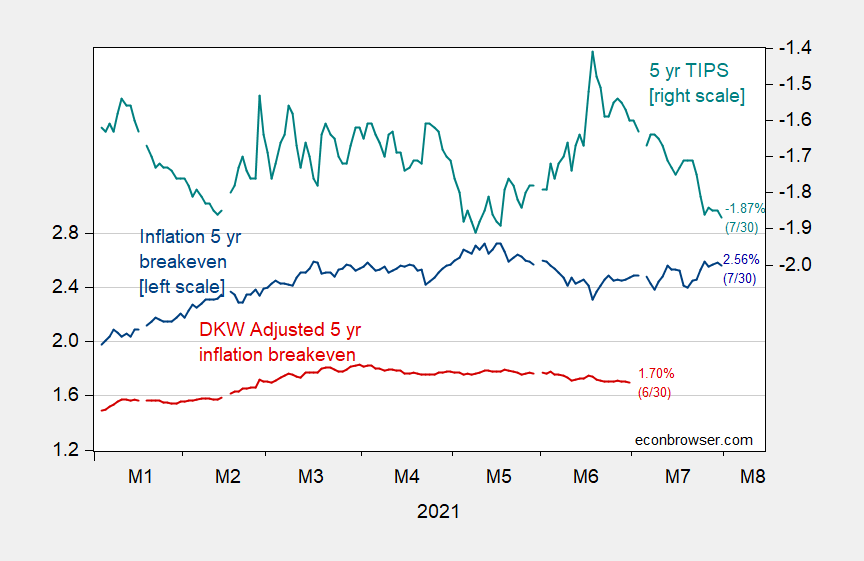
Figure 7: Five year inflation breakeven calculated as five year Treasury yield minus five year TIPS yield (blue, left scale), five year breakeven adjusted by inflation risk premium and liquidity premium per DKW (red, left scale), 5 year TIPS yields (teal, right scale), all in %. Source: Fed via FRED, Treasury, KWW following D’amico, Kim and Wei (DKW) accessed 7/7, author’s calculations.
The five year breakeven has barely budged in the way of these releases, and remains at 2.56%. If the estimated inflation and liquidity risk premia gaps have remained constant since 6/30, then anticipated average inflation over the next 5 years is still in the range of 1.8%.
“The stall in 2021H1 export growth is clearly linked to the slowdown in RoW slowdown in Q1. We don’t have a reading on Q2 RoW growth, but I used the IMF’s July WEO forecast to impute the end-2021 level; despite the IMF’s markdown of particularly emerging market economy , RoW output is forecasted to be higher. That might provide additional support to aggregate demand going forward – although actual outcome will depend on the resolution of supply constraints.”
One common theme in what Trump kept saying and what Biden is saying is the need to create high paying jobs for American workers. Now if anyone were serious about this – one would think economic policy would find a way to export more goods to the ROW. Trump utterly failed for reasons I think have been discussed a lot. Now the jury is still out on Biden’s economic policies but I hope his advisers have not forgotten the need to promote exports.
It would help if Biden were to loosen the leftover reatraints on imports from Trump. I get from Menzie that some of this takes some time to work through and out, but at least for some parts of this Biden seems to have more reluctant slow, apparently manifesting the protectionist wing of the Dems. This is not helping the economy at all, especially for anything like steel and aluminum and lumber that are clearly inputs to production and thus contributing to the supply problems in the economy.
off-topic
So the question remains: Why do Republican national legislators keep lending power to donald trump that he doesn’t even have???
https://www.charlotteobserver.com/news/politics-government/article253118418.html
Keep handing a weaponless donald trump that knife so he can stab Republicans with it. I promise you, Democrats are having fun watching it. Keep pointing the blade towards yourselves and give weaponless donald trump that knife. And watch what happens.
https://fred.stlouisfed.org/graph/?g=z21W
January 15, 2018
Shares of Gross Domestic Product for Private Fixed Nonresidential & Residential Investment Spending, Government Consumption & Gross Investment and Exports of Goods & Services, 2017-2021
https://fred.stlouisfed.org/graph/?g=z21I
January 15, 2018
Shares of Gross Domestic Product for Private Fixed Nonresidential & Residential Investment Spending, Government Consumption & Gross Investment and Exports of Goods & Services, 2017-2021
(Indexed to 2017)
https://fred.stlouisfed.org/graph/?g=AuPM
January 15, 2020
Shares of Gross Domestic Product for Private Fixed Nonresidential & Residential Investment Spending, Government Consumption & Gross Investment and Exports of Goods & Services, 2020-2021
(Indexed to 2020)
https://fred.stlouisfed.org/graph/?g=niDL
January 30, 2018
Exports of Nonagricultural Goods minus Imports of Nonpetroleum Goods, 2000-2021
https://fred.stlouisfed.org/graph/?g=niDQ
January 30, 2018
(Exports of Nonagricultural Goods minus Imports of Nonpetroleum Goods) as a share of Gross Domestic Product, 2000-2021
One point highlighted…is the small share of US GDP growth accounted by exports.
— Menzie Chinn
[ The routine and persistent use of economic sanctions by the United States has limited US exports and may increasingly do so. Several capable countries are shaping policy expressly to become independent of having to rely on critical US exports. Sanctions policy has apparently been pursued as though there were only effects on sanctioned countries, but that makes no sense to me. China may have been stopped from working on space exploration with NASA in 2011, but China now has an advanced global positioning system, a rover on Mars, a rover on the far side of the Moon, a collection of retrieved Moon minerals, a manned international space station, an advanced radio telescope, a planetarium… ]
https://news.cgtn.com/news/2021-07-02/IMF-urges-Biden-administration-to-remove-Trump-era-tariffs-11zb6nANzna/index.html
July 2, 2021
IMF urges Biden administration to remove Trump-era tariffs
The International Monetary Fund (IMF) urged the U.S. President Joe Biden’s administration to remove tariffs on imported steel and aluminum, washing machines, solar panels and a range of goods from China, according to a report * released on Thursday.
The tariffs imposed by the Trump administration on imports from China have remained in place. The Biden administration has also committed to prioritizing U.S. producers in public procurement, strengthening “Buy American” requirements put in place by the previous administration.
“These policies should be reconsidered. Trade restrictions and tariff increases should be rolled back and ‘Buy American’ provisions should be tightly circumscribed and made consistent with the U.S. international obligations,” the IMF said.
It also pointed out that investigations into currency-based countervailing duties on China and Vietnam and the inclusion of currency provisions in trade agreements represent a significant risk to the multilateral trade and international monetary systems.
“The U.S. should work actively with international partners to strengthen the rules-based multilateral trading system and address these longstanding global trade and investment distortions,” the IMF said, adding that renewed engagement at WTO could facilitate the progress….
* https://www.imf.org/en/News/Articles/2021/07/01/mcs070121-united-states-of-america-concluding-statement-of-the-2021-article-iv-mission
This is an attitude that hundreds of billions in annual trade deficits with ROW especially China doesn’t matter. I wish there more solutions given for it rather than pretension it is irrelevant to Americans’ wellbeing.
Menzie That means that US policymakers can just blithely ignore developments in the rest-of-the-world.
Typo? Shouldn’t that be “…cannot just blithely…”?
As to weak exports, obviously part of the explanation is due to bans on tourism and foreign students coming to this country.
2slugbaits: Thanks! Yes, you are correct; have fixed.
@ Menzie
I think some of these forecast lines are a joke, certainly anything above that light gray line is a joke. Are these people thinking about Delta’s effects at all?? This world is a strange world friends. Do you think that after a tornado rips through town on Tuesday that on Thursday of the same week when that same town hears the municipal tornado alarm it might cause them to jump?? Not America 2021. Look at the numbers just come in from China on services and manufacturing. Here’s a Reuters story on Germany—and it’s not just supply bottlenecks.
https://www.reuters.com/world/europe/germanys-economy-expands-less-than-expected-q2-2021-07-30/
Those forecasts aren’t adding up. The Delta variant is like the Jaws movie score playing in the background for any of those forecasts shooting above the gray line CBO rate.
Moses Herzog: The Administration’s forecast was finalized in February when arguably it was not known exactly how transmissable the Delta variant was, and how obstinate so many Americans would be in getting vaccinated. If you are saying that by July, Delta should have been taken as a more serious threat to growth, I’d agree (my first post on the subject is June 20th), although figuring out the magnitude of the negative impact would be difficult – and is still difficult. I think GS shaved a point off growth as a result of the rapid spread of the Delta variant, but off of a high baseline.
You should know I always respect the number crunching, and the effort you put in the juxtapose the different forecasts together to compare and have a broader picture. In fact I wouldn’t have much “grasp” of it at all without seeing and trusting your graphs. So “joke” should not be misunderstood in that context (and I think you know that, just wanted to make sure). And I will go back and look at your June 20 take again. I just, I mean, even if I don’t do models you have to give me half (one eighth??) credit that I do have some “feel” for these numbers. And when you look at the still unbelievable indignant/obstinate attitude (obstinate is about the perfect word to use BTW, unless you’ve seen many “Karen” videos, than you might want to choose something worse) still pervasive in both the USA and Europe (I think Europe has a slightly better attitude on masks and “jabs” than Americans, but there are large pockets of disgruntlement, example: France’s protests against Macron’s health pass) and a virus which spreads in exponential fashion, it’s really hard to see how we get those dots (in your top graph) located north of that CBO gray line. It’s as simple as it gets worse before it gets better.
Moses Herzog: If you were serious, you could take a reasonable baseline (pre-delta) forecast. Then look at all the counties that are low-vaccination, then see how much GDP arises in those counties, then figure out how much GDP is lost if high contact services fall like they did in March-May 2020. That would give you a sense of how much to cut your forecasted level of GDP relative to no-Delta baseline. Now you get a feeling for how hard it would be to generate the forecast in say early June when we have only gotten word from CDC on how transmissable the Delta variant is.
My view is that output will still rise above CBO’s latest estimate of potential by year’s end (I’m not far below the FT-IGM mean forecast).
Fair point. It’s mathematically intimidating (for me). I like to think not entirely impossible for me, but very mathematically intimidating. And as you point out less data to work with back in June.
Moses Herzog: Have spreadsheet, will travel. You could do it — all data probably accessible, down to county level. Wouldn’t require anything fancy, except learning how to tell Excel how to match county codes for data coming from CDC vs. coming from BEA.
“If you are saying that by July, Delta should have been taken as a more serious threat to growth,”
the cdc stopped tracking breakthrough infections in may. if they had continued through the summer, we may have been able to take this more seriously in july. the cdc dropped the ball on this one, and for the life of me i cannot understand why they stopped tracking. even in the biden administration, you see bumbling still occurring. just not on the same scale as the trump administration. just like when pfizer came out and said a booster is probably needed, the cdc immediately came out and refuted the idea. if they had been tracking breakthroughs, one would hope their response would have been different.
baffling: Perhaps part of the answer is – not blowin’ in the wind – but in Trump’s wake: NYT, 8/1/2021:
I’m still wondering how many USDA economists joined the exodus after the move to Kansas City?? Is there any breakdown source on that?? (not asking you hunt it down, only if you happen to know)
The divergence between U.S. and ROW growth is to a some extent a reflection of divergence in policy response. The U.S., consistent with the practice of recent cycles and with federal borrowing capacity, has engaged is substantial fiscal expansion.
The Fed, meanwhile, has engaged in substantial monetary expansion (to the extent that reverse repo operations were needed to keep the nominal overnight rate from turning negative), without having to concern itself too terribly much with the dollar’s exchange rates. Many other central banks do not have the luxury of ignoring FX rates for even a brief period.
In recent cycles, ROW growth has relied mostly on middle (and some lower) income countries. Among those countries, China has the capacity to stimulate demand in much the same manner as the U.S., but most others do not.
Aside from the fracking boom, the most common source of a narrowing of the U.S. trade deficit in the post-Bretton-Woods period (and perhaps earlier) has been recession. In a global pandemic, with U.S. counter-cyclical policy less constrained than policies in the rest of the world, recession has not worked to reduce the U.S. trade deficit and trade is likely to remain a drag on U.S. GDP growth for some time. Supply bottle-necks are icing on the cake — the high marginal propensity to consume imports in the U.S. is the cake.
If there are hysteresis effects (through financial constraints leading to reduced demand for capital and other imports, reduced demand for intellectual property licensing and so forth), then a persistent widening in the U.S. trade deficit may occur, a symptom of damage to middle income countries’ economic health due to Covid.
http://www.xinhuanet.com/english/2021-08/01/c_1310100688.htm
August 1, 2021
Over 1.65 bln doses of COVID-19 vaccines administered in China
BEIJING — More than 1.65 billion doses of COVID-19 vaccines had been administered in China by Saturday, the National Health Commission said Sunday.
[ Chinese coronavirus vaccine yearly production capacity is now over 5 billion doses. Along with over 1.65 billion doses of Chinese vaccines administered domestically, another 700 million doses have been distributed internationally. A number of countries are now producing Chinese vaccines from delivered raw materials. ]
Again , and as long as you keep posting off-topic propaganda for you ideological masters, I’ll offer a clarification. The vaccine that China uses most at home and has exported most, Sinovax, is the least effective Covid vaccine in use around the world. It is only between 35% and 50% effective in preventing infection, depending on Covid variant. China has better vaccines but has promoted Sinovax over its own better vaccines. Pfizer, Astrazenica and Moderna are generally all better than any Chinese vaccines. China could have attempted to license them but chose to rely in Sinovax instead. Selfish and immoral.
https://www.worldometers.info/coronavirus/
August 1, 2021
Coronavirus
United Kingdom
Cases ( 5,880,667)
Deaths ( 129,719)
Deaths per million ( 1,900)
China
Cases ( 93,005)
Deaths ( 4,636)
Deaths per million ( 3)
https://news.yahoo.com/mark-meadows-says-cabinet-members-175100892.html
Mark Meadows seems to think Trump is still President and Meadows is still Chief of Staff. After all they are still holding Cabinet meetings.
I always thought Meadows was not the sharpest pencil in the box but can he be this incredibly stupid?
All it amounts to is, Meadows has nothing better to do, and it’s a roll of the dice he wins in 2024. If New York pussyfoots on the charges or doesn’t succeed, it’s not a bad gamble. I’d give donald trump a 40% chance of winning 2024 at this point, which is probably better odds than I would have given him in 2016. Even if he fails, Meadows still gets a salary to the end of the campaign. He’s like Mike Pence right?? There’s no “legacy” to protect at this stage of events. He already peed in his own bed.
https://fred.stlouisfed.org/graph/?g=mBnK
January 30, 2018
Inventories to Sales Ratio, 1992-2021
https://fred.stlouisfed.org/graph/?g=mBet
January 30, 2018
Inventories to Sales Ratio, 2007-2021
https://fred.stlouisfed.org/graph/?g=ESgw
January 30, 2018
Inventories to Sales Ratio, 2017-2021
[ With the ratio of inventories to sales having drifted down since 1992, I have no sense of how much of an increase to expect from here. ]
http://www.xinhuanet.com/english/2021-07/29/c_1310095071.htm
July 29, 2021
Xinjiang’s GDP rises 9.9 pct in H1
URUMQI — The gross domestic product (GDP) of northwest China’s Xinjiang Uygur Autonomous Region totaled 732.9 billion yuan (about 113 billion U.S. dollars) in the first half of 2021, up 9.9 percent year on year, local authorities said Thursday.
The steady growth was mainly driven by the secondary and tertiary industries, with their added values rising 10.5 percent and 10.3 percent year on year in the six-month period, respectively, according to the regional government.
Xinjiang’s tourism sector saw robust growth during the period. The region’s 4A and 5A tourist spots received about 23.4 million domestic and overseas visitors, an increase of 58.2 percent over the same period last year.
Song Xiuhong, deputy director of the regional statistics bureau, said Xinjiang’s economy has operated steadily but still faces pressure as “growth of major economic indicators has slowed down.”
Xinjiang will accelerate the construction of a modern industrial system in the second half of this year and focus on developing industries including new energy, new material, biomedicine and high-end equipment manufacturing, Song added.
too bad china has jailed many of the uighers in the region. genocide is not a good political policy to pursue by the ccp.
http://www.xinhuanet.com/english/2021-07/30/c_1310097779.htm
July 30, 2021
Tibet sees GDP up 9.1 percent in H1
LHASA — The gross domestic product (GDP) in southwest China’s Tibet Autonomous Region totaled 92.61 billion yuan (about 14.3 billion U.S. dollars) in the first half of 2021, up by 9.1 percent year on year, local authorities said Friday.
Despite the impact of the COVID-19 epidemic, the region’s average annual GDP growth for the past two years came in at 7.1 percent by the end of June, the regional statistics department said.
The value-added output of major industrial enterprises in Tibet increased by 21.1 percent year on year during the period, up 24.2 percent from the first half of 2019.
Its fixed asset investment went up by 16.6 percent over the same period of 2019.
The region also saw strong consumption demand, with its retail sales of consumer goods increasing by 13 percent year on year to 34.63 billion yuan.
Li Fangping, the deputy head of the Tibet survey office, National Bureau of Statistics, said the region’s economic recovery momentum had sustained in the first half.
It is important to solidly promote high-quality development to ensure the achievement of annual economic and social development goals, Li added.
The plateau region set its regional GDP growth target at more than 9 percent this year, according to the local government work report.
Of course, China’s formal name for Tibet, “Tibet Autonomous Region”, was crafted to erase Tibet’s true status. China annexed Tibet through violence and intimidation in 1951.
China’s version of history after the annexation was based on Chinese dominance of Tibet in the 13th century AD. China’s claim is that Tibet has been under Chinese dominance ever since, for the past 700 years. That claim is ridiculous on its face. Even China hasn’t been under Chinese dominance for 700 years. When Tibetans resisted Chinese efforts to erase Tibet’s culture in the mid-to-late 2000s, China’s propagandists again rewrote Tibet’s history, claiming Tibet to have become a part of China in some unspecified ancient past. All of which makes one wonder, if Tibet has been Chinese since ancient times, why does China need to erase Tibetan culture now?