Several commentators (e.g., [1] [2]) keep on taking me to task for citing GDP as if it was the variable of ultimate concern. I have repeatedly noted GDP is a measure of economic activity, not a measure of economic welfare. However, in order to deter these repetitive and sometimes sententious comments, I’ll provide some graphs to illustrate the difference between a measure of economic activity, and a measure of welfare.
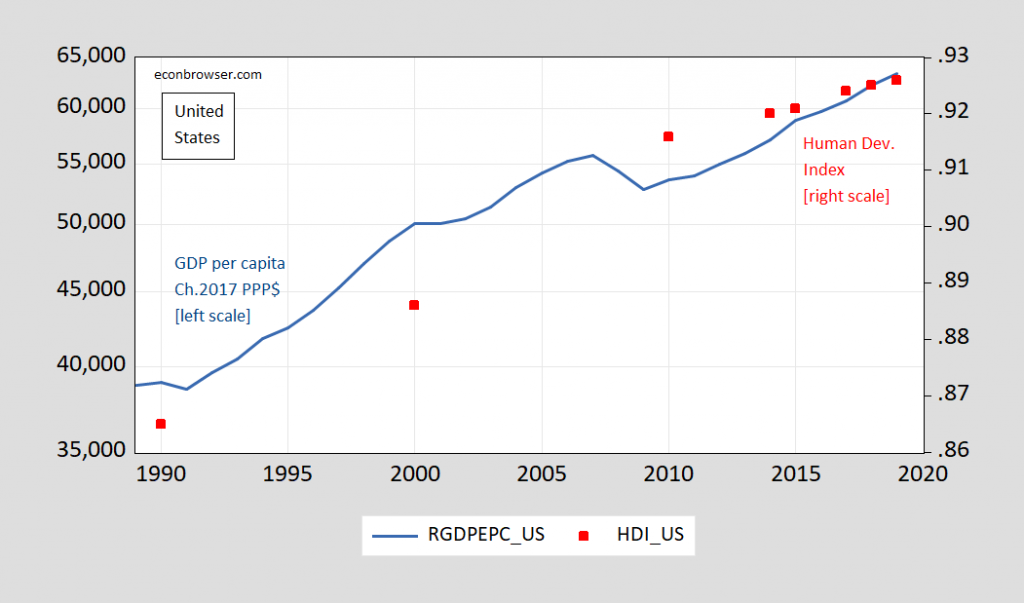
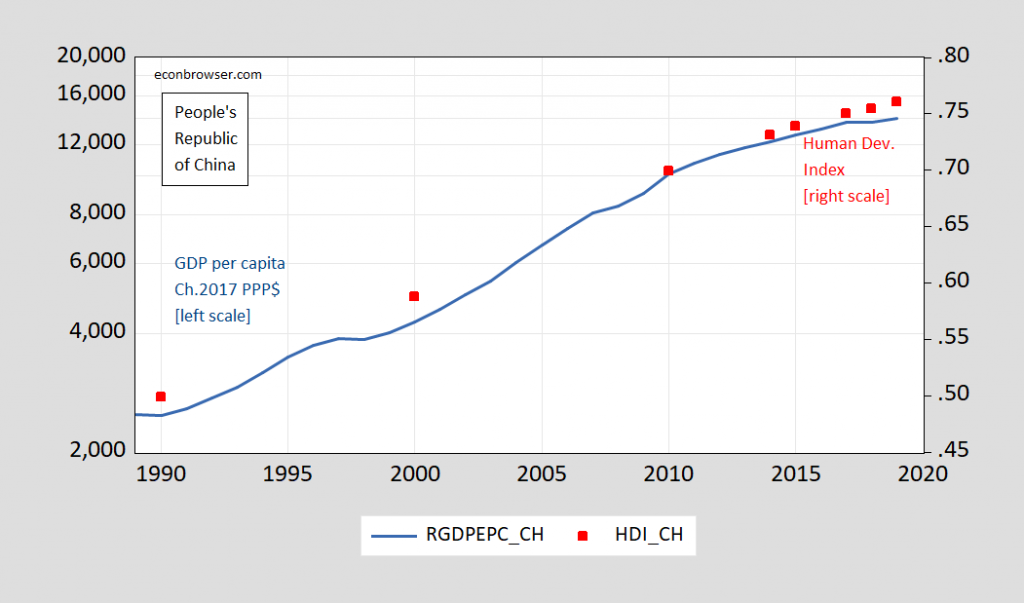
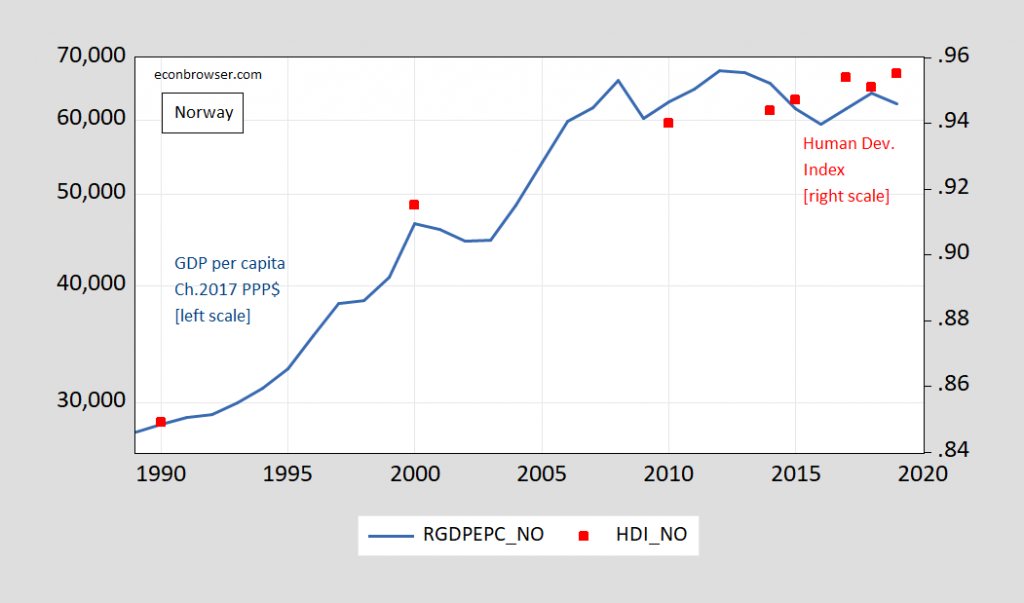
First I plot graphs for real GDP per capita and the Human Development Index for three countries: US, China, and Norway (the highest ranked in 2019 by the HDI).
Figure 1: US real GDP per capita, in PPP Chained 2017 US$ (blue, left scale), and Human Development Index for US (red square). Source: Penn World Tables 10.0, and UNDP.
Figure 2: Chinese real GDP per capita, in PPP Chained 2017 US$ (blue, left scale), and Human Development Index for China (red square). Source: Penn World Tables 10.0, and UNDP.
Figure 3: Norwegian real GDP per capita, in PPP Chained 2017 US$ (blue, left scale), and Human Development Index for Norway (red square). Source: Penn World Tables 10.0, and UNDP.
The HDI is briefly described thusly (2020 Technical Notes):
The Human Development Index (HDI) is a summary measure of achievements in three key dimensions of human development: a long and healthy life, access to knowledge and a decent standard of living. The HDI is the geometric mean of normalized indices for each of the three dimensions.
Graphically:
Source: UNDP (2020).
Note that per capita GNI (quantitatively similar to GDP usually) is a component of the HDI.
Obviously, the two series don’t comove exactly (as far as we can tell with these data). However, both per capita real GDP and the HDI co-trend. A naive regression of HDI on log per capita GDP for US and China yields a coefficient of about 0.15.
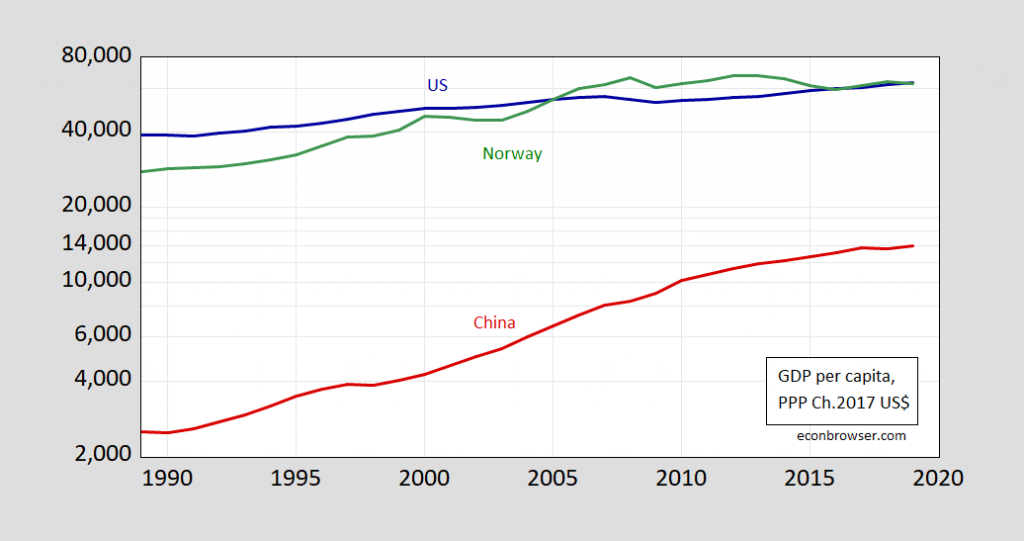
Figure 4: US real GDP per capita, in PPP Chained 2017 US$ (blue), Chinese (red), and Norwegian (green). Source: Penn World Tables 10.0.
Figure 5: US Human Development Index (blue squares), Chinese (red squares), and Norwegian (green squares). Source: UNDP.
So, now one knows – a broader measure of economic welfare typically co-trends, but there are surely deviations of one from the other; and cross-country comparisons of GDP per capita (even in PPP terms) and economic welfare will probably differ in terms of ranking.
I would not assert HDI is the best indicator; I’m only using it because it’s easily available and has been around for a long time. As the technical notes to the HDI lay out, there are additional versions, that account for income inequality and gender inequality, or focus on poverty.
There are innumerable papers on the subject of alternative means of measuring economic welfare. Rather than trying to cite most of them, I’ll refer the reader to one recent review (IMF, 2020) [link corrected 1pm]. See also this review article by Dale Jorgensen, “Production and Welfare: Progress in Economic Measurement” (JEL, 2018).


I wonder about some of these indexes. All to often there’s the secret hand of US public diplomacy lurking behind them. US life expectancy dropped last, which should have altered the trajectory downwards a bit.
JohnH: Without commenting on your theory, I will merely note the decrease in life expectancy that you were writing about is in 2020. The index only extends up to 2019.
I’m surprised that JohnH did not task you for not providing series that are updated on a weekly basis. After all – he thinks he can do this on a daily basis.
Thanks for the clarification. However, I might note that US life expectancy decreased in 2018 and 2019, too.
https://www.cdc.gov/nchs/pressroom/nchs_press_releases/2020/202012.htm
This is not exactly a ringing endorsement of the health and wellness of the US population, which just so happens to be major indicator of the HDI.
The fact that the index continues to rise at a fairly constant pace, despite the decline of a major indicator, should raise questions about its objectivity.
The decline of life expectancy was regularly cited as proof of the decline of Russia 30 years ago. And some commentators use declining life expectancy to wonder whether it might serve as a canary in the US coal mine, too.
Oops—totally misread that CDC report. Too bad it can’t be expunged.
“U.S. Life Expectancy Increased in 2019”.
That was the headline. The very first sentence also note life expectancy ROSE in 2018. Can you tell us more lies please?
“I wonder about some of these indexes.”
There you go again. Hey – why don’t you do the hard work and construct your own index?> And when you are done with that – take over the BLS since you think you can do better at providing reliable employment, wage, and price data. GEESH!
Well, the record from your comments section suggests those who are obviously political goons don’t care about thing like the relative similarity of welfare and income/output measures.
Those who are misinformed, on the other hand, while they tend not to hear what they don’t like, eventually learn. However, an apparent natural inclination toward believing the next scandalous nonsense about how economics is done means they come back with some other nonsense pretty soon.
But Menzie, thanks for trying.
The website Menzie provided has all sorts of useful presentations – NONE of which JohnH has bothered with. May I recommend this 2020 update that does recognize the role of COVID-19. It is also produced from people all over the world and not those evil Americans JohnH thinks are tilting its research.
http://hdr.undp.org/en/2020-report
But as usual – JohnH has his pet theories so why on earth should he be bothered with the incredible sources of research our host provides?
Speaking of human development:
https://www.nytimes.com/2021/10/27/us/politics/china-hypersonic-missile.html
Why not include the standard errors?
Again, because they would be so wide, you could tell any story and back it up with data?
Also, doesn’t Jacob Assa effectively presage this blog’s viewpoint, and answer it?
《Along with these popular critiques of Gross Domestic Product (GDP) as a narrow, growth-centered aggregate, many alternative measures of economic, social and environmental well-being and progress have sprouted in the past decade. […] the proposed remedies for GDP’s shortcomings are likewise statistical patches, whether replacing GDP with a happiness index, supplementing it with a dashboard of various indicators, or adjusting it to include unpaid care-work and the costs of environmental degradation. In all these cases, the belief is that, if one only applies the recommended cure, the patient would heal and be able to fulfill its original destiny, i.e. to measure the true wealth (or income) of nations.
This approach suffers from several problems. First, it has failed to de-hrone GDP due to its disconnect from theoretical economics, partly due to the fact that economists have long ago outsourced the measurement of macroeconomic aggregates to government statisticians (Fenoaltea 2019).
It also represents an instance of the Whig interpretation of history, where every subsequent period is seen to improve upon the past in a procession of continuous progress. Finally, and perhaps worst of all, it reinforces economists’ belief that their discipline is purely scientific, having no intersection at all with political forces or processes. GDP is not questioned by academic economists who consider it to be datum ex machina.
[…]
GDP is not a statistical measure. Rather, it is an implicit model of the economy relying on many assumptions and including several imputations based on these assumptions. Any change in the underlying model, in particular with regards to where the production boundary lies, would change the resulting numbers.》
Annals of the Fondazione Luigi Einaudi
Volume LIII, December 2019: 81-96
ISSN: 2532-4969
doi: 10.26331/1084
GROSS DOMESTIC POWER:
A HISTORY OF GDP AS NUMERICAL RHETORIC
Jacob Assa
Why are suicides and opioid deaths rising with GDP?
Why assume ergodicity?
Why do you trust datum ex machina?
Will I understand if you ban me, because we’re really dealing with religious fervor here and my heterodoxy is too threatening to the stories you’ve been telling for so long?
rsm: Since you haven’t violated the terms of use (racist, misogynistic comments), I don’t see why you fear being censored. I think you have a persecution complex.
Okay, maybe I can try again to pinpoint my disquietude at your lazer-like focus on GDP?
《I have repeatedly noted GDP is a measure of economic activity, not a measure of economic welfare.》
Is it even that, when you throw out 90% of the transactions actually occurring? What is the dollar volume of daily repo? What is the daily volume of real goods exchanging hands? Is the former ten times the latter?
Can I tell a story where real activity starts with financial flows, which means finance conditions the real economy?
《So, now one knows – a broader measure of economic welfare typically co-trends》
Correlation is causation? What does one actually know, that one arbitrary, political index co-trends with another arbitrary, potentially slightly differently political index, and all the caveats of correlation should apply?
On a personal note may I add that according to that Human Development Index, my 49-year old brother should have been near the top when he decided his utility maximization involved suicide? And that I fully blame the economists who indoctrinated him at Berkeley during the height of Reaganism for setting him down a wrong path of accounting, for purely crass economic reasons whose spiritual bereftness led to his eventual choice to end his life? Is this personal?
“Lazer-like focus”? So, aside from the tired old trope, symptomatic of a lack of thought, and the haranguing style, symptomatic of a lack of thought, you’ve got the whole fingers in your ears thing going for you, symptomatic of a lack of thought. New evidence contradicting your position? Dismiss it. Demonstration that you don’t know the difference between a fact and a factory? Ignore it. And there’s your Tourettes-like focus on standard errors.
Menzie, please ignore this guy. He isn’t in a conversation. He’s using your comments section as a soapbox. Ignore him and maybe he’ll go away.
Let’s definitely ignore this dude. While we are at it – let’s ignore ltr, JohnH, and all of the Usual Suspects!
he obviously has unmanaged anger issues and directing blame at others. given his family history, i would recommend he take some time to visit a therapist and process some of these unresolved issues. that is not meant to be a joke, rjs. consider it a friendly observation from somebody who hears cause for concern.
Speaking of needing to see a therapist, check out this guy’s eyeballs. Based on the picture in the video embed, I am now giving more credence to QAnons’ lizard people theory:
https://www.koco.com/article/mark-zuckerberg-facebook-future/38092488
For the record, I don’t think people should be attacked for sharing personal things on the blog. It’s very low in my book to poor salt on people’s wounds when people are honest enough to share things. He has the right to criticize some aspects of GDP. Great economists such as Thomas Piketty have questioned how things are measured. It is that cynicism which has brought new insights and new cognizance. Such as the wild thought that there are no “masters of the universe”~~an extremely dangerous concept for people to buy into.
rsm,
Sorry about your brother, but your claim that he wwas “near the top” when he thought suicide maxxed his utility, is simply wrong. One of the components of the Human Development Index is life expectancy. Ending one’s life at 49 clearly totally violates that.
I know, this is snarky, but you are coming off here as just completely deranged. And, sorry, but “economists” are not to blame for whatever happened to your brother.
You should create a post about this comment.
“Will I understand if you ban me?” Welcome, Don Quixote. Your destiny calls.
https://fred.stlouisfed.org/graph/?g=DvHV
January 15, 2018
Life Expectancy at Birth for China, United States, India, Japan and Germany, 1977-2019
https://fred.stlouisfed.org/graph/?g=EW3v
January 30, 2018
Infant Mortality Rate for China, United States, India, Japan and Germany, 1977-2019
https://fred.stlouisfed.org/graph/?g=DvHM
January 15, 2018
Life Expectancy at Birth for China, India, Brazil, Mexico and South Africa, 1977-2019
https://fred.stlouisfed.org/graph/?g=vX8P
January 30, 2018
Infant Mortality Rate for China, India, Brazil, Mexico and South Africa, 1977-2019
https://fred.stlouisfed.org/graph/?g=Fk1O
January 15, 2018
Life Expectancy at Birth for China, Thailand, Indonesia and Philippines, 1977-2019
https://fred.stlouisfed.org/graph/?g=Fk20
January 30, 2018
Infant Mortality Rate for China, Thailand, Indonesia and Philippines, 1977-2019
https://www.globalhungerindex.org/ranking.html
October, 2021
For the 2021 GHI report, data were assessed for 135 countries. Out of these, there were sufficient data to calculate 2021 GHI scores for and rank 116 countries (by way of comparison, 107 countries were ranked in the 2020 report). For 19 countries, individual scores could not be calculated and ranks could not be determined owing to lack of data.
https://fred.stlouisfed.org/graph/?g=IhxV
January 15, 2018
Life Expectancy at Birth for United States, Sweden, Denmark, Norway and Finland, 2000-2019
https://fred.stlouisfed.org/graph/?g=Ihy6
January 15, 2018
Infant Mortality for United States, Sweden, Denmark, Norway and Finland, 2000-2019
Sadly and troublingly, notice that between 2014 and 2019 life expectancy at birth in the United States failed to grow. I know that Angus Deaton and Anne Case argued that this was singular and troubling.
Gee – here is what JohnH claimed:
“I might note that US life expectancy decreased in 2018 and 2019, too.”
Go check the CDC report he linked to as it notes US life expectancy ROSE. So he blatantly lied. You to say it does not increase is also a lie. If you want us to stop calling you two liars – STOP LYING!
Did anyone else notice that the US and China both grew 4.9% in real terms (YoY), in the same quarter?
First time that’s happened, if memory serves.
Are you ignoring the Easterlin paradox? Are you cherry-picking indexes, since opioid and suicides also co-trend with GDP?
rsm,
Just whom exactly are you addressing with this remark? Most of us accept that the HDI is probably more likely to be correlated with measures of happiness than just real per capita income. Both the US and China have exhibited the Easterlin paradox, with the US happiness levels maxing out n 1956 and declining rather sharply recently, as life expectancy has declined for various groups even before the pandemic hit. And China saw happiness levels decline sharply from 1990 to about 2005. even as real per capita GDP boomed.
BTW, I don’t know about opiod use, but you are way wrong about suicide rates “co-trend with GDP.” The nations with the highest suicide rates in the world are Eswatini, Central African Republic, Angola, and some others along those lines, most definitely not high income. I suggest before you spout off here again you make sure “facts” are not so completely false.
https://uca.edu/cahss/files/2020/07/03-King-CLA-2020.pdf
I think you would find business cycles more strongly correlate with self-destructive type behaviors. Namely downturns. Many (most??) economists (social scientists if the gentle reader prefers) compile numbers and look at relations between the numbers to find solutions to perennial societal problems.
Martin Weitzman and Alan Krueger were two such social scientists, trying to resolve many of these problems. Anyone with empathy feels these things. Some of this is also related to morality and religion, but I won’t “bore” anyone with that discussion today.
Many people wonder why so many musicians and artists use drugs and alcohol. It’s my theory this is the case because they feel or “carry” deeper levels of empathy than the average randomly chosen person. But I have nothing tangible to prove that hypothesis.
If you want to measure how well our system has performed, how about this:
The Average American Today Is Richer than John D. Rockefeller
…. Atlantic story reveals how Americans lived 100 years ago. By the standards of a middle-class American today, that lifestyle was poor, inconvenient, dreary, and dangerous. (Only a few years later — in 1924 — the 16-year-old son of a sitting US president would die of an infected blister that the boy got on his toe while playing tennis on the White House grounds.)
If you were a 1916 American billionaire you could, of course, afford prime real-estate. You could afford a home on 5th Avenue or one overlooking the Pacific Ocean or one on your own tropical island somewhere (or all three). But when you traveled from your Manhattan digs to your west-coast palace, it would take a few days, and if you made that trip during the summer months, you’d likely not have air-conditioning in your private railroad car.
And while you might have air-conditioning in your New York home, many of the friends’ homes that you visit — as well as restaurants and business offices that you frequent — were not air-conditioned. In the winter, many were also poorly heated by today’s standards.
To travel to Europe took you several days. To get to foreign lands beyond Europe took you even longer.
Might you want to deliver a package or letter overnight from New York City to someone in Los Angeles? Sorry. Impossible.
You could neither listen to radio (the first commercial radio broadcast occurred in 1920) nor watch television. You could, however, afford the state-of-the-art phonograph of the era. (It wasn’t stereo, though. And — I feel certain — even today’s vinylphiles would prefer listening to music played off of a modern compact disc to listening to music played off of a 1916 phonograph record.) Obviously, you could not download music.
There really wasn’t very much in the way of movies for you to watch, even though you could afford to build your own home movie theater.
Your telephone was attached to a wall. You could not use it to Skype.
Even the best medical care back then was horrid by today’s standards: it was much more painful and much less effective. (Remember young Coolidge.) Antibiotics weren’t available. Erectile dysfunction? Bipolar disorder? Live with ailments such as these. That was your only option.
You (if you are a woman) or (if you are a man) your wife and, in either case, your daughter and your sister had a much higher chance of dying as a result of giving birth than is the case today. The child herself or himself was much less likely to survive infancy than is the typical American newborn today.
……nearly every middle-class American today is richer than was America’s richest man a mere 100 years ago.
https://fee.org/articles/average-americans-today-are-richer-than-john-rockefeller-ever-was/
sammy,
But John D. Rockefeller did live to be 97 years old.
My dad (90 year old retired principal, with a microwave, mobile phone, refrigerator, freezer, laptop, Skype, e-mail, vaccines, and a 90 year old wife, is a cancer survivor, and a multiple-continent traveller) thinks Rockefeller’s wealth is over-rated.
Given the prevalence of gun deaths, drug overdoses, obesity, homelessness and mental illness in the U.S., I am surprised that our HDI is similar to Norway’s. Anyone who has visited that country is immediately struck by how advanced their society is compared to ours.
The covid pandemic in the U.S. has further revealed how backward and ignorant many of our fellow citizens are: over 60 million are still unvaccinated and over 200,000 are dead as a result. A third of Americans believe Biden won the 2020 election due to widespread voter fraud. The most successful news network in the country has built its business model on exploiting the ignorance of its viewers. The education of our people is pathetic.
I have been revisiting the start of nazi germany. I never thought it would be relevent to the usa. But it is interesting to learn how a generally intelligent population went down the rabbit hole in germany. We have a similar thing happening here. A couple common denominators are unchecked propaganda, and use or threat of force to promote an ideology. I think our country is in more danger than i thought a year ago.
“I think our country is in more danger than i thought a year ago.”
Considering the shocking news today about John Eastman, we were, and still are, in grave danger of a Reichstag Fire that would end our democracy.
https://www.washingtonpost.com/investigations/eastman-pence-email-riot-trump/2021/10/29/59373016-38c1-11ec-91dc-551d44733e2d_story.html
I assume that the rise of the Third Reich was also enabled by intellectuals like Eastman who justified Hitler’s destruction of Germany’s democracy. Incidentally, my father was a student at Heidelberg University in 1939. He never spoke of what he observed there.
“I am surprised our HDI is similar to Norway”
The above graph, though numerically accurate, is a tad misleading for two reasons.
1: The U.S. ranks 17th in the world in terms of HDI – below other English speaking nations (Australia, Canada, New Zealand, U.K.).
2: HDI is not intended as a measure of welfare. It is a measure of human development based on an average (actually, the geometric mean) of other averaged indices. In particular, it takes no account of inequality which is an essential index in any real welfare measure. To address this, the latest HDI report includes an inequality adjusted HDI (IHDI) listing. On that the U.S. ranks 28th and is one of a handfull of countries to register negative growth over the last 10 years. Norway ranks first on both measures. The latest report is a free download (below). For a more concise reference, Wikipedia has good articles on HDI and IHDI and includes country rankings.
http://hdr.undp.org/en/2020-report/download
Good blog post Menzie.
It worth pointing out that the Environmental Kuznets Curve strongly suggests that increases in per capita income eventually result in far better environmental outcomes.
Becoming richer is a good thing if one cares about environmental and public health outcomes.
Thought the story and data visuals of the different cities was interesting. Thought those who are fans of visual data might also enjoy it, along with any of Menzie’s Black readers:
https://www.bloomberg.com/news/articles/2021-10-28/covid-vaccination-rates-how-black-doctors-increased-shots-in-philadelphia