Retail sales, industrial (but not manufacturing) production far above consensus.
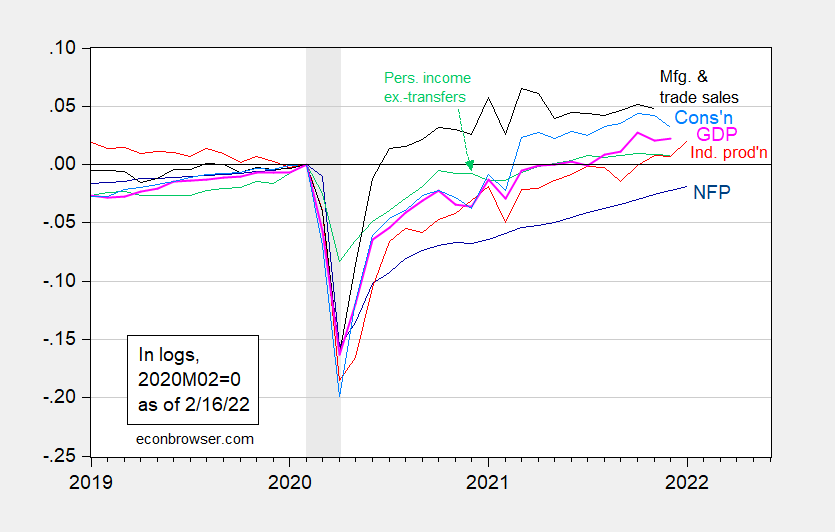
Figure 1: Nonfarm payroll employment (dark blue), industrial production (red), personal income excluding transfers in Ch.2012$ (green), manufacturing and trade sales in Ch.2012$ (black), consumption in Ch.2012$ (light blue), and monthly GDP in Ch.2012$ (pink), all log normalized to 2020M02=0. NBER defined recession dates, peak-to-trough, shaded gray. Source: BLS, Federal Reserve, BEA, via FRED, IHS Markit (nee Macroeconomic Advisers) (2/1/2022 release), NBER, and author’s calculations.
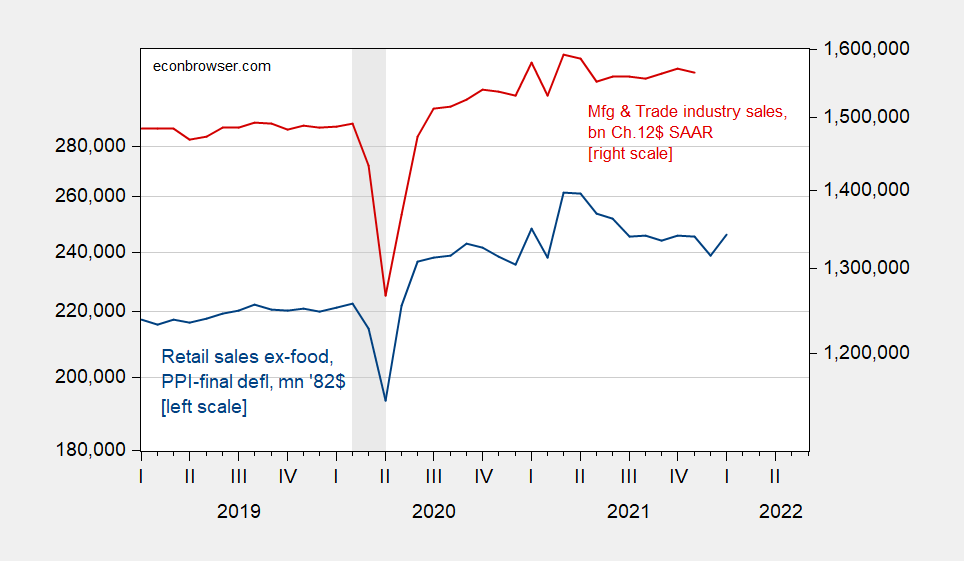
Retails sales is not in the graph above. However, to the extent there’s a rebound in retail sales, this is suggestive of maintained levels of manufacturing and trade sales (black line in Figure 1).
Figure 2: Retail sales ex-food services, mn 1982$ (blue, left log scale), and manufacturing and trade industry sales, in billions Ch.2012$, SAAR (red, right log scale). Retail sales deflated using PPI-finished goods. NBER defined recession peak-to-trough dates shaded gray. Source: Census via FRED, FRED, BLS, NBER, and author’s calculations.
A regression over the sample shown above yields (in first log differences) an adjusted-R2 of 0.81, a slope coefficient of 0.72.
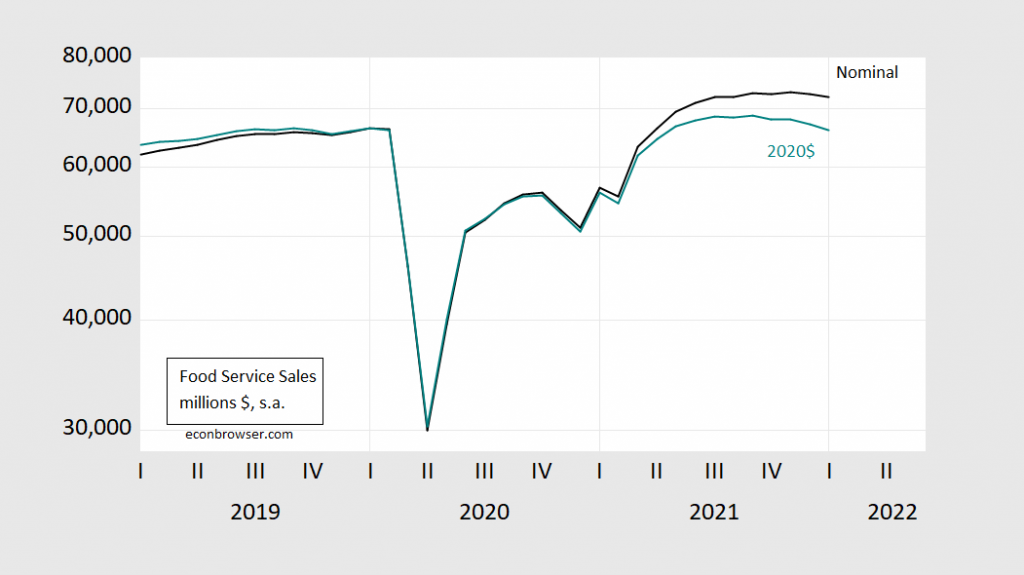
Implied food services sales — the gap between FRED series RSAFS and RSXFS — declined in January, perhaps reflecting omicron’s impact.
Figure 3: Food service sales, in millions $, s.a. (black), and in millions 2020$, s.a. (teal). Real series deflated using CPI. Source: Census, BLS via FRED and author’s calculations.
Adjusted for (CPI) inflation, the decline has been occurring for several months.


A Fidelity newsletter makes the following comment about inflation and the strength of the US dollar.
“The strong demand for goods that has driven up inflation in the US also has contributed to economic growth and interest rates that are higher than in other developed countries. The US dollar has leaped against other currencies as a result. The dollar could keep appreciating because US economic growth is likely to remain stronger than that of other developed markets and interest rates are expected to rise. Since 1999, when the dollar has switched from depreciating to appreciating, inflation during the next 12 months has slowed 70% of the time. A stronger dollar would further reduce the cost of imported goods, which could help offset other inflationary pressures.”
https://www.fidelity.com/learning-center/trading-investing/markets-sectors/peak-inflation
There was a similar argument back in the early 1980’s although not exactly the same macroeconomic position. Volcker was determined to crush inflation and really hated St. Reagan’s massive fiscal stimulus (tax cuts for rich people and a defense spending surge). So we got very tight money with a surge in interest rates leading to both the 1982 recession and a stronger dollar. Yes inflation came out in part because of the huge recession but also because the cost of imports fell.
The trick for policy now is how to keep the economy strong but still have inflation retreat.
progressive war spending, biden just sent up a fy 2023 ‘defense’ bill nominally $770B. like the appn’s since bush II the pentagon is getting real $$ as high as the reagan build up…. for year after year!
lots of money for super weapons, and contractor logistics. good return on lockheed stocks…..
need a blow up in east europe to keep the pentagon green
if we don’t blow the world up that is
heaven help us
Professor Chinn,
I was hoping that you may tell us what type of model can be used to replicate the comment about inflation slowing: “when the dollar has switched from depreciating to appreciating, inflation during the next 12 months has slowed 70% of the time.”
AS: Hard to know w/o knowing how they tabulated appreciation/depreciation, and over what sample. If I had to do it, I’d estimate a Markov switching model a la Hamilton (you can do it in EViews with SWITCHREG). Figure out the depreciating regimes, then see what inflation is doing in the subsequent 12 months after the end of each depreciating regime.
Ooooh, I cannor resist noting that a tendency for currencies movements to have momentum, to keep appreciating or depreciating once they get going, was something Menzie mentioned in his talk at JMU yesterday as one of the phenomena out there that make foreign exchange markets behave in ways that our standard models would not predict or forecast. And indeed, such trends do exist, and I note a famous and highly cited early paper on this, predating Menzie’s career, was by Jim Hamiltion with Engel, if I am remembering correctly.
Barkley Rosser: Yes, the reference is “Long Swings in the Exchange Rate: Are they in the Data and Do Markets Know It?” https://www.nber.org/papers/w3165 . Engel Hamilton 1994 unfortunately shows they can’t outpredict a random walk, https://www.sciencedirect.com/science/article/abs/pii/0022199694900620
Professor Chinn,
Thanks. I thought that a Markov switching model may be involved but wondered how to combine the CPI in the model. Seems like it is a manual count after finding the switching dates.
I am having a difficult time finding the data for the nominal broad based dollar index at the Fed. I found data back to 2006, but not back to 2000. I also need to look at a some YouTubes on Professor Hamilton’s model, since it has been a few years since I looked at his model.
AS: You can get the discontinued Fed series on goods-trade-weighted dollar going back to 1973 — ends in 2020 or so, I think. You can splice together with the goods-and-services trade weighted dollar. Or you can download the BIS nominal trade weighted dollar from their website.
Great conversation. This is what blogs offer that many newspapers and traditional media don’t, and why blogs are still very important and beneficial.
“Since 1999, when the dollar has switched from depreciating to appreciating, inflation during the next 12 months has slowed 70% of the time.”
Yeah, but inflation slowed on average from 1999 till Covid arrived, so there’s a bit less magic here than meets the eye. What Fidelity doesn’t report is how often inflation slowed when the dollar weakened. Naturally, U.S. inflation would tend to slow relative to inflation among U.S. trade partners when the dollar strengthens.
I’m not familiar with Denise Chisholm, and while I agree that inflation is likely to cool, I would be quite surprised if there is much sophistication behind her claim about the dollar and inflation. I say that because the other bits of analysis she offers seem thin. She expects rising market interest rates to reduce inflation. Good as far as it goes, but rates are actually still historically quite low, negative after accounting for inflation. She points to ISM data which she says indicates rapid inventory rise. Fine, but why not look at actual inventory levels, instead of ISM directional stuff? The retail stock/sales ratio is still extremely tight, though up slightly fro historic lows. That’s not a great sign for slower inflation.
Everything she says makes sense in general terms, but at a sort of “market letter” level of analysis. Based on just this example of Chisolm’s analysis, the work you show here is better.
Market analyst, or cosmetics salesman at the shopping mall?? “Would you like a presentation with this skin cream and the bags under your eye?? See in this small mirror how if I add this moisturizer at $300 a small jar, it covers up the lines and wrinkles the exact same effect a $15 jar of Pond’s cream does?? But wait, I’ll give you a 33% discount, sell it to you for $200 and you’ll only be $185 behind if you had just got the Pond’s cream. Don’t pass up this deal, because it’s only available until the mall closes today. Unless it’s not of course.”
Yeah, pretty much.
“Yes inflation came out …” should have read Yes inflation came down …
https://fred.stlouisfed.org/graph/?g=Eywn
January 15, 2020
Consumer Price Index for food at home and food away from home, 2020-2022
(Percent change)
https://fred.stlouisfed.org/graph/?g=L4z4
January 15, 2020
Consumer Price Index for food at home and food away from home, 2020-2022
(Indexed to 2020)
https://fred.stlouisfed.org/graph/?g=sxvX
January 15, 2020
Advanced and Emerging Country Trade Weighted Price of an American Dollar, 2020-2022
(Indexed to 2020)
https://fred.stlouisfed.org/graph/?g=sxvP
January 15, 2020
Real Advanced and Emerging Country Trade Weighted Price of an American Dollar, 2020-2022
(Indexed to 2020)
https://fred.stlouisfed.org/graph/?g=D1gC
January 15, 2018
Real Narrow Effective Exchange Rate * and Net Exports as a share of Gross Domestic Product, 1970-2021
* Indexed to 1970
https://fred.stlouisfed.org/graph/?g=D1gt
January 15, 2018
Real Narrow Effective Exchange Rate * and Net Exports as a share of Gross Domestic Product, 1980-2021
* Indexed to 1980
https://fred.stlouisfed.org/graph/?g=Mc4O
January 30, 2018
Infant Mortality Rate for China, United States, India, Japan and Germany, 1977-2020
https://fred.stlouisfed.org/graph/?g=Mc65
January 30, 2018
Infant Mortality Rate for China, India, Brazil, Mexico and South Africa, 1977-2020
[ What development and the ending of severe poverty can and should mean, and has meant in China. ]
Off topic but pertinent to China’s response to covid 19
https://onlinelibrary.wiley.com/doi/10.1111/resp.14191
Link is to report on a study done in Hong Kong comparing pfizer vaccine to China’s vaccine.
I did not check the statistics, but the conclusion is ‘better t cell response from China’s vaccine than pfizer’. which implies better long term effect on exposure to covid 19.
The relater has been banned from twitter.
https://www.acpjournals.org/doi/10.7326/M21-3509
February 1, 2022
Effectiveness of Inactivated COVID-19 Vaccines Against Illness Caused by the B.1.617.2 (Delta) Variant During an Outbreak in Guangdong, China
A Cohort Study
By Min Kang, Yao Yi, Yan Li, Limei Sun, Aiping Deng, …