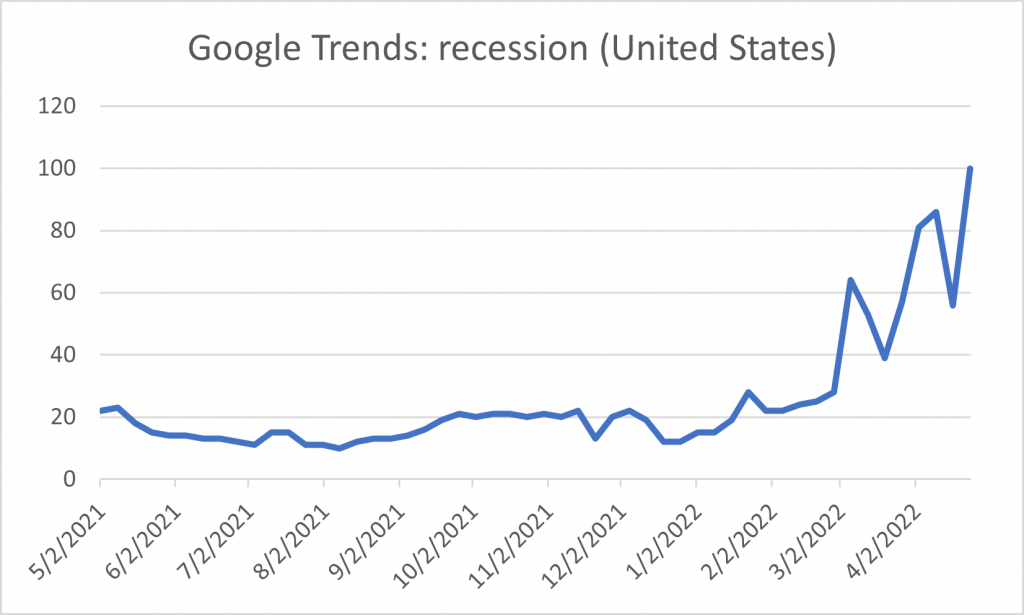
Worries about recession are rising:
Source: Google Trends, accessed 4/30/2022.
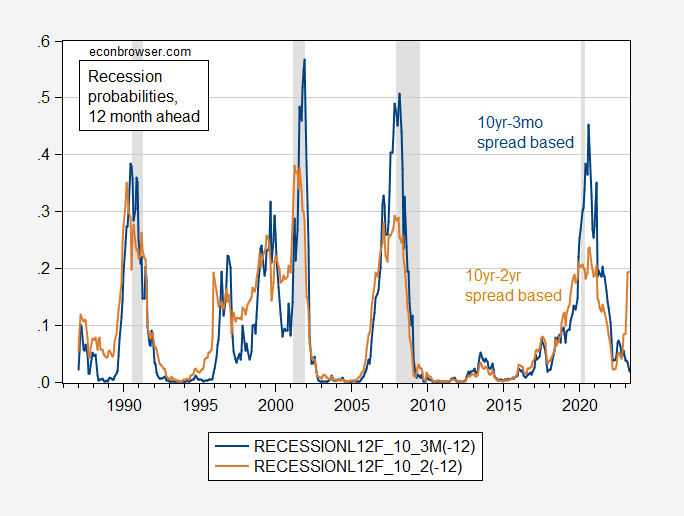
What do we know, using indicators that have some predictive content? Using plain vanilla probit models estimated over the 1986-2022M04 period, 12 month horizon:
Figure 1: Probability of recession for indicated month, using 10yr-3mo spread (blue), using 10yr-2yr spread (brown). NBER defined recession dates peak-to-trough shaded gray. Source: Treasury via FRED, NBER, author’s calculations.
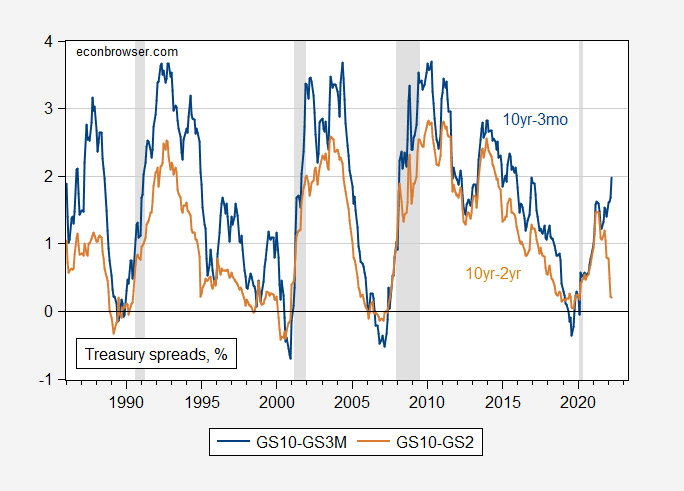
That’s for these spreads.
Figure 2: 10yr-3mo Treasury spread (blue), 10yr-2yr spread (brown), both in %. NBER defined recession dates peak-to-trough shaded gray. Source: Treasury via FRED, NBER.
Using a threshold of 50% seems natural, but that would’ve missed the 1990 recession using the 10yr-3mo. 30% for the 10yr-2yr seems like a reasonable threshold, although one would like to do a formal assessment for false positives and false negatives (i.e., AUROC). Using a 30% threshold says no recession coming. A 20% threshold could be defended, although then one would have to say there was a false positive for 1999, and that in 2020, a recession would’ve occurred even without covid.
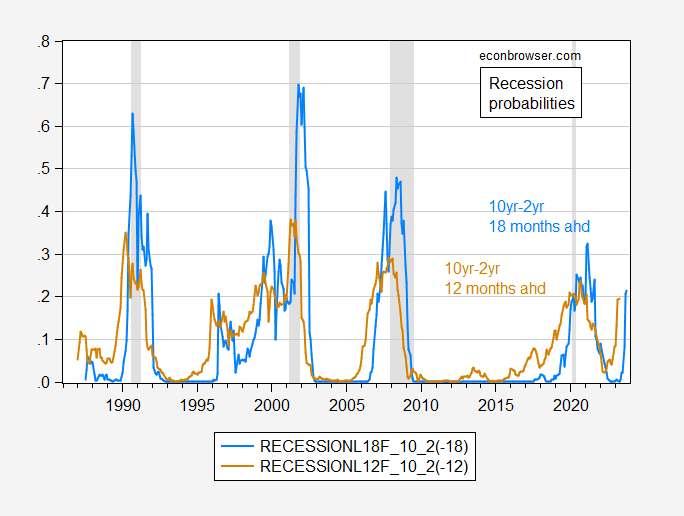
The horizons I’m looking at are 12 month. Deutsche Bank’s prediction was for late 2023. Here’s using the 10yr-2yr 18 months ahead forecast (light blue) compared to 12 months ahead:
Figure 3: Probability of recession for indicated month, using 10yr-2yr spread for 12 months ahead (brown), for 18 months ahead (sky blue). NBER defined recession dates peak-to-trough shaded gray. Source: Treasury via FRED, NBER, author’s calculations.
This spread predicts 21% probability of recession in October 2023.


Inflation here is a bit here but not nearly as bad as what is happening to the black market value of the rouble. Of course, that pales in comparison to what is happening to the value of the Trump President coin!
https://hobade.com/products/golden-donald-trump-presidential-coin?currency=USD&utm_medium=cpc&utm_source=google&utm_campaign=Google%20Shopping
Can we talk ourselves into… or out of… a recession?
https://www.businessinsider.com/robert-shiller-narrative-economics-compelling-stories-disrupt-2020-1?op=1
So, and then we named it the Great Recession. It’s obviously a reference to the Great Depression. And so people became scared and they stopped spending. They didn’t stop spending, but they cut back. You know they think, should we go on a cruise this year? Well, maybe not. You know, I feel a little unsettled. It’s going to cost a lot of money. If people cut back on their consumption enough that we have a recession. And these stories impact the economy in a way that otherwise wouldn’t necessarily be happening. Yeah. A lot of economists seem to think, want to think, that it must be something about technology, or productivity, or maybe what the central bank did. But I think it’s, it’s more generated in people’s minds.
Oh please! This was a recession led by a collapse in residential investment and a massive banking failure. Everyone knows this including and especially Robert Shiller. Come on Bruce – we know you are the dumbest troll ever so relax as you do not have to work so hard proving on a daily basis.
Lucy, for once I agree with you … about 2008. Part of what Shiller is saying is that it is possible to create or exaggerate economic events through mass psychological “contagion”. But, hell, Shiller is just a Nobel laureate, so what does he know? He’s a damn troll.
https://www.npr.org/2019/11/04/776045835/the-talk-market-how-stories-and-psychology-shape-our-economic-lives
I’m waiting for your first Nobel prize in Snarkiness.
Oh, more of this “Lucy” stuff?
So, Mary, quite contrary, do you want to tell us if your lamb’s fleece is white as snow? Or maybe it is covered with blood? We want to know, Mary.
https://fred.stlouisfed.org/graph/?g=mlWp
January 15, 2018
Real Median Weekly Earnings, * 2000-2022
* All full time wage and salary workers
(Percent change)
https://fred.stlouisfed.org/graph/?g=mlWs
January 15, 2018
Real Median Weekly Earnings, 2000-2022
* All full time wage and salary workers
(Indexed to 2000)
https://fred.stlouisfed.org/graph/?g=lMaX
January 15, 2018
Real Median Weekly Earnings for men and women, * 2000-2022
* Full time wage and salary workers
(Indexed to 2000)
https://fred.stlouisfed.org/graph/?g=muKd
January 15, 2018
Real Median Weekly Earnings for White, Black and Hispanic, * 2001-2022
* Full time wage and salary workers
Based on financial America analysis, which is not particularly useful. Much like the Omicron screwed gdp report that will unwind in the 2nd quarter into a bloated number, many distortions will end. By 2026, pandemic era data will have been revised into known history.
When the yield is ambiguous as to the outlook for recession, you look elsewhere to fill in the blanks. I can’t find a recession in the past 55 years which wasn’t preceded by an end to the fall in new jobles claims and then a rise:
https://fred.stlouisfed.org/series/IC4WSA
There’s a lag which I am too lazy to research, but anyone who is curious and not lazy can figure it out for themselves. That lag would tell us how long we might feel confident that we have before a recession might begin, barring a new shock.
In all but one case since 1959, housing starts have turned lower well before recession began, and they are rising now. Homes under construction have turned lower in all bu two cases before recession began, and are rising now. The extremely rapid rise in mortgage rates and the overhang of homes under construction look to me like dangerous signs, but there is no recession warning in the residential construction data.
I won’t go near consumption data. It has been so volatile that I can’t see how to use it for crystal ball gazing.
Financial stress? That’s one area in which Fed tihtening could lead to trouble, but broad measures are quite untroubling now:
https://fred.stlouisfed.org/series/STLFSI3
For now, the chatter about recession seems to be driven by conventional wisdom about the Fed causing recession, which is conventional for a reason, and the related problems of inflation and war. I can’t find any current sign of trouble on the real side of the domestic economy. Lags being what hey are, that means we have pretty clear sailing into year-end, barring shocks.
I’m with you on this. Fed hawkishness seems built in now. Things could be so much worse.
Of course if Xi insists on continuing his massive overreaction to Omicron, that could really bring back the worst of supply-induced inflation.
Professor Chinn,
If I am interpreting the EViews “Expectation-Prediction Evaluation for Binary Specification” I notice that if one uses a value of 0.15, an 18-month probit forecasting model using GS10 and GS2 seems to have a 77% chance of forecasting no recession when there is no recession and about 73% chance of predicting a recession when there was a recession.
It is always appreciated when you share your EViews output model and interpretation of the Expectation-Prediction Evaluation. I certainly get “rusty” when not looking at probit models for several months or a year.
Thanks
Professor Chinn,
Using DGS10 and DGS2, EOM data, I just updated my probit model and get the following output.
My model shows only about an 11% probability of recession within 18 months, so tutoring needed.
Recession (+12) = c + gap, using recession indicator USRECM.
C=-0.628
GAP = -1.20
McFadden R-squared = 0.30
Obs = 531: 1976m01 to 2020m08
Expectation evaluation changed a bit.
At 0.15 limit,
probability of recession 78% correct when predicting no recession, and
probability of recession 88% correct when predicting recession.
Should say Recession(+18).
Thank you for this. But I would say the out-of-sampleness of current times may be greatly elevated. That of course could push “true” probabilities of recession in either direction!
Professor Chinn,
I notice that the GS10-GS2 gap for April should be 0.22, not 0.50(gremlin value). This change increased my probability to 19% in October 2023 (still different, but close). However, my peak probabilities are not as high as yours for past recessions. For example, for 1990 I am showing a peak probability of about 46% compared to your 60+%. I show a peak of about 47% for 2000 compared to your 70% and for 2009, I show 33% versus your 48+%. Oh Well.
I also notice that if I use the model: Recession = c gap (-18), I can have EViews forecast the probabilities, rather than use EXCEL to make the probability calculations.