Look around at enough indicators (say vehicle miles traveled) and you might think so. A follow up to this post. Let’s look at what conventional and high frequency indicators say.
Here are key indicators tracked by the NBER’s Business Cycle Dating Committee look like:
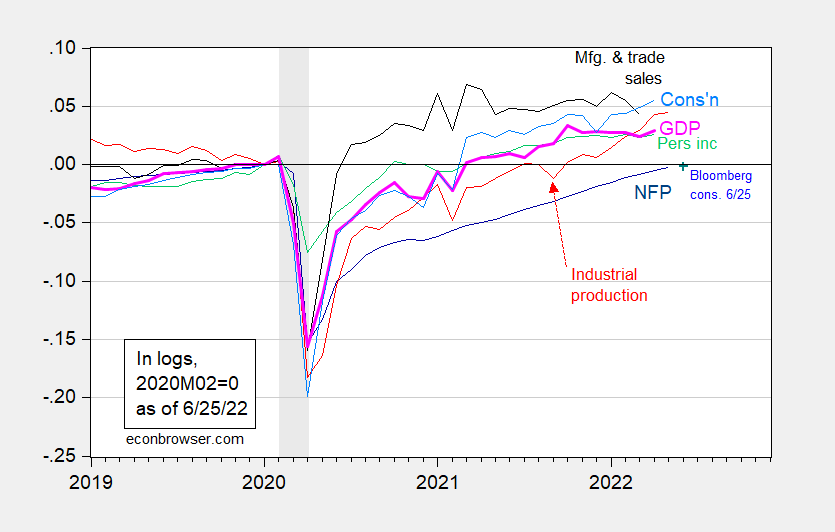
Figure 1: Nonfarm payroll employment (dark blue), Bloomberg consensus for NFP as of 6/25 (ble +), industrial production (red), personal income excluding transfers in Ch.2012$ (green), manufacturing and trade sales in Ch.2012$ (black), consumption in Ch.2012$ (light blue), and monthly GDP in Ch.2012$ (pink), all log normalized to 2020M02=0. NBER defined recession dates, peak-to-trough, shaded gray. Source: BLS, Federal Reserve, BEA, via FRED, IHS Markit (nee Macroeconomic Advisers) (6/1/2022 release), NBER, and author’s calculations.
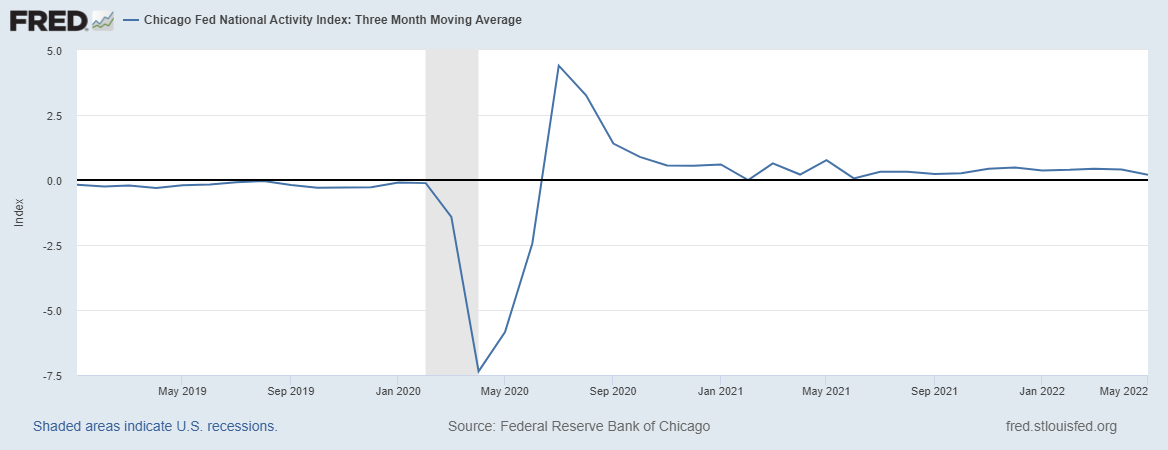
The Chicago Fed’s National Activity Index (CFNAI) is another indicator. Here’s the CFNAI-3MA (3 month moving average):
From the Chicago Fed website describing the index:
The CFNAI is a weighted average of 85 existing monthly indicators of national economic activity. It is constructed to have an average value of zero and a standard deviation of one. Since economic activity tends toward trend growth rate over time, a positive index reading corresponds to growth above trend and a negative index reading corresponds to growth below trend.
The 85 economic indicators that are included in the CFNAI are drawn from four broad categories of data: production and income; employment, unemployment, and hours; personal consumption and housing; and sales, orders, and inventories. Each of these data series measures some aspect of overall macroeconomic activity. The derived index provides a single summary measure of a factor common to these national economic data.
The Chicago Fed notes:
Following a period of economic expansion, an increasing likelihood of a recession has historically been associated with a CFNAI-MA3 value below –0.70. Conversely, following a period of economic contraction, an increasing likelihood of an expansion has historically been associated with a CFNAI-MA3 value above –0.70 and a significant likelihood of an expansion has historically been associated with a CFNAI-MA3 value above +0.20.
The CFNAI-3MA value for May was +0.20.
Admittedly, these are backwards looking indicators, referring to May conditions (at best).
What about indicators at weekly frequency? Here’s the Lewis-Mertens-Stock measure, based on data through June 18th.
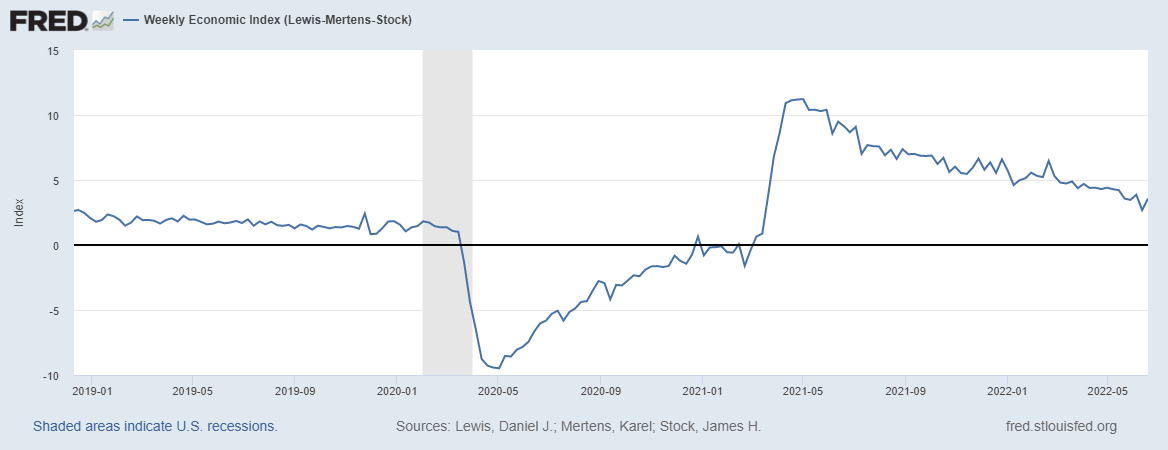
Source: FRED, accessed 6/25/2022.
Here’s the description of this index:
The WEI is an index of real economic activity using timely and relevant high-frequency data. It represents the common component of ten different daily and weekly series covering consumer behavior, the labor market, and production. The WEI is scaled to the four-quarter GDP growth rate; for example, if the WEI reads -2 percent and the current level of the WEI persists for an entire quarter, one would expect, on average, GDP that quarter to be 2 percent lower than a year previously.
The WEI is a composite of 10 weekly economic indicators: Redbook same-store sales, Rasmussen Consumer Index, new claims for unemployment insurance, continued claims for unemployment insurance, adjusted income/employment tax withholdings (from Booth Financial Consulting), railroad traffic originated (from the Association of American Railroads), the American Staffing Association Staffing Index, steel production, wholesale sales of gasoline, diesel, and jet fuel, and weekly average US electricity load (with remaining data supplied by Haver Analytics). All series are represented as year-over-year percentage changes. These series are combined into a single index of weekly economic activity.
For additional details, including an analysis of the performance of the model, see Lewis, Mertens, and Stock (2020), “U.S. Economic Activity during the Early Weeks of the SARS-Cov-2 Outbreak.”
Here’s the OECD Weekly Tracker for the US, applying to data through June 12th:
![]()
Source: OECD, accessed 6/25/2022.
Part of the description:
Nowcasting with Google Trends
Signals about multiple facets of the economy from Google Trends are extracted and aggregated using machine learning in order to infer a timely picture of the macro economy. The algorithm extracts and compiles information about consumption (e.g. from searches for “vehicles”, “households appliances”), labour markets (e.g. “unemployment benefits”), housing (e.g. “real estate agency”, “mortgage”), business services (e.g. “venture capital”, “bankruptcy”), industrial activity (e.g. “maritime transport”, “agricultural equipment”), trade (e.g., “exports”, “freight”) as well as economic sentiment (e.g. “recession”) and poverty (e.g. “food bank”). Using many variables reduces the risk related to structural breaks in specific series, which was highlighted by the failure of the “Google Flu” experiment.
The Weekly Tracker uses a two-step model to nowcast weekly GDP growth based on Google Trends. First, a quarterly model of GDP growth is estimated based on Google Trends search intensities at a quarterly frequency. Second, the relationship between Google Trends and activity, using the same elasticities estimated from the quarterly model, is applied to the weekly Google Trends series to yield a weekly tracker. The OECD Weekly Tracker can thus be interpreted as an estimate of the year on year growth rate of “weekly GDP” (the same week compared to the previous year).
What about other big data indices? Here’s the Brave-Butters-Kelley big data (500 time series) coincident index through April (May index out at month’s end):
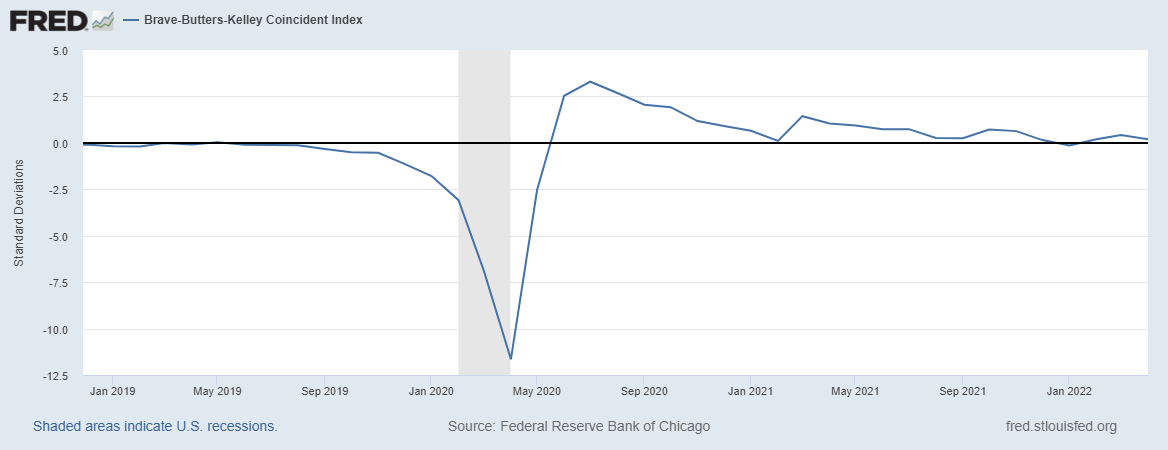
Source: FRED, accessed 6/25/2022.
This index is described thusly:
The Brave-Butters-Kelley Indexes (BBKI) are a research project of the Federal Reserve Bank of Chicago. The BBK Coincident and Leading Indexes and Monthly GDP Growth for the U.S. are constructed from a collapsed dynamic factor analysis of a panel of 500 monthly measures of real economic activity and quarterly real GDP growth.
The BBK Coincident Index is the sum of the leading and lagging subcomponents of the cycle measured in standard deviation units from trend real GDP growth.
As of April, the index was above trend, so not negative growth.
It would be nice to have more recent big data observations. Here is the Google weekly mobility indicator:
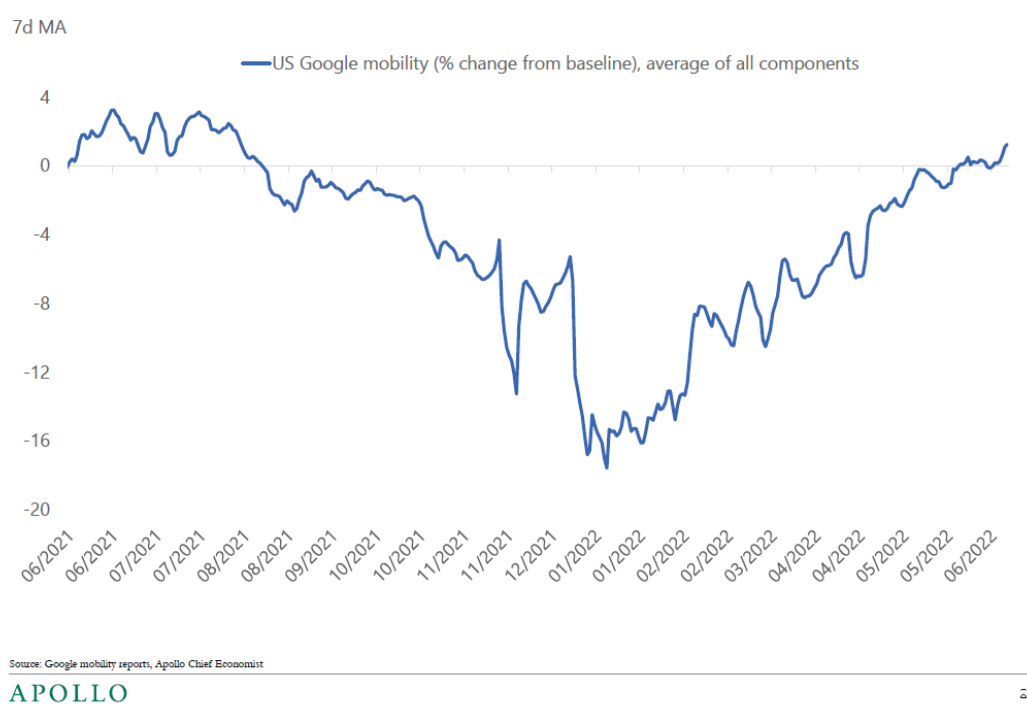
Source: Slok, Agarwal, Shah, Slowdown Watch, Apollo (22 June 2022), not online.
As for whether the VMT slowdown signals a recession (as suggested by Mr. Kopits), well, it’s hard to say. Here’s a picture that suggests gasoline prices might have something to do with the decrease in VMT (keeping in mind inflation is not the same as recession).
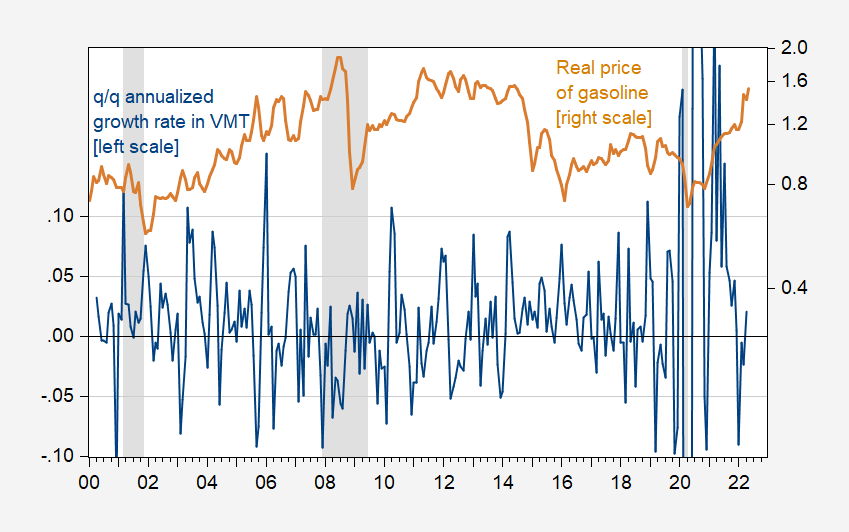
Figure 2: Quarter-on-quarter annualized growth rate of vehicle miles traveled (VMT) (blue, left scale), and real price of gasoline (tan, right log scale). Gasoline price deflated by core CPI. NBER defined peak-to-trough recession dates shaded gray. Source: DoT, EIA, BLS via FRED, NBER, and author’s calculations.
I estimate the short run price elasticity of VMT at about -0.19 (using a first log differences specification for the sample period 2000-22, including consumption as an activity variable, and a covid variable, with the price coefficient significantly different from zero at the 95% level).
All these data suggests to me that as of May, we were not in recession. And as of June, we were also not likely to be in recession, although the fact that data revisions are a reality makes me a little cautious. Whether we will be in a recession in the next year, well, there the indicators are more worrying.
https://news.cgtn.com/news/2022-06-25/IMF-lowers-2022-U-S-growth-forecast-to-2-9–1b8UuwQN7nq/index.html
June 25, 2022
IMF lowers 2022 U.S. growth forecast to 2.9%, sees ‘narrowing path’ to avoid recession
The International Monetary Fund (IMF) on Friday sharply lowered its growth forecast * for the United States, saying it expected U.S. gross domestic product (GDP) growth of 2.9 percent in 2022, down from a previous estimate of 3.7 percent in April.
“Based on the policy path outlined at the June FOMC (Federal Open Market Committee) meeting, and an expected reduction in the fiscal deficit, we expected the U.S. economy will slow,” IMF Managing Director Kristalina Georgieva said at a virtual press conference on the annual Article IV consultation to review the U.S. economy.
The IMF chief noted there is “a narrowing path” to avoiding a U.S. recession, highlighting “significant downside risks” this year and especially next year.
In its annual assessment of U.S. economic policy, the IMF forecast 2023 growth of 1.7 percent (against 2.3 percent), and 2024 growth of 0.8 percent.
With inflation well above the Federal Reserve’s longer-run goal and an extremely tight labor market, the Fed raised the target range for the federal funds rate at each of the past three meetings. Last week, the Fed raised rates by 75 basis points, marking the sharpest rate hike since 1994.
Georgieva said the IMF believes the path for the policy rate that the Fed has signaled, to quickly get the federal funds rate to 3.5 to 4 percent, is the correct policy to bring down inflation, but there may be “some pain” for consumers.
The IMF chief also said that the IMF is mindful of the risks to the U.S. economy. “We are actually seeing very significant downside risks this year and especially next year,” she said….
* https://www.imf.org/en/News/Articles/2022/06/24/mcs062422-united-states-of-america-concluding-statement-of-the-2022-article-iv-mission
https://news.cgtn.com/news/2022-06-25/Chinese-mainland-records-53-new-confirmed-COVID-19-cases-1b94dRyMn5K/index.html
June 25, 2022
Chinese mainland records 53 new confirmed COVID-19 cases
The Chinese mainland recorded 53 confirmed COVID-19 cases on Friday, with 7 linked to local transmissions and 46 from overseas, data from the National Health Commission showed on Saturday.
A total of 98 asymptomatic cases were also recorded on Friday, and 1,082 asymptomatic patients remain under medical observation.
The cumulative number of confirmed cases on the Chinese mainland is 225,487, with the death toll from COVID-19 standing at 5,226.
Chinese mainland new locally transmitted cases
https://news.cgtn.com/news/2022-06-25/Chinese-mainland-records-53-new-confirmed-COVID-19-cases-1b94dRyMn5K/img/0105b20b19d148769809be76d1d2f09f/0105b20b19d148769809be76d1d2f09f.jpeg
Chinese mainland new imported cases
https://news.cgtn.com/news/2022-06-25/Chinese-mainland-records-53-new-confirmed-COVID-19-cases-1b94dRyMn5K/img/223556cfc0c44c65a5e0d37d79a016c2/223556cfc0c44c65a5e0d37d79a016c2.jpeg
Chinese mainland new asymptomatic cases
https://news.cgtn.com/news/2022-06-25/Chinese-mainland-records-53-new-confirmed-COVID-19-cases-1b94dRyMn5K/img/589f5185d3154b2888c683a48a8aa2cd/589f5185d3154b2888c683a48a8aa2cd.jpeg
https://www.worldometers.info/coronavirus/
June 24, 2022
Coronavirus
United States
Cases ( 88,708,703)
Deaths ( 1,040,641)
Deaths per million ( 3,108)
China
Cases ( 225,434)
Deaths ( 5,226)
Deaths per million ( 4)
you are at full employment so you cannot be in a recession
We had roaring growth. Now we have more tepid growth. It’s still growth. The panic-o-meter when people talk about recession or not recession isn’t reliable this time.
Torsten Slok is always worth a thorough read. We’ve talked about how if you are very selective there is good stuff to be found on ZH blog. Before Mr. Slok’s move to Apollo, Mr. Slok’s rundowns of the market republished on ZH were a very good example of that. Miss reading him a lot. Kinda gives you an idea of how empty it might feel if Menzie ever discontinues the blog.