GDPNow at -1.6%, St. Louis Fed News index at +4%, IHS-Markit at -2.0%, and Goldman Sachs at 0.5%. Bloomberg consensus at +0.4% (all q/q SAAR).
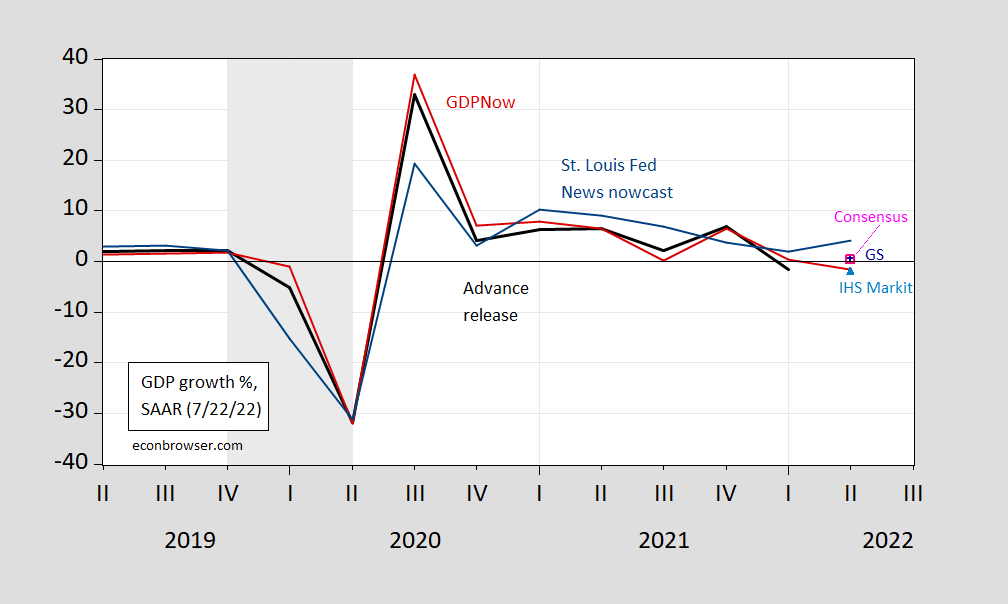
Figure 1: Actual advance GDP growth rate (black), Atlanta Fed GDPNow (red line), St. Louis Fed News index (teal line), IHS Markit (sky blue triangle), Goldman Sachs (blue +), Bloomberg consensus (pink open square), all in %, NBER defined peak-to-trough recession dates shaded gray. SAAR. Source: BEA via ALFRED, Atlanta Fed, St. Louis Fed via FRED, IHS-Markit, Goldman Sachs, Bloomberg, and NBER.
Over this three year sample (clearly an unrepresentative one, given the pandemic’s impact), GDPNow is upwardly biased, while the St. Louis Fed news based nowcast is downwardly biased, by 0.8 and 0.9 ppts respectively. On the other hand, the RMSFE of the former is about 2 ppts, that of the latter 5.9 ppts. If you drop 2020Q1-Q3, then GDPNow is less downwardly biased than the St. Louis index, while the RMSFE is smaller (1.5 vs. 2.5 ppts).
That being said, recall these nowcasts are aimed at estimating the advance release. The 7/28 release for 2022Q2 is an advance release, with many components of GDP estimated. The estimates will be revised, sometimes significantly, particularly in the annual benchmark (this year taking place in September instead of July), and in the five year comprehensive revisions (see discussion in this post). A positive reading can then eventually change to negative, and vice versa.
This dude had a lot of interesting statements/data in his Twitter feed/thread today. If I am being completely self-centered/selfish (not unheard of behavior from me), I would say not all of what Williamson stated was what I really wanted to hear, because it put a damper on my positive 2nd quarter GDP prediction. I am not “back-pedaling” or reneging. I am sticking to my prediction, but this doesn’t make me feel any better about my prediction certainly.
https://twitter.com/WilliamsonChris/status/1550505062593609729?cxt=HHwWgoCy5faIwIQrAAAA
Really you might as well read his entire thread for the 22nd of July.
St. Louis Fed News index at +4%. Huh – this is never mentioned by recession is now Princeton Steve. Oh that’s right – the folks at the St. Louis FED do not know the data the way he does. n
Is Princeton Steve the economic advisor to Governor DeSantis:
https://news.yahoo.com/ron-desantis-convinced-biden-stimulus-183814028.html
“You cannot print trillions and trillions of dollars and expect there not to be some effect on the back end,” Florida Gov. Ron DeSantis said at a news conference in late March. “Even Keynesian economics would say if you spend and print, spend and print, that is going to drive up the cost of everything, and so that’s what we’re seeing,” he added, referring to the legendary economist John Maynard Keynes, who, besides literally writing the book on stimulus spending, said over 100 years ago that “there is no subtler, no surer means of overturning the existing basis of society than to debauch the currency.” But also, as DeSantis noted, the 40-year-high inflation that Floridians are experiencing in 2022 is really a problem.
Enough of this bombast. Where would you cut stimulus governor?
Last week, DeSantis announced a new strategy “to offset the costs of rising inflation.” Especially on the brink of a new school year, he said, “the State of Florida is giving you $450 for each child in your care,” DeSantis wrote in a letter accompanying the checks. “This one-time payment can be used for anything from buying diapers to fueling up at the pump.” Where does this money come from? In part, the very same stimulus DeSantis derided for its supposed inflationary impact. The governor will use $35.5 million that Florida received from federal COVID-19 relief funds to mail checks to nearly 59,000 foster and adoptive families in the state, First Lady Casey DeSantis announced last week.
Adding fuel to your fire? OK!
“You cannot print trillions and trillions of dollars and expect there not to be some effect on the back end,” Florida Gov. Ron DeSantis said
Where did he get this stuff? I don’t see where the Fed printed “trillions and trillions of dollars.” And if he’s talking about “trillions and trillions” of fiscal spending, then he might want to reflect upon the fact that all that’s spread out over eight to ten years. Who is stupid enough to treat this clown seriously? Oh wait…CoRev. He’ll buy anything that a GOP nutjob says.
He got this stuff from Dr. Evil
https://www.bing.com/videos/search?q=dr+evil+billions&docid=608042905664369204&mid=4015FCC1916D67C8CD324015FCC1916D67C8CD32&view=detail&FORM=VIRE
Fodder for the idiots. And I think your question, 2slugbaits, was a rhetorical type question and you know this already. DeSantis knows that’s a nonsense number, but is also fully aware of his audience’s education
https://www.msn.com/en-us/news/politics/utter-depravity-george-conway-piles-on-pathetic-trump-after-latest-jan-6-revelations/ar-AAZRcqo?ocid=msedgdhp&pc=U531&cvid=70502c5cd9ba4468a08659d4f2875c2d
Appearing on CNN’s “New Day” after the latest House Select Committee hearing on the Jan 6th riot incited by former President Donald Trump, conservative attorney George Conway called out the former president for his “utter depravity” for standing by for three hours while the insurrection raged. Speaking with hosts John Berman and Kaitlan Collins, the husband of Trump advisor Kellyanne Conway claimed the former president is unable to get past his “pathetic narcissistic” need to be the center of attention, which is why he let the riot go on unabated.
I bet Kelly Anne is angry at hubbie for making his marriage vows to her to put King Donald I ahead of the nation.
Once again, a poorly scaled graph. Why +/-40% of GDP growth? It entirely washes out the distinctions you’re trying to make among the various forecasters for Q2.
Interestingly, it does show that BEA advance Q2 has tended to come in below the Atlanta Fed GDPNow forecast. The deterioration of IHS to -2.0% suggests it will this time, too.
Steven Kopits: There were a bunch of summary stats at the end of the post. Do you ever do anything besides eyeball the data?
And why did I plot with the scale I did? Because …. there was a 40% change in GDP (SAAR) in Q2, Q3…and I wanted to show the different type of bias during the wild gyrations during the onset of the pandemic (and what advance release growth estimates were).
I’ve added a detail restricting the scale to -10%,+15%. Do your conclusions stay the same. Mine do.
Producer v Consumer Perspective.
In the producer perspective, you’re trying to convince people that you’re smart or expert.
In the consumer perspective, you’re assuming people have limited time and possibly sophistication to assess words, data and visuals. You’re trying to make a point in a competitive marketplace of ideas; you’re struggling for share of mind. So you try to make things easier for the user of the data.
It’s a difference between academics and private sector experts and consultants. Most academic economics papers are terribly written for this reason.
Well you produce garbage and your consumers are morons. You may be in the private sector but you are no expert. And your writing SUCKS.
Eyeballing it, in the last eight quarters:
Advance GDP came in above GDPNow once; tied 2 two times, and came in below the GDPNow 4 times. Suggests to me that advance GDP will come in at or below GDPNow, probably in the -1.6% to -2.0% range.
So you think a 2 year framework is informative? God you do have malleable views. What kind of moron would ever hire you as a consultant?
Again, this is above your pay grade, pgl, but generally we might expect forecasting accuracy should improve over time. That is, the associated forecasts tend to improve (or in some cases, get worse) over time as the forecasting team identifies and adjusts for previous errors. Therefore, we might be most interested in the recent past. I chose two years, which is actually a pretty decent amount of time to upgrade forecasting skill.
Nevertheless, you are correct that the time chosen is to an extent arbitrary. Is three years the right time frame? Two? The last four quarters? It is just these sorts of issues which have left me disappointed with the field of statistics. Statistics is taught, implicitly I think, in a way that assumes it can be used mechanically. It really can’t. You have to apply judgment in matters like, for example, the appropriate time horizon in a given situation. That implies some understanding of the underlying processes, ie, fundamentals research. Thus, the notion that statistics can be used purely as technical (rather that fundamental) analysis, generally proves untrue in my experience. This is the point I made, for example, with the Harvard PR study. The authors published excess deaths complete with CIs, without so much as having cross-checked against the actually mortality data. The CIs only apply to the data put into the stats package. If that’s garbage, then the CIs are also garbage in terms of providing meaningful guidance. So the moral of the story: You can’t properly use statistics in a purely mechanical fashion.
In any event, I thought an analysis of the last two years recent enough to provide good guidance and with a sufficient number of data points — eight — to provide some useful insight. But as you point out, maybe there is a better approach. To form an opinion on the matter, I would have to do more research on the Atlanta Fed’s forecasting record over time, and perhaps research changes to methodology and staff in the interim. Now that’s above my pay grade in this case.
“Steven Kopits
July 24, 2022 at 8:39 am
Again, this is above your pay grade, pgl, but generally we might expect forecasting accuracy should improve over time.”
An incompetent like you should shy away from questioning anyone’s pay grade. Any who pays who has wasted their money. But yea – if one were competent, then forecasting accuracy might improve over time if what is being forecasted does not have a sea change in what drives its volatility. But your forecasting accuracy seems to get worse over time. Like in your forecast of 39% inflation using that discredited QTM approach.
Dude – you do not have the right to shine even my shoes so your childish insults are just laughable.
“You have to apply judgment in matters like, for example, the appropriate time horizon in a given situation. That implies some understanding of the underlying processes, ie, fundamentals research.”
That is really a laugh. You make it up as you do but then you are mentally incapable of understanding fundamentals. We have asked you before to stop using words you do not even remotely understand.
“Over this three year sample”
I am surprised the old arrogant one (my new name for Know Nothing Princeton Steve) did not hammer you for having only a 3-year sample. Of course this confused but still arrogant one was basically saying start the graph in 2021QI. He does have malleable views.
No one had trouble reading this graph except arrogant old Princeton Steve. BTW – I guess that is why you missed the St. Lousi FED forecast. DUH!
When the facts are against you, pound on the law. When the law is against you, pound in the law. When both are against you, pound on the table.
Stevie regularly criticizes Menzie’s presentation, pounding on style when pounding on substance just won’t work. It’s small minded and, apparently, idiosyncratic; nobody but Stevie and Non Trampis complain about presentation.
Can you imagine Stevie as an ambulance chasing lawyer? He would make Cellini and Barnes look respectable by comparison.
This post appears to be mostly dealing with bias of the various forecasting sources. It does not show bias, it shows level.
In term of level, the matter at hand is Q2 2022 forecasts. By choosing a wide band y-axis, the differences in the Q2 forecasts are hard to pick off the graph. For example, the IHS forecast of -2.0% is almost indistinguishable from the Atlanta Fed’s -1.6%. I could not tell without reading the text, and if I have to read the text, then the graph is not serving its purpose.
Further, if the post is about forecasting bias, then at least one graph should deal with forecasting bias, that is, the difference between the respective forecasts and the advance estimate. Menzie hasn’t made a graph showing that, however. So the post is missing a graph which illustrates its main point.
I stand by my statement.
Steven Kopits: Gee, why did I bother to tabulate the mean error for you in the post? Please refer to this post.
I would love to see the mean error for Steve’s allegedly accurate forecasts. Oh wait – he does not even know what we are talking about. Never mind.
“Over this three year sample (clearly an unrepresentative one, given the pandemic’s impact), GDPNow is upwardly biased, while the St. Louis Fed news based nowcast is downwardly biased, by 0.8 and 0.9 ppts respectively. On the other hand, the RMSFE of the former is about 2 ppts, that of the latter 5.9 ppts. If you drop 2020Q1-Q3, then GDPNow is less downwardly biased than the St. Louis index, while the RMSFE is smaller (1.5 vs. 2.5 ppts).”
Turgid. But okay, then finish the thought:
“Therefore, if we are to make an estimate using the Atlanta Fed’s model, based on the sample used and the resulting RMSFE, we might expect the BEA’s estimate to be _____% for Q2 GDP growth, given the Atlanta Fed’s most recent forecast of -1.6% for the quarter just ended.”
What’s the number?
Steven Kopits: Using basic math, using the mean error, we expect the actual number to -0.8 based on Atlanta Fed, while the corresponding number for St. Louis is 4.9. Plus/minus 1 RMSFE intervals clearly encompass zero for both.
We know your “bias” – whatever gets you an audience with the MAGA crowd.
Josh Hawley takes tough until faced with actual danger and then he runs like a little scared kitty kat,
https://www.msn.com/en-us/news/politics/josh-hawley-responds-to-video-turned-meme-of-him-running-away-from-a-pro-trump-mob-on-january-6-saying-he-won-t-run-from-feud-with-liberals/ar-AAZTq1s?ocid=msedgdhp&pc=U531&cvid=fdc3ead1e3da408fb8f333c663647367
https://news.cgtn.com/news/2022-07-23/Chinese-mainland-records-164-new-confirmed-COVID-19-cases-1bTx8PBDiz6/index.html
July 23, 2022
Chinese mainland records 164 new confirmed COVID-19 cases
The Chinese mainland recorded 164 confirmed COVID-19 cases on Friday, with 128 attributed to local transmissions and 36 from overseas, data from the National Health Commission showed on Saturday.
A total of 653 asymptomatic cases were also recorded on Friday, and 5,783 asymptomatic patients remain under medical observation.
The cumulative number of confirmed cases on the Chinese mainland is 228,519, with the death toll from COVID-19 standing at 5,226.
Chinese mainland new locally transmitted cases
https://news.cgtn.com/news/2022-07-23/Chinese-mainland-records-164-new-confirmed-COVID-19-cases-1bTx8PBDiz6/img/7fe6462b77c446228dec05786ec7894f/7fe6462b77c446228dec05786ec7894f.jpeg
Chinese mainland new imported cases
https://news.cgtn.com/news/2022-07-23/Chinese-mainland-records-164-new-confirmed-COVID-19-cases-1bTx8PBDiz6/img/48b8d5c8d9ef4c3f957b8a0515095a34/48b8d5c8d9ef4c3f957b8a0515095a34.jpeg
Chinese mainland new asymptomatic cases
https://news.cgtn.com/news/2022-07-23/Chinese-mainland-records-164-new-confirmed-COVID-19-cases-1bTx8PBDiz6/img/b66b0f9ef7cd42d58c521777d857cc25/b66b0f9ef7cd42d58c521777d857cc25.jpeg
https://www.worldometers.info/coronavirus/
July 22, 2022
Coronavirus
United States
Cases ( 91,145,839)
Deaths ( 1,051,912)
Deaths per million ( 3,165)
China
Cases ( 228,355)
Deaths ( 5,226)
Deaths per million ( 4)
Paul Krugman has written about what has become the chronic economic weakness of Italy and remarked on a chronic debt problem. Italian government debt as a percent of GDP has been above 100% since 1990 and above 130% and rising still since 2013. What Krugman did not write on, but I consider critically important, is the related-resultant Italian failure to productively invest since the 1990s:
https://www.nytimes.com/2022/07/22/opinion/italy-draghi-ecb.html
July 22, 2022
Wonking Out: What’s the matter with Italy?
By Paul Krugman
https://fred.stlouisfed.org/graph/?g=NtrJ
November 1, 2014
Total Factor Productivity at Constant National Prices for United States, United Kingdom, Germany, France and Italy, 1992-2019
(Indexed to 2019)
https://fred.stlouisfed.org/graph/?g=Nts0
November 1, 2014
Total Factor Productivity at Constant National Prices for United States, United Kingdom, Germany, France and Italy, 1992-2019
(Indexed to 1992)
Paul Krugman wrote an interesting article in the NYTimes.
https://www.nytimes.com/2022/07/21/opinion/paul-krugman-inflation.html
As the old adage goes: Nothing is ever as simple as it first seems. Pesky human behavior just gets in the way of good theory.
Paul Krugman is getting a lot of credit for admitting he may have been wrong about something. You are wrong about everything but you never admit it. I would suggest you act a lot more like Krugman but we all know you are incapable of being honest.