CFNAI edition – from Chicago Fed today:
Index Points to a Pickup in Economic Growth in July
The Chicago Fed National Activity Index (CFNAI) was +0.27 in July, up from –0.25 in June.
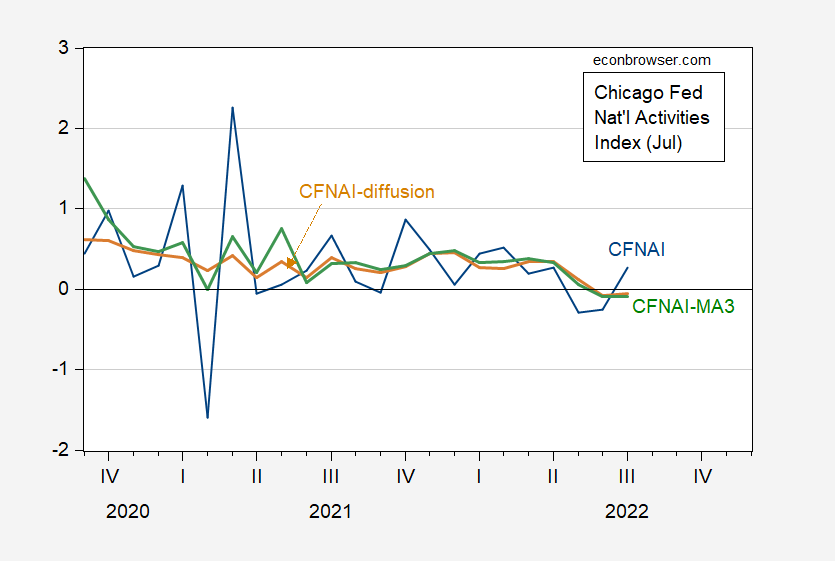
Figure 1: CFNAI, in standard deviation units (blue), CFNAI 3 month moving average (green), and CFNAI diffusion (tan). CFNAI normalized at 0 for trend growth rate. Source: Chicago Fed, July release.
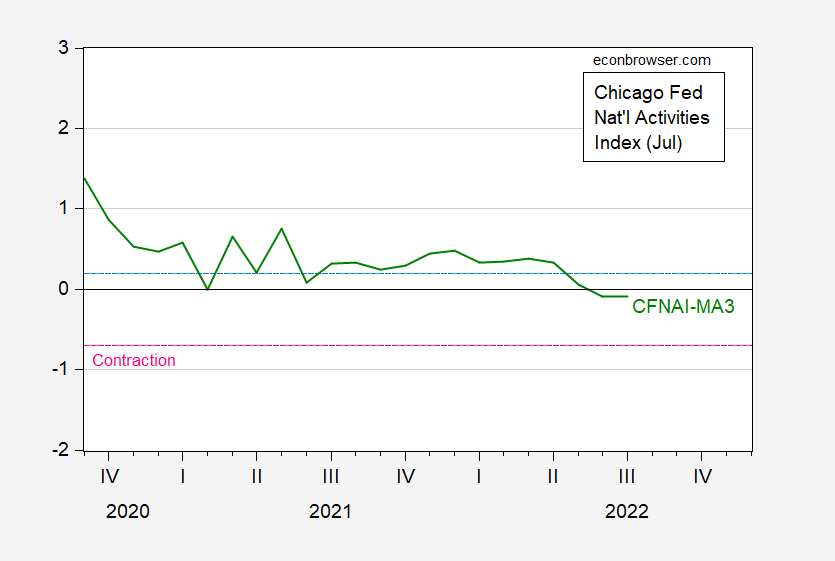
Figure 2: CFNAI 3 month moving average (green). Pink dashed line indicates level at which reading after period of expansion indicates contraction. Source: Chicago Fed, July release.
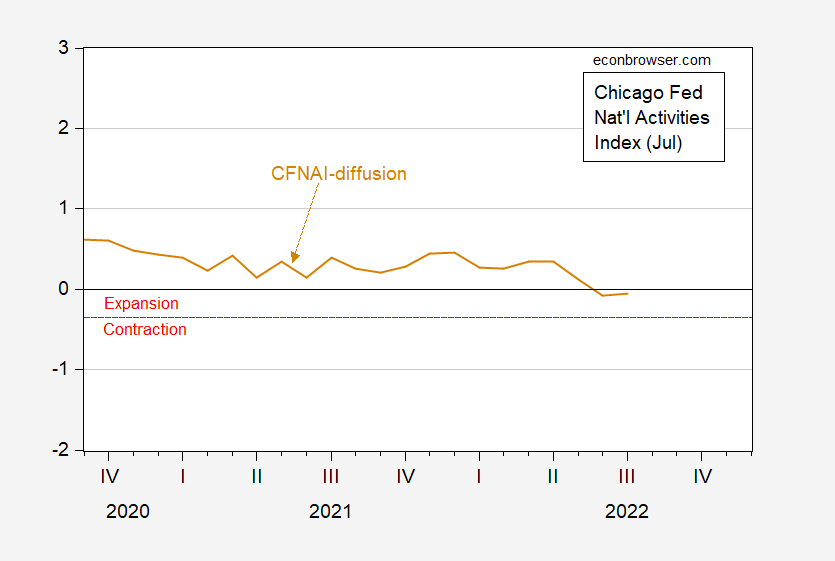
Figure 3: CFNAI diffusion (tan). Below red dashed line indicates contraction, above indicates expansion. Source: Chicago Fed, July release.
The three month trailing moving average is slightly under zero, indicating growth slightly below historical trend growth. It is far above the level consistent with contraction (i.e., recession). The CFNAI-MA3 tracks pretty well with NBER defined recessions (see the Chicago Fed website for the requisite graphs), except for the 2007 recession, where the CFNAI-MA3 passes the threshold in April 2008 (rather than Jan 2008, the month after the NBER defined peak).
The diffusion index is also above the level consistent with contraction, after a period of expansion. This measure also works pretty well, with the exception of signaling a recession start in December 2000 rather than the NBER contraction starting in April 2001.
Hence, the CFNAI, a weighted average of 85 indicators of economic activity (described here), suggests we are not as of July 2022, nor have we within the past year, been in a recession.
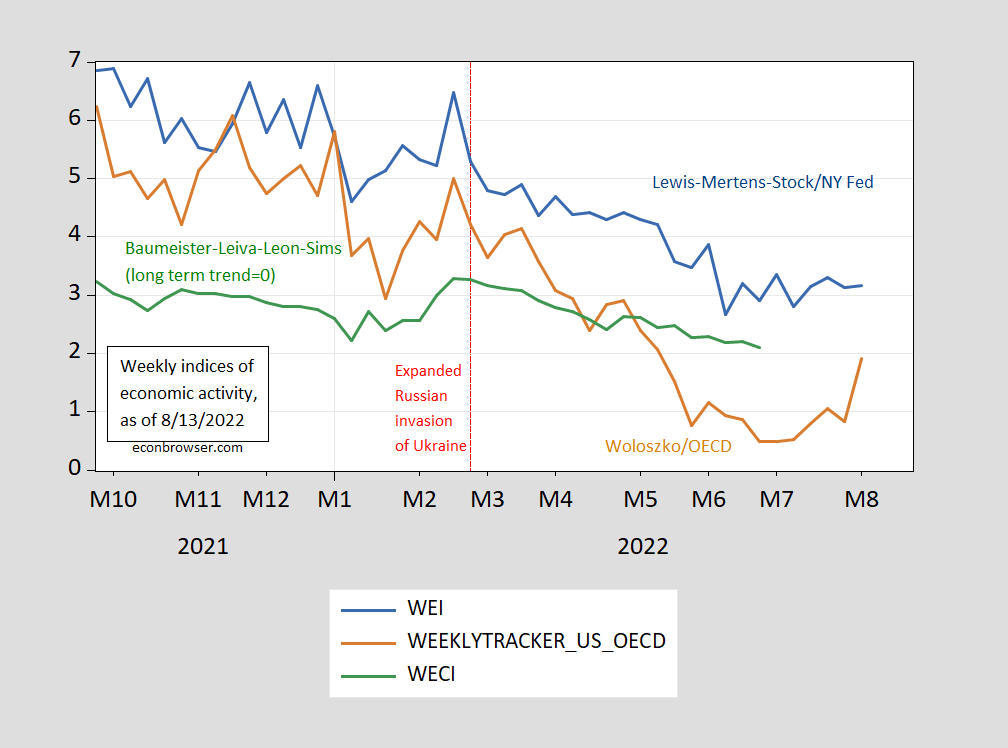
I might note that for weekly data through August 13th, it’s not looking good for the recession call either, as noted in this post.
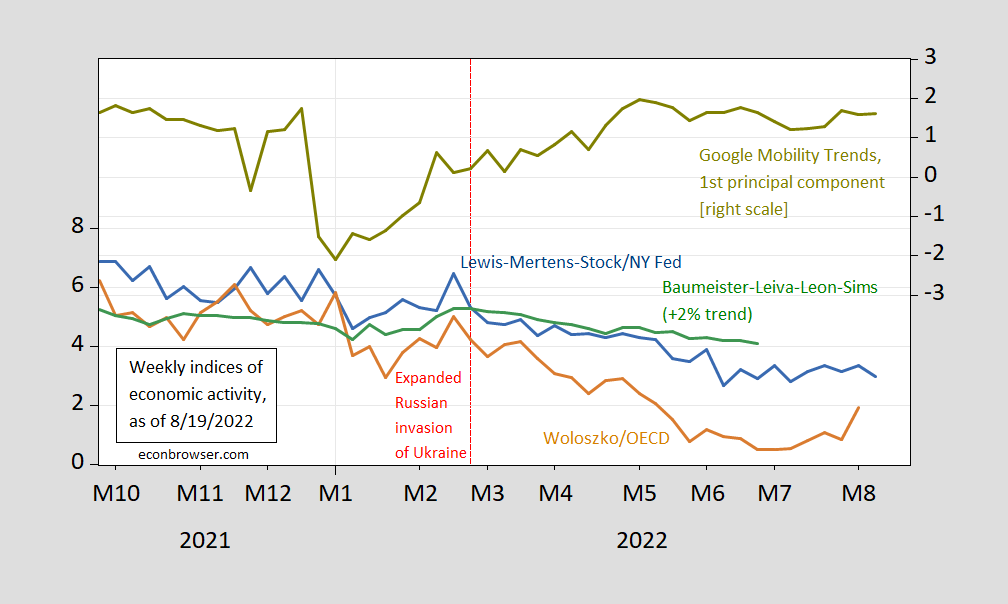
Figure 4: Lewis-Mertens-Stock Weekly Economic Index (blue, left scale), OECD Weekly Tracker (tan, leftt scale), Baumeister-Leiva-Leon-Sims Weekly Economic Conditions Index for US plus 2% trend (green, left scale), first principal component of Google Mobility Trends (chartreuse, right scale). Source: NY Fed via FRED, OECD, WECI, Google and author’s calculations.
(A follow up on “So you think we might be in a recession today” Part I, Part II, Part III, Part IV, Part V, Part VI, as well as “So you think we might be in recession as of mid-June”, Part I and Part II, and “So you think we might be in a recession as of mid-July”, and “So you think we might be in a recession as of end-July”)
Off topic, inflation and China’s economy –
While container shipping is still jammed up and relatively expensive, dry bulk rates have plunged. That decline in shipping costs is a further disinflationary factor for commodities. According to Freightwaves:
“In October, average Capesize rates topped $80,000 per day and some individual ships earned over $100,000 per day. As of Tuesday, the Baltic Capesize index assessed rates at just $8,783 per day. That’s not only well below all-in cash breakeven, which includes financing costs, it’s below operating expenses (crewing, stores, etc.)”
What’s behind the drop? China, maybe:
“Chinese steel production — which supports iron ore and coal imports — fell to 907 million tons in July, down 6% from June, according to the World Steel Association.”
https://www.freightwaves.com/news/the-plunge-in-dry-bulk-shipping-an-ominous-signal-on-chinas-economy
The Foremost Group is a shipping company that transports a lot of iron ore from Australia to China. I raise this because Trump decided to attack his former Transportation Secretary Elaine Chao as a crazy woman making a lot of money off of China. You see – her husband is Senator McConnell who is currently criticizing Trump’s weirdo candidates (e,g, some former football player in Georgia and Dr. Oz). Her dad also started this shipping company. I guess they are not making that much money.
Then again Elaine Chao was accused of helping her dad’s company by supposed goodies from the President who just happened to be the mob boss who is now criticizing her. Funny how that works.
In October, average Capesize rates topped $80,000 per day and some individual ships earned over $100,000 per day. As of Tuesday, the Baltic Capesize index assessed rates at just $8,783 per day. That’s not only well below all-in cash breakeven, which includes financing costs, it’s below operating expenses (crewing, stores, etc.) Freight futures are also falling. Brokerage SSY reported that calendar year 2023 Capesize forward freight agreements were offered Tuesday at $14,900 per day and 2024 contracts at $14,750 per day.
For much of the period from 2010 to 2019, freight rates were below all-in cash breakeven rates to shipping companies has persistent losses. But over the last couple of years, these same companies are making obscenely high profit margins.
Thanks for these continued updates.
I’d honestly like ltr to earnestly counter them with good data and analysis. She is capable. Is she willing? (Does that data and analysis even exist?)
More likely this has to do with lack of shipping from Ukraine and Russia. Both have had their shipping exports reduced rather drastically (although for different reasons). So there are a lot of ships that no longer can find stuff to move.
Why shouldn’t I be rooting for recession, because it means less logging?
Because human misery?
Off topic, inflation and China’s economy –
On the other hand, China is struggling to keep what has looked like a record grain harvest from withering in the fields:
https://www.npr.org/2022/08/21/1118683699/china-grain-harvest-cloud-seeding
China needs rain soon to avoid crop losses:
“The coming 10 days are a “key period of damage resistance” for southern China’s rice crop, said Agriculture Minister Tang Renjian, according to the newspaper Global Times.”
Wheat future are still near their recent low price, which suggests market participants are discounting weather risk to China’s crop pretty heavily. India has recently announced it will not import wheat n the near term, keeping downward pressure on prices.
Of course Europe is having a terrible time with heat and drought, worsening its harvest outlook and exacerbating a dire economic situation caused by counterproductive sanctions.
But parroting propaganda requires that you discuss only the problems of your adversary. USA…USA..,USA!
“…and exacerbating a dire economic situation caused by Russia’s war against Ukraine.”
There, I fixed it for you. Funny how comrade Johnny can never remember that Russia invaded Ukraine – twice.
You have to marvel at the “logic” of “intellectuals” who are supposedly highly trained: “Russia’s invasion caused sanctions.” As if there were a direct relationship between invasion and sanctions! But there is none. When the US illegally invaded Iraq there were no sanctions. When the US illegally occupied South Vietnam, there were none. But the brilliant MacroDuck thinks that there is some kind of causal relationship between invasion and sanctions!!!
On the flip side, the US imposes sanctions on many countries who have not invaded anyone nor are they likely to.
https://home.treasury.gov/policy-issues/financial-sanctions/sanctions-programs-and-country-information
Fact is, sanctions are a political decision, designed to punish a country that is not behaving the way you want it to. Europe had a range of options on how to respond to Russia’s illegal invasion of Ukraine. There was no cause and effect that mandated sanctions, or the specific ones chosen. It was entirely a political decision. And now they are suffering the consequences: “As Ukraine war drags on, Europe’s economy succumbs to crisis.”
https://www.reuters.com/world/europe/ukraine-war-drags-europes-economy-succumbs-crisis-2022-08-23/
And MacroDuck conveniently overlooks the one causal relationship that does exist–disrupt the supply of a vital economic input, and your economy will suffer. How did he miss that one? And how could European politicians have been stupid enough to shoot themselves in the foot?
Finally, it’s funny how an “economist” doesn’t understand something so fundamental to his work. I expect you can find many other examples of Macroduck’s lack of understanding of causal relationships throughout his work. But one thing is certain: ignoring cause and effect is fundamental to being a political hack, not a serious academic.
This is utter gibberish. Putin is murdering people in Ukraine just because he can. And you seem to enjoy these war crimes as you bring up one off topic claim after another so as to excuse these war crimes. It is akin to defending the Holocaust because other bad things were going on during the 1930’s.
“sanctions are a political decision, designed to punish a country that is not behaving the way you want it to.”
Excuse me? I guess it is OK by you that Russian soldiers are raping the women of Ukraine. I guess it OK by you that the children of Ukraine have no home and cannot go to school. I guess it is OK by you that Putin is committing genocide on a grand school.
Not behaving the way you want it to you? You are a disgusting human being with zero caring for the citizens of Ukraine. Utterly disgusting.
Johnny, that’s so cute! Really, it is. You tried to make a real argument!
I’m going to reward you for trying. I’m going to help you by showing you a couple of little problems with your effort.
First, you left out the effect f the war on Ukraine. Ukraine is a major grain producer. Russia blocked Ukraine’s Black Sea ports, preventing Gran exports. That has caused extreme hardship for people who depend on Ukrainian grain for food, most particularly in the Middle East and You Africa. See? No sanctions required.
The second problem is only a little more subtle. See if you can grasp it. Sanctions are, indeed, meant to punish countries for not behaving the way you want. But Johnny, so is war. Russia’s war on Ukraine is Russia’s response to Ukraine not behaving the way Putin wants. In order to condemn Western sanctions because they aim to change Russia’s behavior, you must also either also condemn Russia’s war or declare what’s OK for Russia is not OK for everyone else.
Johnny, your comments here do rather suggest that you think Russia’s war against Ukraine is OK. You haven’t condemned Russia, but do condemn the U.S.
For finally, you’ve ignored causation. The democratic alliance – not just the U.S. Johnny – did not impose sanctions without cause. Russia attacked Ukraine because Putin did not like Ukraine’s behavior. Democratic nation’s hard to decide to respond, or to do nothing, in response to Russia’s attack on Ukraine. If Russia had not decided that killing Ukrainians, destroying their homes and the infrastructure that makes modern life possible – and inevitably, the rape and figure of Ukrainians – then democratic nation’s would have not had to choose whether to respond.
The choice to impose economic sanctions is a choice to accept hardship in order to impose hardship. No question. Absent a good reason, that would be an immortal choice. The choice to moose sanctions as not ithout good reason. It is an effort, as you say, to punish behavior. Funny how you didn’t name the behavior being punished. The “behavior” you refuse to name a war. Is it immoral, Johnny, to punish an invasion of one country by another? Is it immoral to calculate that you can make future war less likely by punishing today’s war?
And Johnny, I’m still waiting for you to grow a spine and take the bet. You’ve got the advantage, little Johnny. If real U.S. GDP contract in each of the first three quarters of 2022, as you seem so sure will happen, I won’t comment here for all of Q2, 2023. If you’re wrong and GDP doesn’t fall in each of those quarters, you don’t comment in Q1. Or you could choose not to comment in Q4. Up to you. C’mon. You talk a good game. Talk is, you know, cheap.
Oh, and Johnny? I’m flattered that you think I’m highly trained.
“I have a certain set of skills…”
Europe will be a wonderful place when JohnH’s Russian war criminals kill all those damn Ukrainians. JohnH reminds me of a Gestapo agent who took glee murdering the Jews,
Or as JohnH would insist, “allegedly”.
Couple of things from the WSJ:
The heat wave in parts of China is the worst since records began in 1961. The drought in Italy, Portugal, France and Spain is the worst in 500 years. The two-decade-long drought in the American West is the worst in 1200 years.
https://www.google.com/amp/s/www.wsj.com/amp/articles/droughts-hurt-worlds-largest-economies-11661087554
But that’s probably just weather, not climate, right?
Seth Kaplan, from Johns Hopkins, has something especially for ltr:
https://www.google.com/amp/s/www.wsj.com/amp/articles/how-chinas-propaganda-influences-the-west-state-media-cable-censorship-wechat-social-media-hong-kong-election-russia-ukraine-newspaper-11661108182
Kaplan recounts various lies spread by Chinese news outlets in the West. He doesn’t bother with fifth-column trolls like ltr.
Here’s Kaplan’s concluding sentence:
“If Beijing’s propaganda campaign remains unchecked, all Americans will suffer.”
ltr will probably declare Kaplan’s views to be racist lies, because that’s what she always does. What she never does is to prove it. Instead, she spouts her own racist lies about how benevolent China is toward the minority ethnic groups that China suppresses.
About climate change: I see a silver lining here and you may agree: the political salience of climate change is through the roof this summer, and throughout the northern hemisphere. I am willing to bet money I don’t have that that’s why Sinema/Manchin (in whatever order it privately happened) turned around on the climate bill.
Unfortunate that we’re seeing this so late though. Still, a cause for hope.
It’s as if the Climate Goddess, showed up, looked around, and said “Nice little culture ya got here. Be a shame if somethin’ happened to it.” Only she didn’t after her boys broke the place up, ’cause we DON’T LISTEN!
1000-year droughts, 1000-year floods everywhere you look in the global north, in some places not the first time in recent years. The joint probability of this is tiny assuming no climate change.
This stuff is biblical. A little Old Testament, and some of those last bits of the New.
But no, it’s “ProJEcT FeEArRR!! tHe kLimuT CHangiZ ALL thA TiMeeE!”
Guess what? That same Goddess showed up to bestow a record wheat harvest on Russia.
https://www.world-grain.com/articles/17334-russias-wheat-harvest-estimate-increasing-due-to-record-yields
But she’s hurting European agriculture. Where is MacroDuck’s jubilation?
https://www.politico.eu/article/drought-climate-eu-agriculture-harvest-farmer-future/
At least MacroDuck gets to experience his perverse Schadenfreude somewhere!
What’s that, JohnH? Russia good, West bad? Never heard that from you before.
JohnH
August 23, 2022 at 9:40 am
Johnny boy is trying to tell us that God himself is applauding Putin’s war crimes. Seriously? How sick can one get.
Oh my – Johnny boy did not read his entire link:
However, the higher estimate is not likely to have much impact on the global market because Russian exports “remain painfully slow,” Sovecon said. Banks, shippers and insurers are wary despite US assurances over sanctions related to Russia’s invasion of Ukraine, traders told Reuters.
So Russian farmers are producing grain but the incompetent Putin government cannot get them to market? Who is in charge of this for Putin? Oh Johnny boy is in charge. Got it!
I hear you were fishing in the wilderness where several logs hit you in the head. Well given your fried brain – the damage was inconsequential.
Bruce Hall and CoRev are really dumb on climate change but check out Herschel Walker:
https://www.rawstory.com/herschel-walker-climate/
Republican candidate Herschel Walker questioned the wisdom of spending money on trees to mitigate climate change. Walker, the Donald Trump-endorsed former football star who won the GOP nomination for Georgia Senate, expressed his opposition to the newly signed Inflation Reduction Act, which boosts spending on climate change preparations and environmental initiatives, during a Republican Jewish Committee event, reported the Atlanta Journal-Constitution. “They continue to try to fool you that they are helping you out, but they’re not, because a lot of money it’s going to trees,” Walker said. “Don’t we have enough trees around here?”
pgl
nothing being subsidized/incentivized in the deflation reduction bill is mature technology.
the stark lack of integration is beyond the view of the planners invested in the taxpayer largesse.
the pentagon trough is prototype for a green trough as it is for the pharma trough
a further plan to degrade….
What?
What Anonymous is saying is that mature technology, like coal and oil and gas, should receive subsidies. Subsidizing innovation is bad.
md,
when dod looks at technology new stuff is in a technology development level one
stuff ready to go into an operating system is tdl 5
most of the subsidized stuff is not tdl 2
while the integration is on a different spectrum is premature
engineering
as the famous Turk said
economics s& politics are not bound by physics
Estimated unsubsidized levelized costs of energy generation in the United States in 2021, by technology(in U.S. dollars per megawatt hour)
https://www.statista.com/statistics/493797/estimated-levelized-cost-of-energy-generation-in-the-us-by-technology/
It’s almost as if economics + physics = cheap renewable energy.
Oh but they’re not “mature”, right? Doesn’t that mean the costs are due to come down even more?
AndrewG, levelized cost (LCOE) is a false and incomplete method for estimating actual costs. The better method is Full costs (FCOE). Using FCOE puts renewables in a totally different cost spectrum, because it includes the cost of subsidies, the costs needed to backup and the costs build the added infrastructure needed to support renewables generation. Adding renewables to a grid adds unreliable/undispatchable electricity to the grid.
“LCOE is inadequate to compare intermittent forms of energy generation with dispatchable ones and when making decisions at a country or society level. We introduce and describe the methodology for determining the full cost of electricity (FCOE) or the full cost to society. FCOE explains why wind and solar are not cheaper than conventional fuels and in fact become more expensive the higher their penetration in the energy system. The IEA confirms “…the system value of variable renewables such as wind and solar decreases as their share in the power supply increases”. This is illustrated by the high cost of the “green” energy transition.” https://papers.ssrn.com/sol3/papers.cfm?abstract_id=4000800
To confirm this conclusion just look at the actual costs for electricity across the world. This incomplete graphic exemplifies prices: https://www.electricrate.com/wp-content/uploads/2020/12/Average-residential-electric-rates-countries-1024×528.png this is from this article,https://www.electricrate.com/data-center/electricity-prices-by-country/ which also shows the implementation of low carbon sources: https://www.electricrate.com/wp-content/uploads/2020/12/electricity-prices-by-country-1024×723.jpg
You might want to correlate countries using low carbon sources with prices.
First of all CoRev, the link I provided is for unsubsidized prices. It’s right there in the title I pasted.
Second of all, have you actually read the links you included here?
Countries With the Least Expensive Electricity Prices
Ranking Country Avg Electric Price (in U.S. cents per kWh)
1 Sudan 0
2 Venezuela 0
3 Iran 0
4 Ethiopia 1
5 Kyrgyzstan 1
6 Cuba 1
7 Libya 1
8 Zimbabwe 1
9 Bhutan 2
10 Angola 2
11 Suriname 2
12 Uzbekistan 3
13 Zambia 3
14 Iraq 3
15 Kuwait 3
16 Qatar 3
17 Oman 3
18 Algeria 4
19 Egypt 4
20 Kazakhstan 4
Commonalities here?
– places with oil, and
– places that are incredibly poor
Well duh – if it is mature it either can work without subsidies or is not commercially viable.
I am so glad that nothing being subsidized in that bill is mature technology. They are not wasting money. All of it is being used on those risky promising things that may help us take the next step. I knew Biden is brilliant – didn’t know he was THAT brilliant.
On topic (See? Even I can do it.) –
Big doings for Q3 GDP estimates this week. Durables shipments, orders and I ventories data on Wednesday. Personal income and spending and estimates for retail and wholesale inventories and the trade gap on Friday.
Johnny? Here’s your chance to prove you believe what you say you believe, to prove you aren’t just trash talking. Take the bet, Johnny. Show a spine.
MD
Seems like good news for new orders for durable goods.
The Econoday new durable goods orders consensus forecast, FRED series, DGORDER, is 0.5%, and the consensus range is -0.4% to 2.1%. Big range.
The Econoday consensus forecast for core durable goods orders, DGORDER minus transportation, FRED series, ADXTNO, is 0.1% with a consensus range of -0.1% to 0.4%. Another big range.
The Bloomberg consensus forecast for DGORDER is 0.6%, and the Bloomberg consensus forecast for core orders, ADXTNO is 0.2%.
For DGORDER, I show a forecast of 0.4%, compared to Econoday at 0.5% and Bloomberg at 0.6%.
My efforts forecasting core orders, ADXTNO, show a forecast of 0.4%. Inside the Econoday range, but different from the consensus. Given that both the Econoday consensus and the Bloomberg consensus are between 0.1% and 0.2%, looks like I will be off the mark.
Seems like good news for Core PCE inflation.
For PCE core inflation, FRED series, PCEPILFE, the Econoday consensus forecast is 0.3%, with a range of 0.1% to 0.4%. The Y/Y forecast is 4.7%.
Bloomberg shows a consensus forecast of 0.3%, and Y/Y forecast of 4.7%.
My efforts show a monthly percent change of 0.23%, so 0.02 percentage points from 0.3% rounded. I show the same Y/Y forecast of 4.7%.
AS,
The fat lady hasn’t sung yet, but forecasts do look good. The Citigroup economic surprise index, after a dreadful performance in Q2, has turned around so far in Q3. That doesn’t tell us anything about the likely accuracy of forecasts for particular series, but does tell us that, on average, forecasters are not being disappointed as much as a couple of months ago.
Fingers crossed, and good luck with your calls.
Johnny? Johnny? Are you dodging me, Johnny?
Johnny is too busy helping Putin’s pigs kill all those damn Ukrainians!
Menzzie Menzie Menzie when are you going to learn. An unemployment rate of 3.5% is CLEAR evidence of a recession.
The 3 is a typo. It’s actually 18.5%. Says ZeroHedge. I imagine.
Donald Trump’s minions are out to destroy any sense of democracy or basic decency:
https://politicalwire.com/2022/08/22/voting-system-files-were-shared-with-trump-supporters/
“Sensitive election system files obtained by attorneys working to overturn President Donald Trump’s 2020 defeat were shared with election deniers, conspiracy theorists and right-wing commentators,” according to records reviewed by the Washington Post. “A Georgia computer forensics firm hired by the attorneys placed the files on a server, where company records show they were downloaded dozens of times. Among the downloaders were accounts associated with a Texas meteorologist who has appeared on Sean Hannity’s radio show; a podcaster who suggested political enemies should be executed; a former pro-surfer who pushed disproved theories that the 2020 election was manipulated; and a self-described former ‘seduction and pickup coach’ who claims to also have been a hacker.”
These people need to be in prison forever.
the clear growth in July and the exuberance the past few weeks calls for .75% in September
supported by the aug cpi print and aug plus to q2gdp estimate
JohnH has turned to The Gray Zone to justify the Putin war crimes against Ukrainians. Who is this group? Well start here:
https://rationalwiki.org/wiki/The_Grayzone
These jerks probably think Hitler had it right.
Reportedly they like to call critics “McCartyites.” Funny that JohnH attempted to pull that here until i cleaned his clock on that matter.
Never mind Menzie’s careful graphs and analysis–trust these anecdotes:
-Price of gas is falling–we’re in a recession
-If the price of gas rises–we’ll be in a recession
-Supply chains are better for most construction materials—except for nice windows manufactured somewhere in Minnesota–order now to receive units in JANUARY!
-House builders are in a recession because the Fed body-slammed them with interest rate hikes. They’re also getting slammed by supply chain backlogs, crappy zoning regulation, and crappy mobility in the U.S. population. And skilled labor shortages. Long story short, some correction in the housing market means we’re in a recession–welcome back to 2008 suckers–just look at those collapsing prices in the S.F. Bay area. Buy the dip folks!
-The Metaverse is a hilariously bad sequel to Tron. Tron had better graphics. Recession,
-ltr has been hysterical in recent posts–maybe a paycheck from the CCP bounced and they’re feeling paranoid. A recession in China means a recession here, because they own all our property just like Japan did in the 1980’s. Has no one watched Rising Sun?
-Crypto was a bust. Recession.
All my comments can be taken literally.
Tron. 🙂
– crypto is alive! Recession.
Even higher predictive power:
– Jurassic World: Dominion disappoints. Recession.
– coffee this morning was off. Recession.
– unemployment at 3.5%. Well I guess that’s a data point.
– Citrix giving me trouble yesterday aft. Recession.
Oh, I forgot:
– Sean Connery dead, Wesley Snipes now focusing on comedy. Recession.
Off-ish topic because let’s add to the quality of the comment section where very few commenters on Menzie’s posts actually care about the blog topic, but I can’t wait until the “So You Think We’re In a Recession as of August?” editions.
PossiblyNotEconned aka Econned: See [1], [2] and [3].
The wait was over before it began x3!
Chinese producers are currently responding to international steel and magnesium demand changes. Demand for steel and magnesium alloy products varies inversely internationally with Federal Reserve rates. Fed rates are rising, and Chinese mangalloy producers cut raw material orders and manufactured product production in July. Domestic demand in China should be sustained by infrastructure projects.
As for the current heat wave, China is taking a range of measures to protect agricultural production and the thinking of planners is that the measures will be broadly successful. The anticipation is for year to year increases in yield, grains, seed oils, vegetables, fruits, mushrooms, livestock. Agricultural surplus stores are already running about 2 supply-years.
https://tradingeconomics.com/commodity/baltic
The Baltic Dry Index is reported daily by the Baltic Exchange in London. The index provides a benchmark for the price of moving the major raw materials by sea. The index is a composite of three sub-indices that measure different sizes of dry bulk carriers: Capesize, which typically transport iron ore or coal cargoes of about 150,000 tonnes; Panamax, which usually carry coal or grain cargoes of about 60,000 to 70,000 tonnes; and Supramax, with a carrying capacity between 48,000 and 60,000 tonnes. The Baltic Dry Index takes into account 23 different shipping routes carrying coal, iron ore, grains and many other commodities.
https://news.cgtn.com/news/2022-08-22/China-takes-diverse-measures-to-battle-unprecedented-heatwave-1cHLCWkalRC/index.html
August 22, 2022
China takes diverse measures to battle unprecedented heatwave
Cities in China have implemented a slew of measures to battle the ongoing heatwave and mitigate power or water shortages and bushfires.
Local authorities in southwest China’s Sichuan Province initiated a first level emergency response, the highest of its kind, on Sunday as the province endured its highest temperatures, lowest rainfall and highest power demand since July.
The emergency response requires that the demands of households are met before those of industrial production. Measures limiting the electricity to some industrial users were extended to Thursday.
Meanwhile, the State Grid increased daily power supply to Sichuan to 132 million kWh and a total of 50 emergency power generating vehicles from 13 provincial regions including Beijing, Jiangsu and Zhejiang arrived in Chengdu, the provincial capital.
In addition, the China Energy Investment Corporation is diverting water supply to a major river in Sichuan so local power plants can increase their capacity.
Six generators in Sichuan’s largest coal power plant in Guang’an have been running at full capacity since August 1. The plant can produce up to 2.4 million kWh of power every hour. The plant estimates the total capacity for August will be more than 300 percent higher than the same month in 2021.
Neighboring Chongqing Municipality is experiencing its most severe consistent hot weather since 1961. Local agricultural technicians have visited vegetable growers door to door in the municipality’s Bishan District to offer them one-on-one guidance on reducing possible losses caused by the high temperature. They have put in place multiple pieces of cooling equipment, such as sun shades, fans and water curtains.
Multiple bushfires caused by the persistent drought and heatwaves have been put out in Chongqing. Over 5,000 rescue personnel, including firefighters, armed forces and rescue teams, as well as seven helicopters, were mobilized to put out the fires. More than 1,500 people have been evacuated to safe places….
Also, production of energy in China is generally keeping up with increasing demand through the heatwaves. China is continually adding to energy stores, with special emphasis on renewable and nuclear sources. What is little known is that China is discovering important oil and gas reserves, and developing unique domestic technology to recover these reserves. Coal stores, however, are also being added to.
The point being that energy diversity is what China is about, that and national transmission of electricity.
https://www.aap.org/en/pages/2019-novel-coronavirus-covid-19-infections/children-and-covid-19-state-level-data-report/
August 18, 2022
Cumulative Number of Child COVID-19 Cases
Almost 14.4 million children are reported to have tested positive for COVID-19 since the onset of the pandemic according to available state reports; over 358,000 of these cases have been added in the past 4 weeks. Approximately 6.5 million reported cases have been added in 2022.
14,362,007 total child COVID-19 cases reported, and children represented 18.4% (14,362,007 / 78,010,034) of all cases
Overall rate: 19,082 cases per 100,000 children in the population
American Academy of Pediatrics
Children’s Hospital Association
two step grandsons 11 and almost 9 have tested positive in past month
both parents have had it over last 18 mo or so
kids had a fair high fever, and flu like
not sure the boys are in the statistics
https://news.cgtn.com/news/2022-08-23/Chinese-mainland-records-382-new-confirmed-COVID-19-cases-1cIYA4d4Hh6/index.html
August 23, 2022
Chinese mainland records 382 new confirmed COVID-19 cases
The Chinese mainland recorded 382 confirmed COVID-19 cases on Monday, with 308 attributed to local transmissions and 74 from overseas, data from the National Health Commission showed .
A total of 1,513 asymptomatic cases were also recorded on Monday, and 22,161 asymptomatic patients remain under medical observation.
The cumulative number of confirmed cases on the Chinese mainland is 240,233, with the death toll from COVID-19 standing at 5,226.
Chinese mainland new locally transmitted cases
https://news.cgtn.com/news/2022-08-23/Chinese-mainland-records-382-new-confirmed-COVID-19-cases-1cIYA4d4Hh6/img/bc61cf7c989e417c9ef32a8cd62ecc3a/bc61cf7c989e417c9ef32a8cd62ecc3a.jpeg
Chinese mainland new imported cases
https://news.cgtn.com/news/2022-08-23/Chinese-mainland-records-382-new-confirmed-COVID-19-cases-1cIYA4d4Hh6/img/3002bb52b14f4a3c9e7d24f1e39df8a2/3002bb52b14f4a3c9e7d24f1e39df8a2.jpeg
Chinese mainland new asymptomatic cases
https://news.cgtn.com/news/2022-08-23/Chinese-mainland-records-382-new-confirmed-COVID-19-cases-1cIYA4d4Hh6/img/8bff1054303e4ebe8249b36f49647020/8bff1054303e4ebe8249b36f49647020.jpeg
https://www.worldometers.info/coronavirus/
August 22, 2022
Coronavirus
United States
Cases ( 95,449,606)
Deaths ( 1,066,082)
Deaths per million ( 3,207)
China
Cases ( 239,851)
Deaths ( 5,226)
Deaths per million ( 4)
Just a reminder everybody. The US has receiveed 400 Nobel Prizes, and China has received zero.
People under indefinite detention with no charges for BS security reasons:
China: 1M+
US: 36, and falling
I would think Liu Xiaobo counts.
Cratering housing market. See CR.
Suddenly, we’re at record months of homes under construction, although the months of completed homes remains near record lows. The implication would seem to be an emerging recessionary environment resulting from increased interest rates, with the 30 year at 5.72% — pretty stiff.
https://www.calculatedriskblog.com/2022/08/new-home-sales-decrease-sharply-record.html
Sales of new homes are at recessionary levels.
https://blogger.googleusercontent.com/img/b/R29vZ2xl/AVvXsEipiCOV–BampXCf2uMhjiKyliVpup55j1V5d485doCrflTR9h95y7uL2E3lYsESXZYkrlYCJSzQCgBKWjOTS7D1FvF4geUMy4TwsHHcMiZFsQh4E_9gSdpQuyJPFDg9RWZqifF5YyVYD9ZQTUxVOSc9Y80LWQ2IHh6b8hbp-DO9qYf_RKwdw/s1077/NHSJuly2022.PNG
This is all ‘hard reset’ stuff. It seems to imply a recession from, say, Q1 2023. This recession, unlike that of H1 2022, will not be the result of stimulus rolling off (ie, contractionary fiscal policy), but rather from interest rate hikes (contractionary monetary policy).
You’re kind of full of sh** [edited MDC], Steve.
Sorry Prof. Chinn. :-/
Specifically?
Andrew was very specific. Simply because you are too arrogant to READ what he wrote means nothing except you remain a bloviating bozo.
I’m more specific about exactly how full of crap you are below. You are welcome to read it, or do what you usually do with accurate analysis, just ignore it.
That’s not an answer. That’s some attitudinal stuff. But it’s not an answer. An answer should be something like: ‘You assertion of [xyz] is incorrect because [some statement related to some credible-ish source and/or some analytics related thereto].” That’s pretty typical of Slugs, for example. We may not always agree, but at least he’ll marshal a framework and some sources. If all you’ve got is, “Gee, I don’t like what you said'”, well, that makes you a less articulate version of Barkley. But let me add that Barkley makes clear and generally well supported arguments based on the substance of the issue rather than personal attacks. He just doesn’t like to take a position on some controversial topics. Not uncommon among academics, indeed, more broadly.
pgl often challenges my assertions, and pretty much without fail, I pull up the source I used to make the point. I do read the press, and I am accustomed to sourcing. pgl is both lazy and sloppy nowadays, so I regularly nail him, because I mostly go back and check the source data and run a spreadsheet as necessary. He’s principally invested in his darker emotions, rather than the substance of the debate. More’s the pity.
So, if you’re limited to ‘you’re full of sh*t’, then my take will be that you’re too intellectually lazy to articulate a counter-argument. If you want to debate a specific point, let’s debate it. If all you’ve got is attitude, well, don’t expect me to express some sort of admiration.
Steven Kopits: To my knowledge, pgl has (1) never added together chained quantity indices (e.g., chained 2012$), (2) misunderstood/mischaracterized a confidence interval, or (3) misconstrued an set of estimated probabilities with the underlying series used to calculate the probability (e.g., VMT).
Andrew! The technically correct term is that he is full of LIES.
I read Bill McBride’s post. He did not say the market was “cratering”. He did not say there was a “hard reset” or a recession.
I thought you respected his blog posts. Then why did you LIE about what he wrote?
I wrote:
“Sales of new homes are at recessionary levels.”
https://blogger.googleusercontent.com/img/b/R29vZ2xl/AVvXsEipiCOV–BampXCf2uMhjiKyliVpup55j1V5d485doCrflTR9h95y7uL2E3lYsESXZYkrlYCJSzQCgBKWjOTS7D1FvF4geUMy4TwsHHcMiZFsQh4E_9gSdpQuyJPFDg9RWZqifF5YyVYD9ZQTUxVOSc9Y80LWQ2IHh6b8hbp-DO9qYf_RKwdw/s1077/NHSJuly2022.PNG
Check McBride’s graph. Whenever sales of new homes were at current levels since 1970, the US was in recession. That doesn’t mean I think we’re in recession. It means literally what I said: “Sales of new homes are at recessionary levels.”
I did check his graph. Does the year 2016 come to mind? It should since I specifically mentioned that year. Or did you flunk preK reading? Now tell us all about that 2016 recession.
Again and again, you show you don’t understand what a well-formed prediction looks like. Partial here, partial there, cobble it together into whatever BS story you like at the moment. “China’s at $22k PPP per capita, they’ll be a democracy by 2026!” And then coat it with vapid ad copy. “Hard reset!!!” B-level students in econometrics could see through this.
I looked at your graph and it news new home sales are at levels seen around 2016. Gee Stevie – please tell us all about the 2016 recession? Is that like your claim we had a 1947 recession?
That was a recovery from a deep recession, the China Depression, in fact. So if you’re saying new home sales are recovering, then sure, I take your point.
But new homes sales are not recovering. They are collapsing. And when they have collapsed to this point since 1970, the US has been in recession.
Blah, blah, blah. You did not address my question but babble on. It is what you do.
You. Are. Just. Making. Things. Up.
And smartly branding your BS with Steve Kopits jargon. That’s why people who wouldn’t know better can’t tell how full of crap you are.
That’s the nicest thing I can say about your analysis.
And “CR”‘s conclusion is not a “cratering housing market.” To wit:
The next graph shows the months of supply by stage of construction. “Months of supply” is inventory at each stage, divided by the sales rate.
Active InventoryThere are 1.06 months of completed supply (red line). This is about two-thirds of the normal level.
The inventory of new homes under construction is at 7.33 months (blue line) – a new record and well above the normal level. *This elevated level of homes under construction is due to supply chain constraints.*
And a record 107 thousand homes have not been started – about 2.51 months of supply (grey line) – more than double the normal level. Homebuilders are probably waiting to start some homes until they have a firmer grasp on prices and demand.
…
This suggests we will see a sharp increase in completed inventory over the next several months – and that will put pressure on new home prices.
https://www.calculatedriskblog.com/2022/08/new-home-sales-decrease-sharply-record.html
I’m shocked at how full of crap you are. What is the point of posting this nonsense here? Are you trying to save face? There was no recession in H1, and we’re feeling tight monetary policy’s effects *now*, FFS. You even seem to be confused about basic terminology. Who the hell would pay you for this useless analysis?
Literally, the title of the article is “New Home Sales Decrease Sharply, Record Months of Unsold Inventory Under Construction”
To me, ‘decrease sharply’ can be interpreted as ‘cratering’. But maybe you think new homes sales are soaring?
The only thing that is cratering is your brain cells. Stop with this garbage hyperbole as it is insulting to everyone including Bill McBride.
FFS read the article. It’s not saying what you’re saying – explicitly. I pasted it in the comments above – read it.
No one with access to the data and a working brain actually thinks H1 was a recession. The data is screaming at you and you just babble on about whatever the hell it is you are babbling on about. The job market remains hot – has been this entire year. When has the NBER ever called a recession under these conditions? Chinn, an actual economist, keeps giving you the relevant data and analysis on a silver platter, and you just swat it away and repeat whatever it is you’ve been repeating. It’s like you have your own private definition of ‘recession.’
“Hard reset” is BS made-up Steve Kopits jargon no one else understands, because you just made it up and it’s empty jargon.
Is that specific enough for you?
Absolutely full of crap.
And this, three stories down down on CR:
And a table of July sales. Sales in these areas were down 22.8% YoY, Not Seasonally Adjusted (NSA). Contracts for sales in July were mostly signed in May and June, and we are seeing the impact of higher mortgage rates on July closings.
In June, all local markets I track were down 15.9% YoY, NSA. So, this was another step down in sales, although there was one less selling day in July this year than in July 2021. The NAR reported July sales down 22.4% YoY NSA, and down 20.2% Seasonally Adjusted (SA).
A drop of nearly 23% yoy? That, my friend, qualifies as ‘cratering’. But maybe you think it’s a great time in real estate.
https://www.calculatedriskblog.com/2022/08/final-look-at-local-housing-markets-in.html
Look. At. The. Chart. It’s a growing year-over-year number. Month-on-month change of yoy number is 7%.
No one is claiming it’s a good time to be in real estate. The #1 mechanism for Fed action is through housing. That doesn’t mean we’re in a recession. That doesn’t mean we’re going to be in one for sure.
You are unbelievably full of crap.
Our host took notice of the latest LIES from Princeton Steve and has a new post up. Alas, we should expect Stevie to weigh in with more of his dishonest RECESSION cheerleading.
“Who the hell would pay you for this useless analysis?” Stevie says he is a consultant. A consultant with zero clients.
As for H1, sorry, two quarters of declining GDP is the most common standard used to determine a recession. Any other definition is a ‘yes, but’ definition.
As for Q3, it seems we can speak of ‘recession’ in two phases. H1 looks very much like the result of contractionary fiscal policy. I am pretty sure Menzie could do the math for us.
Q3? Well, oil prices have eased and US gasoline consumption is looking somewhat better and IUCs were down last week. That’s not a whole lot of data, but it is data. So that would speak to an easing of conditions in at least part of Q3. So maybe the bulk of contractionary fiscal policy rolled off in H1. I think that’s plausible, and if that’s the case, then maybe Q3, or even Q4, is positive.
But then we have to face the impact of higher interest rates, and right now, it is devastating the real estate industry. Do we get away without a recession starting in Q4 22 – Q1 23? Could be. But that’s not the historical tendency.
This is just more blathering. You are trying to cover your ass.
“H1 looks very much like the result of contractionary fiscal policy.”
You didn’t even know how fiscal policy affects growth until I explained it to you. And you still have no clue how it might have filtered through the economy, or the timing of the effects. Zero knowledge, zero argument, just a bunch of jargon you picked up and some you made up. And you still completely ignore the job market, which remains among the hottest job markets in history.
You’re not getting any new clients from Econbrowser, Steve. The jig is up.
“the most common standard”
You are just making things up. Period.
https://fred.stlouisfed.org/series/PRFIC1
Real Private Residential Fixed Investment (2012$) was $673 billion in 2022QII. One has to be the dumbest troll ever to think this is at recessionary levels.
The implication would seem to be an emerging recessionary environment resulting from increased interest rates, with the 30 year at 5.72% — pretty stiff.
5.72% is not that high by historical standards. Funny thing – this interest rate has been falling and now is only 5.13%:
30-Year Fixed Rate Mortgage Average in the United States
https://fred.stlouisfed.org/series/MORTGAGE30US/
You do seem to LIE about everything.
It’s been 11 years since we saw interest rates at 5.72%. Now, that index value for my house at 100 in late 2019 corresponded to 3.6% for the 30 year fixed, literally 2 pp lower than the current rate.
Meanwhile, the current index value of the house stands at 142, that is, more than 40% higher than at a time when interest rates were 2 percentage points lower than they are now. And I would add that my house has lost 14.7% of its peak Zillow value of 162 in seven weeks. Seven weeks! That is the very embodiment of a ‘hard reset’.
Can you imagine if someone had bought a house here in early July? They would be heavily under water already, before the end of the summer. But I am sure you can show me a historical period when house values fell at this pace. I would be impressed if you could find a comp.
So you tell me, what do you think is going to happen? If interest rates remain unchanged, we would expect the value of my house to fall to 85, perhaps even 80, given the budget constraints of buyers. In any event though, a good bit of that remaining 40% of appreciation is going to evaporate in the next twelve months.
So, yes, the housing market is cratering and will continue to do so, and yes, the reset is coming at historically rapid rates. It is a hard reset.
https://fred.stlouisfed.org/series/MORTGAGE30US
The point for me about housing values is that given the model developed by Robert Shiller, and extending from 1890 on, real housing prices are higher than at any time since 1890. The model suggests current real prices will not be sustained. Shiller has accordingly been worried about real housing prices, but little attention is being otherwise paid to the Shiller model. I have learned to pay attention to well- and long-tested models, so am concerned about real housing prices:
https://fred.stlouisfed.org/graph/?g=QJHY
January 30, 2018
Case-Shiller National Home Price Index / Consumer Price Index, 1992-2022
(Indexed to 1992)
https://fred.stlouisfed.org/graph/?g=QJMA
January 30, 2018
Case-Shiller National Home Price Index / Consumer Price Index, 2000-2022
(Indexed to 2000)
https://fred.stlouisfed.org/graph/?g=QKnA
January 30, 2018
Case-Shiller National Home Price Index / Consumer Price Index, 1994-2022
(Indexed to 1994)
[ Robert Shiller was little concerned about whether interest rates were immediately increasing in 2004 or 2005, the concern was with the real price of housing which was historically unprecedented with no reasonable model to justify the real price. The Shiller model may no longer apply, but I am unable to figure out why.
https://fred.stlouisfed.org/graph/?g=shS6
January 30, 2018
Homeownership Rate for the United States, 1992-2022
https://fred.stlouisfed.org/graph/?g=rdV4
January 30, 2018
Homeownership Rate for White, Black and Hispanic, 2000-2022
https://fred.stlouisfed.org/graph/?g=DDAD
January 30, 2018
Homeownership Rate for White, Black and Hispanic, 2000-2022
(Indexed to 2000)
https://english.news.cn/20220823/2c0cf8b55d654633858fac70aaaf1d96/c.html
August 23, 2022
China urges intensified efforts to secure autumn harvest amid heatwaves
BEIJING — Chinese authorities have urged targeted measures to alleviate the impact of drought in a bid to secure a good autumn harvest this year.
Since late July, heatwaves have engulfed southern parts of China, posing severe challenges for the country’s autumn harvest, according to a notice issued by the Ministry of Agriculture and Rural Affairs, the Ministry of Water Resources, the Ministry of Emergency Management and the China Meteorological Administration.
Relevant authorities should issue alerts for high temperatures in a timely manner and adopt targeted measures to mitigate the adverse effects of the hot weather on autumn grain output, said the notice posted Tuesday on the website of the agricultural ministry.
More efforts should be made to ensure adequate irrigation water, open up new water sources, stagger rotation irrigation, and produce artificial rainfall when necessary.
China will also mobilize specialist teams to help with drought relief efforts, according to the notice.
China’s autumn grain production makes up about 75 percent of the annual grain output, and the country aims to achieve a grain output of more than 650 billion kg this year.
Hey, are you guys actually food secure? Inquiring minds want to know. Ask your bosses please.
Housing prices remain high but Stevie boy says the market is cratering. Go figure.
Maybe cratering high?
“That was a recovery from a deep recession, the —– Depression, in fact. ”
There was of course no such “—– Depression”:
https://fred.stlouisfed.org/graph/?g=S9HJ
August 4, 2014
Real per capita Gross Domestic Product for China, United States and European Union, 1977-2021
(Percent change)
https://fred.stlouisfed.org/graph/?g=S9HQ
August 4, 2014
Real per capita Gross Domestic Product for China, United States and European Union, 1977-2021
(Indexed to 1977)
“That was a recovery from a deep recession, the —– Depression, in fact. ”
There was of course no such “—– Depression”:
https://fred.stlouisfed.org/graph/?g=RqcN
August 4, 2014
Real per capita Gross Domestic Product for China, United States, India, Japan and Germany, 1977-2021
(Percent change)
https://fred.stlouisfed.org/graph/?g=RqcV
August 4, 2014
Real per capita Gross Domestic Product for China, United States, India, Japan and Germany, 1977-2021
(Indexed to 1977)
“That was a recovery from a deep recession, the —– Depression, in fact. ”
There was of course no such “—– Depression”:
https://fred.stlouisfed.org/graph/?g=T3wj
August 4, 2014
Real per capita Gross Domestic Product for China and United States, 1977-2021
(Percent change)
https://fred.stlouisfed.org/graph/?g=T3ww
August 4, 2014
Real per capita Gross Domestic Product for China and United States, 1977-2021
(Indexed to 1977)
Just a reminder everybody. The — has received 400 Nobel Prizes, and —– has received zero.
[ Imagine such a need to try to belittle an entire people. Of course the supposed point is meaningless; like using the prejudice of a Charles Murray to attack an entire people. ]
ltr,
Do not play a bs game with me on this. You have been told to stop repeating a certain number over and over and over and over as nauseum. I told you that if you do it, I shall post this hard fact. It is a hard fact, not an effort “”to belittle ane entire people.” Do not turn yourself into an utterly worthless liar. Stop spouting this unimportant number, and I shall stop spouting my equally unimportant number. Or maybe they are both important, but they should not be repeated endlessly all the time. You shut up, and I shall do so as well.
Does it not occur to you that your endless repeating of that number in comparison with those from other nations amounts to YOU “belittling” the entire peoples of all the other nations you are compaering them with? You do d lot of that, and for you to complain about me doing it back at you is just pure and utter hypocrisy.