and on the eve of the October employment report. With monthly GDP on Tuesday, and consumption and income last week, we have the following picture of some key series followed by the NBER Business Cycle Dating Committee (NBER BCDC):

Figure 1: Nonfarm payroll employment, NFP (dark blue), Bloomberg consensus as of 11/3 (blue +), civilian employment (orange), industrial production (red), personal income excluding transfers in Ch.2012$ (green), manufacturing and trade sales in Ch.2012$ (black), consumption in Ch.2012$ (light blue), and monthly GDP in Ch.2012$ (pink), GDP (blue bars), all log normalized to 2021M11=0. Q3 GDP is from GDPNow for 11/1. Lilac shading denotes a hypothetical recession in 2022H1. Source: BLS, Federal Reserve, BEA, via FRED, IHS Markit (nee Macroeconomic Advisers) (11/1/2022 release), GDPNow (11/1) and author’s calculations.
It’s interesting to consider what some alternative measures indicate (including GDO which the NBER BCDC does consider):
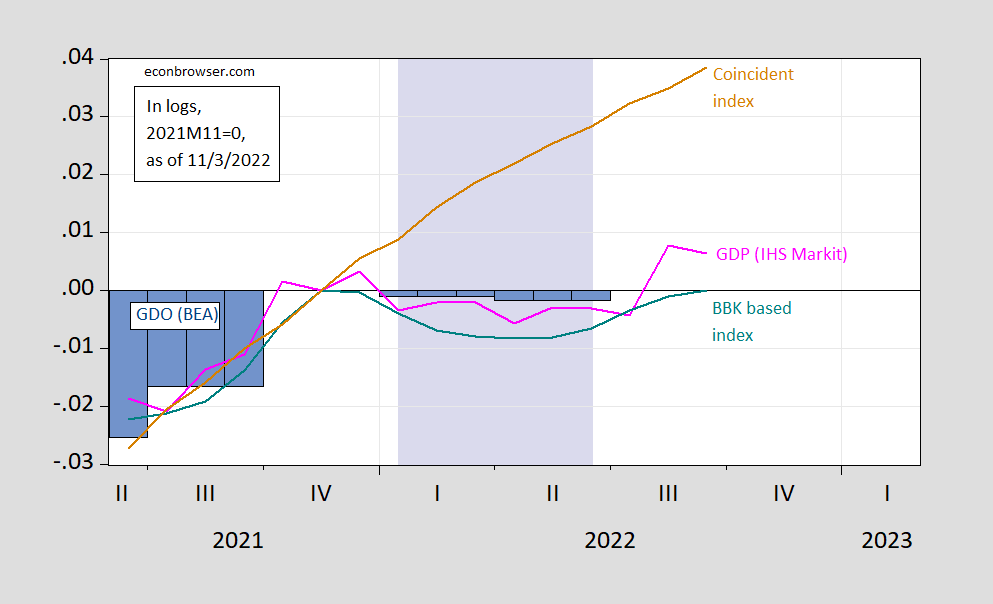
Figure 2: Monthly GDP in Ch.2012$ (pink), Brave-Butters-Kelley growth rate based index (teal), and coincident index (tan), GDO in Ch.2012$ (dark blue bars), all log normalized to 2021M11=0. Lilac shading denotes a hypothetical recession in 2022H1. Source: BEA, IHS Markit (nee Macroeconomic Advisers) (11/1/2022 release), Brave-Butters-Kelley GDP growth series via FRED, Philadelphia Fed, and author’s calculations.
The big question which surrounds these pictures is how employment indicators can diverge so much from income/production indices (the coincident index is driven mainly by labor market information).
What about an H1 recession, as per this comment:
1. H1 was a recession by the most commonly used standard
2. Nevertheless, the H1 downturn did not have some of the characteristics of many recessions, notably, unemployment did not rise
3. This sort of phenomena was last seen in 1945 when US defense spending collapsed, that is, a decline in GDP without a material decline in employment.
4. Thus, the H1 downturn plausibly could be explained by aggressively contractionary fiscal policy. Biden just yesterday crowed that he had reduced the budget deficit by $1.4 trillion in little over a year. That’s about 7% of GDP, so we might expect a contraction on the order of 4% of GDP (allowing for intervening, underlying GDP growth), and that’s about what we have seen.
5. Thus, from this perspective, H1 could be seen as a ‘technical recession’, but which I mean a formal downturn in GDP without an underlying business cycle.
In any case, only broad based production indicators like GDP subject to big revisions are consistent with a recession in H1.
The trumpification of Brazil:
https://www.reuters.com/world/americas/bolsonaro-backers-call-brazil-military-intervene-after-lula-victory-2022-11-02/
Any thoughts about the inversion of GS10 and 3m T-bills.
Looks like the T10Y3M gap inverted on 10/18/2022 was then positive and now has inverted
from 10/25/22 to 11/2/22.
The T10Y2Y gap has been negative since 7/6/2022.
A probit model using average T10Y3M average data from 1986M01 to 2021M01 now shows a 31%
probability of recession, with a threshold of 18%.
I notice that the Sahm indicator seems benign.
Is this the time the inverted yield curve fails to predict recession?
The curve is a leading indicator of recession. The Sahm indicator is concurrent. We shouldn’t expect them to agree.
The recent period has been characterized by stringlabor market performance and wobbly growth, so even current measures don’t agree well. So yeah, this period isn’t conventional. Makes a mess.
Thanks for the response.
I think the T10Y3M probit model says anytime within the next twelve months for the start of the recession qualifies for the indicator.
Kevin Drum has a weird post with lots of graphs that sort of remind me of Steve Rattner on Morning Joe. Kevin is trying to tell us inflation is going to come down even without more FED tightening, which may be right even if I am not impressed with all of this graphs. But one of his graphs made me laugh since we have had to endure a lot of Economic Know Nothings (Princeton Steve, Bruce Hall, CoRev to name the leading candidates) who have dusted off the discredited Quantity Theory of Money as if M2 monetary growth explains the current inflation rate.
But wait – let’s check with FRED on what has happened to M2 this year:
https://fred.stlouisfed.org/series/M2SL
No color me shocked, M2 has declined. So our Economic Know Nothing devotion to the Quantity Theory of Money should have these fools thinking we are in deflation. But they do not say that do they? Then again – this trio are truly Know Nothings.
do that chart at the 1 year scale?
I did – your point? Yea M2 rose from Sept. 2021 to March 2022 and has since declined. Now old worthless one – did you have a point? Didn’t think so.
yeah, right
i should have said what is % delta of m2 from jan 0202.
https://www.nytimes.com/2022/11/03/business/bank-of-england-interest-rates.html
November 3, 2022
Bank of England Raises Rates Most Since 1989
In its first meeting since Liz Truss resigned as prime minister, the central bank ramped up its fight against inflation.
By Eshe Nelson
The Bank of England’s policymakers raised interest rates on Thursday by the largest amount since 1989, intensifying their battle against inflation even as the central bank predicted that the British economy would enter a “prolonged” recession.
The bank lifted its key policy rate by three-quarters of a point, ramping up its effort to tighten financial conditions and taking the rate to 3 percent, the highest since November 2008.
It was the first meeting since the short and turbulent premiership of Liz Truss came to an abrupt end two weeks ago, which roiled financial markets.
Through all the tumult in Britain the past few months, high inflation, as well as the threat of it lingering for longer than expected, has remained a consistent scourge for the central bank. The annual inflation rate topped 10 percent in September, the highest in four decades and five times the central bank’s target.
Bank officials have said they are determined to bring inflation down to its 2 percent target and will use higher interest rates to do so. But they also sent a clear message to financial markets that the bank was unlikely to raise interest rates as high as traders had expected, which was about 5.2 percent when the bank set its forecasts in late October.
The Bank of England expects inflation to climb to about 11 percent this year, which is less than it had previously forecast because of a government plan to freeze household energy bills. While the freeze is holding down the headline inflation rate, it could add to price pressures coming from other goods and services, as households have to spend less on their energy bills, the bank said….
https://fred.stlouisfed.org/graph/?g=M26o
January 30, 2018
Real private weekly earnings for United Kingdom, 2007-2022
(Indexed to 2007)
https://fred.stlouisfed.org/graph/?g=NbUe
January 30, 2018
Real Hourly Earnings in Manufacturing for United Kingdom, 2007-2022
(Indexed to 2007)
https://fred.stlouisfed.org/graph/?g=lSy9
January 30, 2018
Manufacturing and Nonfarm Business Productivity, * 1988-2022
* Output per hour of all persons
(Percent change)
https://fred.stlouisfed.org/graph/?g=lSyd
January 30, 2018
Manufacturing and Nonfarm Business Productivity, * 1988-2022
* Output per hour of all persons
(Indexed to 1988)
https://fred.stlouisfed.org/graph/?g=lSwT
January 4, 2018
Manufacturing and Nonfarm Business Productivity, * 2000-2022
* Output per hour of all persons
(Percent change)
https://fred.stlouisfed.org/graph/?g=lSwU
January 4, 2018
Manufacturing and Nonfarm Business Productivity, * 2000-2022
* Output per hour of all persons
(Indexed to 2000)
https://fred.stlouisfed.org/graph/?g=lMaW
January 15, 2018
Real Median Weekly Earnings for men and women, * 2000-2022
* Full time wage and salary workers
(Percent change)
https://fred.stlouisfed.org/graph/?g=lMaX
January 15, 2018
Real Median Weekly Earnings for men and women, * 2000-2022
* Full time wage and salary workers
(Indexed to 2000)
https://adpemploymentreport.com/
ADP National Employment Report: Private Sector Employment Increased by 239,000 Jobs in October; Annual Pay was Up 7.7%
ROSELAND, N.J. – November 2, 2022 – Private sector employment increased by 239,000 jobs in October and annual pay was up 7.7 percent year-over-year, according to the October ADP® National Employment ReportTM produced by the ADP Research Institute® in collaboration with the Stanford Digital Economy Lab (“Stanford Lab”).
BLS report to be released tomorrow at 8:30 am EDT.
https://fred.stlouisfed.org/graph/?g=lQU8
January 30, 2018
Nonfarm business productivity and real compensation, 2000-2022
(Percent change)
https://fred.stlouisfed.org/graph/?g=lQUd
January 30, 2018
Nonfarm business productivity and real compensation, 2000-2022
(Indexed to 2000)
I get it – people who plan to vote for Hershel Walker are rather dumb but check out the lameness of this old hick.
https://www.rawstory.com/trump-supporter-herschel-walker/
Abortion is murder. But Hershel is his man. Oh wait – Hershel is responsible for at least two abortions. But Warnock is a sinner.
Just effing STUPID.
Kevin Drum has been on a tear discussing corporate markups and points to this paper:
https://rooseveltinstitute.org/wp-content/uploads/2022/06/RI_PricesProfitsPower_202206.pdf
Prices, Profits, and Power: An Analysis of 2021 Firm-Level Markups
Mike Konczal Niko Lusiani, Roosevelt Institute, June 2022
Abstract
How to understand and respond to inflation has become one of the central debates of this economic recovery. This research brief is the first to explore the size and distribution of markups (essentially the difference between sales and marginal costs) and profit margins across 3,698 firms operating in the US in 2021. Reproducing and updating the analysis of Jan De Loecker, Jan Eeckhout, and Gabriel Unger’s The Rise of Market Power and the Macroeconomic Implications, we find that markups and profits skyrocketed in 2021 to their highest recorded level since the 1950s. Further, firms in the US increased their markups and profits in 2021 at the fastest annual pace since 1955. Digging deeper, the evidence of this unusually and suddenly high jump in markups fits all three of the main explanatory stories of inflation being debated — namely those related to changes in demand, supply, and market power. First, we see broad markup increases across many types and sizes of firms, suggesting a demand side of the story. Second, the data points to a historically unique movement of markups between industries in 2021, suggesting a supply story. Lastly, we find that, adjusting for size, pre-pandemic markups are a strong predictor of the increase in markups during 2021, suggesting a role for market power as an explanatory driver of inflation. More specifically, a 10 percent higher level of size-adjusted markups before the pandemic is associated with an increase between 1.6 and 2.7 percent in 2021. Since markups are unusually and suddenly so high, there is room for reversing them with little economic harm and likely societal benefit, including lower
prices in the short term, and less inequality and potentially more innovation in the medium term. We believe the evidence presented in this brief points to an all-of-government administrative, regulatory, and legislative approach to tackling inflation that includes demand, supply, and market power intervention
Chicago Booth IGM Survey: “It would serve the US economy well to make it unlawful for companies with revenues over $1 billion to offer goods or services for sale at an “unconscionably excessive price” during an exceptional market shock.”
https://www.igmchicago.org/surveys/price-gouging-2/
Five percent of economists agreed. Once again this seems to be an unconscionably excessive corporate-friendly response. One of the main objections was the word unconscionable, which they thought would be hard to define. IMO such an objection was just a convenient way to weasel out. After all, the objective of such a survey is aspirational. It is not about implementing a law, spelling out specific wording, of defining protocols and procedures for identifying miscreants.
You could be honest for once in your pathetic little life and note the comments such as this one from David Autor:
“This just seems unenforceable at every level. What is unconscionable? Why only companies above $1 bil?”
Several of these economists like the basic idea but worried about how to implement the proposal. And why not address question B which would require publicly traded companies to disclose prices changes on a quarterly basis. That strikes me as a good idea but yea I get it. You think it is a wonderful thing that companies lie to their outside shareholders.
Yes, it is encouraging that a handful of economists agreed with the question, but it was still only 5%. And, yes, there would be implementation issues. But why oppose a good idea just because your imagination is too narrow to see how to solve that problem?
The same result came in response to Question B: “It would serve the US economy well if companies making quarterly SEC filings were obliged to include a tabulation of all price changes of goods or services sold, together with the associated cost changes.”
Nine percent of economists agreed. It appears that most economists aren’t even in favor of having we, the people be informed on how much companies are inflating prices!
Once again this seems to be an unconscionably excessive corporate-friendly response.
“Yes, it is encouraging that a handful of economists agreed with the question, but it was still only 5%.”
I picked Autor to quote because he disagreed. Why on you so incredibly dishonest on everything? DAMN.
“And, yes, there would be implementation issues.”
Hey Johnny boy – do something useful for a change. Tell us specifically how you would implement this proposal. This should be fun.
“Nine percent of economists agreed. It appears that most economists aren’t even in favor of having we, the people be informed on how much companies are inflating prices!”
Gag – what a stupid interpretation of what Question B was about. I guess you have no clue what SEC filings even are.
Autor disagreed with the proposal to make price gouging illegal.
And he strongly disagreed with a proposal to require reporting information that would reveal price gouging.
pgl has trouble reading the results of surveys!!
A less business-friendly response from Autor could have read: “I am for the idea in principle. However, is see the following problems that would need to be addressed…”
David Autor is an excellent economist who does not need a Know Nothing troll like you editing his writings.
Yes, David Autor is excellent economist…but judging from his responses, he has trouble with the whole idea of limiting or exposing corporate price gouging.
“JohnH
November 4, 2022 at 9:50 am
Yes, David Autor is excellent economist…but judging from his responses, he has trouble with the whole idea of limiting or exposing corporate price gouging.”
You have no clue what Dr. Autor thinks. Hint inconsistent piece of trash – he was the economist who documented the China shock. I guess your brain cells have so rotted over time that you forgot that.
BTW – way to duck my challenge asking you to come up with a means for limiting price increases. I figured you would duck as you are too dumb to take up such a task.
Check the one year chart on the federal reserve balance sheet.
qt is being done, maybe not 90b a month but it is moving.
https://www.federalreserve.gov/monetarypolicy/bst_recenttrends.htm
Your are into this one year stuff but come on dude – try writing in ENGLISH. Yea- the monetary base has declined:
https://fred.stlouisfed.org/series/BOGMBASE/
M2 has also declined. Again – what was your “point'” again?
shorter is easier to see movement.
what is % decline from peak m2
and what is 5 increase in m2 since the lockdowns?
and balance sheet seems to rhyme with m2?
is that a feature?
“shorter is easier to see movement.”
Yea but limiting one’s view to a single year can be very misleading. Which I take is your game.
Velocity of M2 Money Stock
https://fred.stlouisfed.org/series/M2V
It was 1.46 in 2018 but dropped to 1.11 two years later. So anyone who still believed in the discredited Quantity Theory of Money might have overestimated inflation when M2 was rising a lot. Yea – many of our Usual Suspects are in this camp even if they likely will deny it.
Later M2 has been falling so these Quantity Theory of Money fools should be predicting deflation if they really believed in their nonsense.
But wait – velocity is near 1.19. Can we say goodby to this worthless discredited dumb idea?