Below consensus, headline m/m at 0.1% vs. 0.3% Bloomberg consensus, and core 0.2% vs. 0.3% consensus. Headline and core m/m annualized inflation in Figures 1 and 2, along with chained, sticky price, trimmed, and PCE.
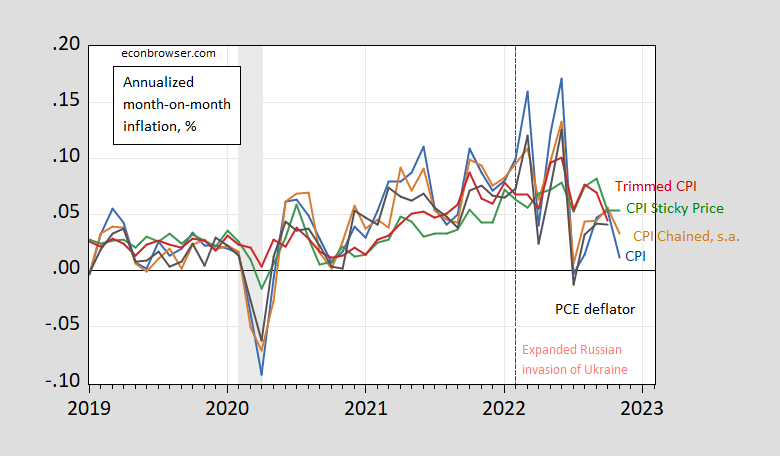
Figure 1: Month-on-month inflation of CPI (blue), chained CPI (brown), 16% trimmed CPI inflation (red), sticky price CPI inflation (green), personal consumption expenditure deflator inflation (black), all in decimal form (i.e., 0.05 means 5%). Chained CPI seasonally adjusted using geometric Census X13 (brown). NBER defined recession dates (peak-to-trough) shaded gray. Source: BLS, BEA, NBER, and author’s calculations.
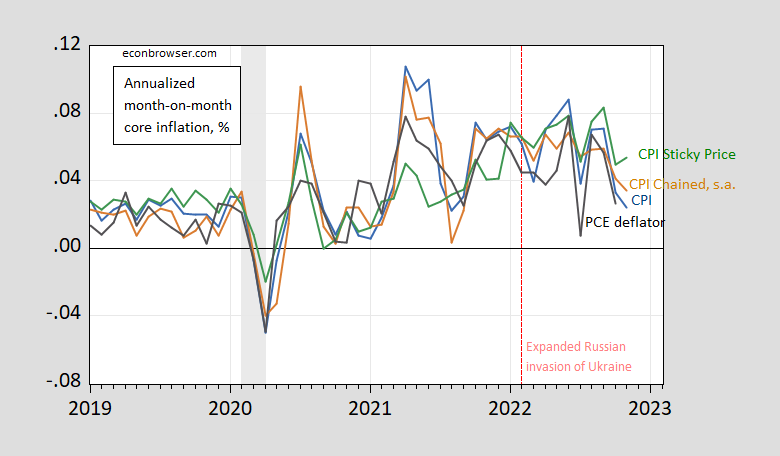
Figure 2: Month-on-month inflation of core CPI (blue), chained core CPI (brown), sticky price core CPI inflation (green), personal consumption expenditure core deflator inflation (black), all in decimal form (i.e., 0.05 means 5%). Chained CPI seasonally adjusted using geometric Census X13 (brown). NBER defined recession dates (peak-to-trough) shaded gray. Source: BLS, BEA, NBER, and author’s calculations.
The CME Fed Watch tool sets implied Fed funds rate to be set tomorrow at 4.27%, down from 4.44% yesterday, while that for the February 1st meeting down from 4.82% to 4.76%, both suggesting a flatter Fed funds trajectory than before the CPI release.
The 2s10s spread increased (became less negative), while the 3m10s dropped slightly – so some steepening at the 2 to 10 year of the spectrum. The 5 year Treasury-TIPS breakeven fell 4 bps.
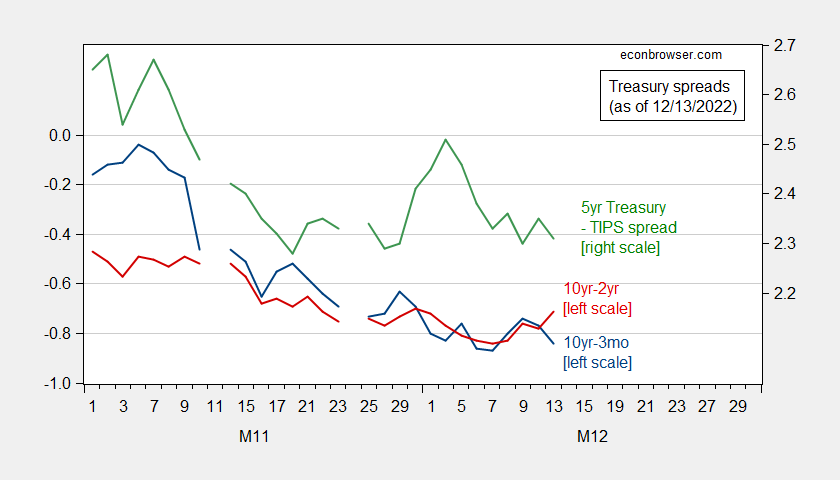
Figure 3: 10yr-3mo Treasury spread (blue, left scale), 10yr-2yr spread (red, left scale), and 5yr Treasury-TIPS breakeven (green, right scale), all in %. Source: Treasury via FRED, author’s calculations.
CEA discussion here.
CPI excluding food and energy, FRED series, CPILFESL represents a monthly contribution of about 78% of CPI All, FRED series CPICAUSL. CPILFESL has two main components, commodities excluding energy, FRED series, CUSR0000SACL1E, and services excluding energy, FRED series, CUSR0000SASLE. The commodities portion represents about 0.21 and the services portion represents about 0.57 of the total CPILFESL contribution to CPI All.
The commodities index portion seems to have peaked in September 2022 at an index value of 167.413. The commodities index portion fell by 0.52 % for the month of November and looks like it could fall by another 0.12% for December.
The services index portion increased by about 0.44% for the month of November, but may increase by only about 0.28 % for December.
If a rough approximation of CPILFESL is attempted, we may see a December weighted contribution to CPI All of about (0.21 x -0.12) + (0.57 x 0.28) = 0.13%, compared to the 0.20% change for November.
Did core CPI actually fall last month? Kevin Drum offers an interesting discussion of what Jason Furman is up to:
https://jabberwocking.com/whats-up-with-rent-inflation/
The official BLS estimate has continued to rise throughout 2022 even though everyone knows that rents have cooled off. This is because BLS uses a methodology that (a) combines new and existing rents and (b) is at least six months out of date because they conduct rent surveys only twice a year. The Zillow index, by contrast, is a simple estimate of asking prices for new rentals over the past month. It shows that rent inflation peaked in mid-2021, fell for six months, and then started falling again in June. As of November, rent inflation was about zero. To account for this, Jason Furman has constructed a measure of core CPI that uses a more accurate index of current rents. The idea behind this is to estimate core CPI with current figures, not old one
Of course Bruce Hall wants to tell us that inflation = 13.3%. Of course he needs to do two things: (a) report inflation as the percentage change from Jan. 2001 to June 2022 (as nutty as that is); and (b) rely on some second hand reporting of CPI from a clown outfit that cannot even report the BLS data properly. Same old Brucie boy!
In other, unmentioned news “Real average hourly earnings for all employees increased 0.5 percent from October to November,
seasonally adjusted, the U.S. Bureau of Labor Statistics reported today. This result stems from an
increase of 0.6 percent in average hourly earnings combined with an increase of 0.1 percent in the
Consumer Price Index for All Urban Consumers (CPI-U).”
https://www.bls.gov/news.release/realer.nr0.htm
Funny that–inflation down, real wages up!
Oh please. Are you still on Cameron’s payroll? FYI troll – the output gap in the UK under Cameron was rather high so they had an aggregate demand downward push on inflation. The US is not below full employment now but as that Stiglitz research ltr just noted has our current inflation being a lot more cost push.
Of course Jonny boy does not need to get basic economics as he is bought and paid for by political hacks like Cameron and of course Putin.
Phillip Jefferson, Governor, Minneapolis Fed: “ High inflation hurts low-income households hardest, and bringing it down is the best way for the Federal Reserve to help bring prosperity to Americans broadly and narrow the economic gaps between demographic groups, a top Fed official said Thursday.
“Low inflation is key to achieving a long and sustained expansion — an economy that works for all,” Fed Governor Philip Jefferson said in remarks prepared for delivery to a research conference on opportunity and inclusive growth at the Minneapolis Fed.”
https://www.reuters.com/markets/us/feds-jefferson-says-low-inflation-key-us-prosperity-2022-11-17/
Of course pgl cares mostly about keeping rates low, which aligns his interests perfectly with those of Wall Street investors. No surprise there.
Wait – wait. Policies to reduce monopsony power do not matter to you? Policies that would strengthen the power of labor unions are irrelevant in your view? God – you are truly dumb.
JohnH,
Oh, so you have finally figured out that real wages in the US are rising? You were going on and on repeatedly very recently about how they were falling due to the high inflation in the US, although I also repeatedly pointed out that you were lying.
Congratulations on stopping lying for once.
Jonny boy does not realize that the macroeconomic conditions in the US today (strong labor market) and the UK macroeconomic conditions under Cameron (weak aggregate demand and large output gaps) were fundamentally different. Yea – Jonny boy is really dumb.
pgl insists on continuing the endless argument…but the fact remains that real wages rose in 2015 after inflation fell to virtually zero after years of 3-5% inflation, during which real wages fell. Then, when inflation rose again, real wages fell.
https://ichef.bbci.co.uk/news/624/cpsprodpb/A79C/production/_103880924_aweinfl-nc.png
Tyler Cowan has some choice words about this: “ The real risk of higher inflation is lower wages… We economists cannot fully explain these circumstances. But they may suggest that employers simply are not willing to agree to higher wages, perhaps due to business uncertainty. And if a labor shortage won’t push them to increase real wages, perhaps a higher rate of inflation won’t either.”
https://jewishworldreview.com/1222/cowen121422.php3
Interesting, isn’t it, that whenever attention is given to labor, there seems to be a profit motive behind it? When inflation is high, rising wages get the blame, even though real wages are falling. Meanwhile, corporations take advantage by raising prices in excess of costs, realizing record profit margins, all the while blaming it on greedy labor. What’s even more interesting is that economists overwhelmingly reject any notion that those who set prices—-Corporate America—might in fact be driving inflation and engaged in profiteering!
Then when the Fed raises interest rates, they whine about how labor would be hurt by higher unemployment…as if they cared! They showed that they could care less when workers were hurt by declining real wages…in fact, the wage recession (real wages back to 2019 level) barely merits a mention in the corporate media and among prominent economists.
The profit motive behind criticizing higher rates and promoting lower rates is simple—asset prices rise when rates are low, enriching Wall Street investors. Corporate profits rise almost immediately. Meanwhile employment rises at a glacial pace. Yet we are told repeatedly that high rates hurt workers and low rates benefit them, while little mention is given to the real beneficiaries.
Same story over and over again…when labor merits any attention at all, there is corporate self interest lurking closely behind. Heads, Corporate America wins; tails, the average American loses.
Liars lie and in your case you defend you lies for years. Do you even realize how BORING you are.
Well, pgl tried yet again to move the goal posts from 2015 to 2008-2014. But I pre-empted him with the link showing average UK wages and inflation from 2008-2018.
Here’s the link again, so that pgl might have the decency to actually look at it: https://ichef.bbci.co.uk/news/624/cpsprodpb/A79C/production/_103880924_aweinfl-nc.png
Yes, real wages declined 2008-2014…when inflation was relatively high. But real wages increased in 2015 when inflation was virtually nonexistent.
Economics dogma leads to a lot of fear mongering nonsense when inflation approaches zero. Krugman: “a deflationary economy, wages as well as prices often have to fall – and it’s a fact of life that it’s very hard to cut nominal wages — there’s downward nominal wage rigidity. What this means is that in general economies don’t manage to have falling wages unless they also have mass unemployment, so that workers are desperate enough to accept those wage declines. ”
https://archive.nytimes.com/krugman.blogs.nytimes.com/2010/08/02/why-is-deflation-bad/
Nothing that Krugman bloviated about happened. When UK inflation approached zero in 2015, wages rose. Employment rose to the highest level since the ONS started keeping track. And the economy experienced a period of growth that was the highest it had been since 2008.
Moral of the story: beware of very serious economics pontificating about the horrors of low inflation. And as inflation in the US cools, we’re starting to see real wages rising again.
As Powell noted at his press conference yesterday, ““My colleagues and I are acutely aware that high inflation imposes significant hardship as it erodes purchasing power, especially for those least able to meet the higher costs of essentials like food, housing, and transportation.”
But for pgl and most other economists it seems that rising interest rates are an evil greater than reductions in purchasing power. For them it’s better to gloss over the fact that declining real wages hurt average Americans. Instead they prefer to talk about how rising interest rates will hurt average Americans. Their dislike of higher interest rates aligns them perfectly with the interests of Wall Street investors, whose wealth gets reduced as interest rates rise, causing asset values to fall.
Well, pgl tried yet again to move the goal posts from 2015 to 2008-2014. But I pre-empted him with the link showing average UK wages and inflation from 2008-2018.
Here’s the link again, so that pgl might have the decency to actually look at it: https://ichef.bbci.co.uk/news/624/cpsprodpb/A79C/production/_103880924_aweinfl-nc.png
Yes, real wages declined 2008-2014…when inflation was relatively high. But real wages increased in 2015 when inflation was virtually nonexistent.
Hey Jonny boy – the NFL is not calling you as your placing the goal posts at the 30 yard line is illegal. You love that line but in every case when you use it – the kiddies are laughing not with you but at you. No – I and Dr. Chinn were not pre-empted by your little graph as both of us know that the return to full employment was what drove that partial return to higher real wages. And as your own graph shows – it did not last long.
BTW – the rest of your drivel is just dumb. Even dumber than that Tyler Cowen pseudo science. Come on troll – you do not know economics but you are THE EXPERT at lying.
Here’s the link again, so that pgl might have the decency to actually look at it: https://ichef.bbci.co.uk/news/624/cpsprodpb/A79C/production/_103880924_aweinfl-nc.png
e
My God – this graph tells the story that only a moron like JohnH could miss. For an entire decade UK inflation exceeded nominal wage growth except for 2 years. The early years under Cameron had inflation exceeding nominal wage growth a lot.
And Jonny boy wants to think Cameron’s fiscal restraint raised real wages? Come on Jonny – no one is THAT STUPID. Except you.
“Nothing that Krugman bloviated about happened. When UK inflation approached zero in 2015, wages rose. Employment rose to the highest level since the ONS started keeping track. And the economy experienced a period of growth that was the highest it had been since 2008. Moral of the story: beware of very serious economics pontificating about the horrors of low inflation. And as inflation in the US cools, we’re starting to see real wages rising again.”
You did not understand a word that Krugman smartly wrote. Hey dumbass – he was talking about the Great Depression. Now as far as the Cameron era, you are still totally misrepresenting what happened during that period. Listen dude – we have enough lying and stupidity on macroeconomics from Princeton Steve. He is stupid and very dishonest but you are far, far worse.
Jonny boy links to something Krugman wrote not noting the date of the discussion: AUGUST 2, 2010 5:33 PM
Jonny boy thinks Krugman was referring to the Cameron fiscal disaster. Seriously Jonny – I get you have no clue what Krugman smartly said but come on dude – he was not talking about 2015. He was referencing the experience from the Great Depression.
But I guess Jonny boy thinks the movie Back to the Future is a documentary.
“Tyler Cowan has some choice words about this”.
Yea I read that rant from Tyler Cowen – who is a rightwing nut case that village idiot often cites. Now you are citing this right wing clown as a progressive economist. I noted to Brucie boy that his hero Tyler is writing junk science. But junk science is what you love to pedal so hey!
LOL, Rosser. Yeah, real wages rose…in November…after months of decline. This means that they’re up to where they were at the end of 2019.
https://fredblog.stlouisfed.org/2018/02/are-wages-increasing-or-decreasing/
But Rosser cheers a month of rising real wages. Better than nothing, I guess.
But cheer is on the horizon…if inflation stays unexpectedly low.
Yeah, real wages rose…in November…after months of decline.
You just described UK real wages under Cameron. Yea Jonny boy – you just mocked yourself. The rest of the kddies have been mocking you for years.
Hey Barkley – Jonny schools us with a graph of UK inflation and nominal wage increases for 2008 to 2018. Funny thing – the graph clearly shows inflation was higher than nominal wage growth by a lot in some years with only a couple of years where nominal wage growth was slightly higher than inflation.
And Jonny boy says Cameron’s fiscal restraint raised real wages? Yea – Jonny boy is dumber than even Bruce Hall or CoRev.
JohnH,
Real wages have been rising since mid year in the US, not just in November. Are you still trying to stick with your previous lie that real wages were falling in the US in recent months?
Well he is still sticking with his phrase of Cameron’s fiscal restraint which he claims raised real wages in the UK. Look at his own link to see how utterly dumb this claim is.
“pgl insists on continuing the endless argument…but the fact remains that real wages rose in 2015”
Jonny boy omits the fact that real wages had declined considerably from 2008 to 2014 – a point Dr. Chinn got to note in a post mocking this dishonest little troll.
Now Barkley – you do know that real wages had declined in prior months and Jonny boy decides to school you for noting one month partial reversal. Of course you were trapping this troll in his own hypocrisy. Well done.
Yes Jonny boy is a two faced liar. Always has been. Always will be.
As expected the inflation increase was temporary because it was driven by temporary forces. Covid supply chain issues are slowly being fixed and Russias invasion of Ukraine has had its effects on energy prices and both use and supplies have adjusted. So we have no real forces that can drive up prices anymore, if anything they are likely to slowly drift down. If the Fed truly is data driven it should announce that this rate hike is likely to be the last for now. They can better afford to wait and see than they can afford to overshoot and quickly reverse.
Nicely said but please repeat it SLOWLY so Putin’s favorite village idiot JohnH can understand.
Bruce Hall recently said a lot of things about consumer prices and inflation (it seems Bruce still cannot get the distinction between the price level v. the rate of change of the price level straight but hey) that sounded to me to be completely bozo. Brucie protests he provided a link but not a link to the BLS or FRED. No he went here:
https://www.rateinflation.com/consumer-price-index/usa-historical-cpi/
First of all this “source” is reporting a version of CPI that differs from the conventional or headline reporting. His source does not clarify this and I know Bruce Hall has no clue what this data is. His source links to the reporting from the BLS of import prices.
It gets worse when one follows the links to see what the goof balls have said about inflation rates. Yep – I would argue Bruce Hall has once again found a completely unreliable source. Now for those of you who are better than this than I am – two queries:
(1) Could anyone figure WTF these clowns are reporting for CPI?
(2) Does anyone know who the clowns that put up this nonsense on the internet.
We know Brucie has no effing clue even if Brucie thinks this link is a better source than the BLS.
Consumer Price Index for All Urban Consumers: All Items in U.S. City Average (CPIAUCSL) – Seasonally Adjusted
https://fred.stlouisfed.org/series/CPIAUCSL
Source: U.S. Bureau of Labor Statistics Release: Consumer Price Index
I want to be crystal clear what data I have been using. Bruce Hall relied on some second hand source which was not clear what they used but their data looks different from the source I relied on. Now I have been looking at Bruce’s source and it very may well be that they pulled the not seasonally adjusted data for some weird reason. But of course neither Bruce Hall nor his little second hand source bothered to tell us WTF they were doing.
Now I leave it to the rest of you – should we rely on seasonally adjusted data or not seasonally adjusted data? Only the grown ups here are allowed to answer as I could care less what a child who serially lies to us has to say.
The BLS report on consumer prices is definitely worth the read:
https://econbrowser.com/archives/2022/12/month-on-month-headline-core-inflation-down#comments
CONSUMER PRICE INDEX – NOVEMBER 2022
The Consumer Price Index for All Urban Consumers (CPI-U) rose 0.1 percent in November on a seasonally adjusted basis, after increasing 0.4 percent in October, the U.S. Bureau of Labor Statistics reported today. Over the last 12 months, the all items index increased 7.1 percent before seasonal adjustment.
The data I used in my little debate with Brucie boy was drawn from FRED using seasonally adjusted data, which is consistent with this opening paragraph. Now the closing of this report does note:
Not seasonally adjusted CPI measures: The Consumer Price Index for All Urban Consumers (CPI-U) increased 7.1 percent over the last 12 months to an index level of 297.711 (1982-84=100). For the month, the index decreased 0.1 percent prior to seasonal adjustment. The Consumer Price Index for Urban Wage Earners and Clerical Workers (CPI-W) increased 7.1 percent over the last 12 months to an index level of 292.495 (1982-84=100). For the month, the index decreased 0.2 percent prior to seasonal adjustment.
The worthless second hand source Brucie relied on for his incoherent rants must have used not seasonally adjusted data. But these clowns could be bothered to tell its users this little detail. Of course Bruce Hall is too lazy and dumb to double check WTF the data he is abusing represented. As I have already said – same old Brucie boy.
Given Dr. CoRev’s interest in agricultural economics and the claims from his good buddies Bruce Hall and JohnH that inflation has to hurt the average worker, this 1986 Journal of International Money and Finance classic (Neutrality of inflation in the agricultural sector by Thomas Grennes and John S. Lapp may be of interest:
https://www.sciencedirect.com/science/article/abs/pii/0261560686900446#:~:text=If%20inflation%20is%20neutral%20with%20respect%20to%20relative,the%20first%20neutrality%20hypothesis%20is%20that%20a%2C%20-0.
The paper considers the effect of inflation on the relative prices of products traded in auction markets. Prices of US agricultural products are used for the period 1951–1981. Since agricultural products are widely traded, the real forces of supply and demand specific to agriculture are represented by foreign agricultural prices. The exchange rate is entered as a separate variable influencing domestic agricultural prices. Trade between the USA and the ten countries included in the Federal Reserve Board’s trade-weighted dollar is considered. The empirical results are consistent with the hypothesis that inflation did not alter relative agricultural prices, when the real forces of supply and demand and the exchange rate are held constant.
Let me put forth a really simple example based on some disinformation from Brucie boy. Let’s say over some 17 month period, the general price index rose by 12.6% (not the 13.3% lie Brucie told us for Jan. 2021 to June 2022). If a soybean farmer’s prices also rose by 12.6% and the cost of his fertilizer and other inputs rose by 12.6%, his real income does not change.
Yea we did see for a while an increase in the relative price of fertilizer but we also saw food prices rising in relative terms. Farmers may have whined about higher input prices appealing to the Bruce Hall fantasy that their nominal income never rose. But grocery shoppers know that it is not true. Now the grocery shoppers might be dumb enough to believe their nominal income did not rise but that does not square with the fact that nominal GDP grew by more than the rise in general prices.
Now I leave it to our host and JohnH to debate what happened to real wages. Jonny boy has a talent greater than Bruce Hall in terms of cherry pick data and dates to the point that even our host’s incredible efforts may not be keeping up with these disinformation campaigns.
But of course most people who have studied economics understand the proposition that general inflation is neutral even in a world where relative price changes occur. But do not bother to tell Bruce Hall any of this as the little boy’s agenda is disinformation 24/7.
Macrotrends reports on a lot of things including inflation rates in various nations such as India:
https://econbrowser.com/archives/2022/12/month-on-month-headline-core-inflation-down#comments
Inflation as measured by the consumer price index reflects the annual percentage change in the cost to the average consumer of acquiring a basket of goods and services that may be fixed or changed at specified intervals, such as yearly. The Laspeyres formula is generally used.
India inflation rate for 2021 was 5.13%, a 1.49% decline from 2020.
India inflation rate for 2020 was 6.62%, a 2.89% increase from 2019.
India inflation rate for 2019 was 3.73%, a 0.21% decline from 2018.
India inflation rate for 2018 was 3.94%, a 0.61% increase from 2017.
The writing here is pretty good even if it is completely different from how Bruce Hall would report this data. First of all macrotrends properly cites as its data source the World Bank. Brucie relies on some goof ball second hand source that forgets to tell us they use not seasonably adjusted data. Then there is “Inflation as measured by the consumer price index reflects the annual percentage change in the cost to the average consumer of acquiring a basket of goods and services that may be fixed or changed at specified intervals, such as yearly.”
Bruce Hall makes up intervals such as 17 months rather than reporting annualized rates of changes. Brucie also does not know the difference between the price level and the rate of change of the price level (inflation). Note for example the 2019 inflation rate = 6.62%, which indeed represented an increase of 2.89% from the previous year. Brucie would tell us inflation rose by 6.62%. No the price level rose by 6.62% but the rate of change of the price level rose by less 3%.
OK macrotrends hired someone who passed 1st grade writing which is good for them. They would not hire Bruce Hall as his writing skills suck.
https://www.macrotrends.net/countries/IND/india/inflation-rate-cpi#:~:text=India%20Inflation%20Rate%20-%20Historical%20Data%20%20,%20%200.61%25%20%2058%20more%20rows%20
Darn it – please use this link. Correcting the numerous errors of Bruce Hall has cost me a bit in terms of appropriate links.
No surprise with the 10/30 year drop, consumer demand is stimulating, yes in re as well. The Fed is irrelevant to the consumer. The Feds relevance to interbank lending is its only effect. But raising rates doesn’t necessarily slow the economy down. Past reversions were triggered by financial crisis. This is simply market rejection Of the feds story. They see the inflation story as over and acted.
‘Nothing that Krugman bloviated about happened. When UK inflation approached zero in 2015, wages rose. Employment rose to the highest level since the ONS started keeping track. And the economy experienced a period of growth that was the highest it had been since 2008.’
JohnH in a comment above linked to a very good discussion by Krugman that noted the debt deflation theory James Tobin noted in his excellent discussions of the Great Depression. Obviously Jonny boy clearly did not understand a word Krugman wrote but Jonny boy decides to go back to his defense of the Cameron era that Dr. Chinn already took down. I link to real GDP in the UK to show what a liar Jonny boy is.
https://fred.stlouisfed.org/series/CLVMNACSCAB1GQUK
Dr. Chinn already noted that the UK economy was closing a really large output gap, which is confirmed by this FRED graph. But no Jonny – the highest annual growth rate was 2013 not 2015. Now you claim you use ONS data. FRED does too. One difference – FRED accurately portrays this data. Jonny boy misrepresents the data routinely as he demonstrates that his macroeconomic stupidity is even worse than that shown by Princeton Steve.