A week and a half ago, Kevin Drum noted earlier the disjuncture between job creation as measured by the household survey (civilian employment) and establishment survey (nonfarm payroll employment). My conclusion was that the empirical evidence suggested putting most — if not all — weight on the establishment survey. Now, Torsten Slok compares the declines in response rates in the two surveys. The comparison further buttresses the case for using the establishment series.
Slok writes:
Survey response rates for employment and inflation have declined significantly during the pandemic, and this is introducing substantial measurement errors and uncertainty, see chart below. One such example is the widening gap between the establishment survey and the household survey in the employment report, with the establishment survey showing 2.6 mn jobs created over the past eight months and the household survey showing no job growth over the same period. …
Here’s the figure (where I’ve added a red line at March 2022, 8 months ago).
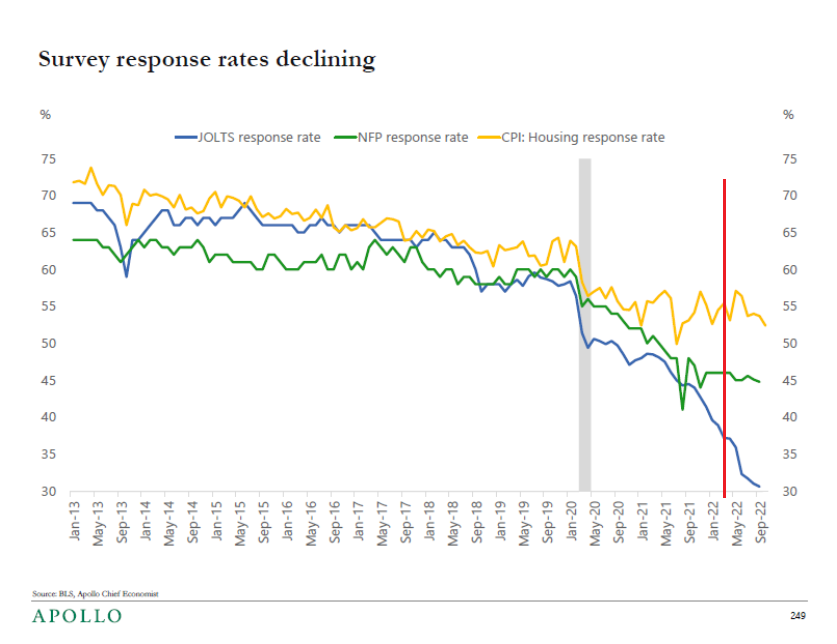
Source: T. Slok, 13 December 2022. Red line at March 2022.
Note that the household response rate relative to establishment rate drops precipitously starting around October of last year. The gap yawns more rapidly starting after March. And here’s the picture of the gap between nonfarm payroll employment and civilian employment adjusted to the NFP concept (this is a research series).
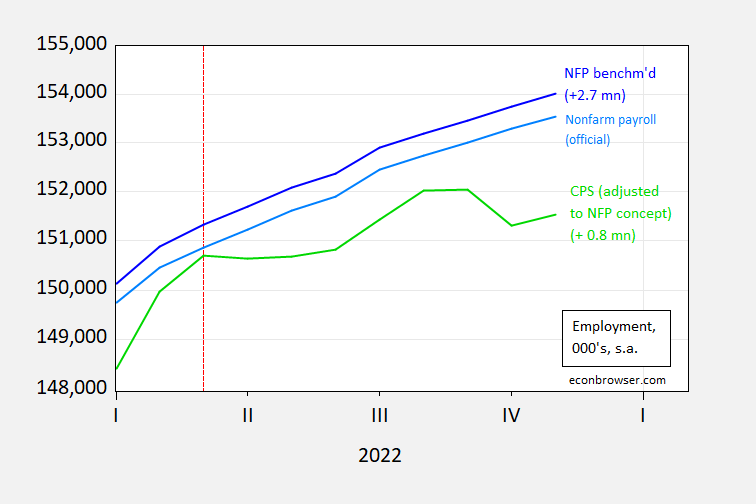
Figure 1: Nonfarm payroll employment official (sky blue), nonfarm payroll employment implied by preliminary benchmark (dark blue), and civilian employment adjusted to NFP concept (green), all seasonally adjusted, in 000’s. Figures in (parentheses) are net new jobs in millions, since 2022M03 (indicated by red dashed line). Source: BLS via FRED, and author’s calculations.
The gap in numbers widens exactly at the time the household response rate drops.
So: (1) I put more weight on the establishment series, and (2) the gap between the two series is more likely due to increasing, and biased, measurement error in the household series, rather than, for instance, primarily increases in multiple-job holders.
When over half your sample refuses both surveys, how huge are your error bars?
Errors stemming from refusals typically adds to non-sampling bias error rather than sampling error, and thus can be invisible to the error bars. I don’t know what kind of post-stratification or weighting the household survey does (if any) to attempt to address non-response. Anyone know?
‘The fox knows many things, but the hedgehog knows one big thing.’
rsm misunderstands one little thng.
Good one, MD.
Slok suggests that the divergence between the household and establishment surveys is the result of a response problem, but he doesn’t offer any evidence. The fact that the decline in response rate accelerated at the same time as the divergence increased adds to the case, but Slok didn’t make that observation – Menzie did. Here’s Slok’s very short post:
https://apolloacademy.com/the-daily-spark/
Slok also neglected to mention that the drop in response rates is only true for the first sample. Revised data are based on additional samples, and the response rate as of the second revision to the payroll survey has averaged 93.5%. That’s the highest response rate for any year since 2017. Since we are looking at a divergence which persists after revisions, we may not want to blame response rates.
Here are the data for the payroll survey:
https://www.bls.gov/web/empsit/cesregrec.htm
Can’t find anything on revisions for the household survey, but the most recent response rate, for October, was 72.2%, down from historic rates for this survey, but quite high for a household survey:
https://www.bls.gov/osmr/response-rates/household-survey-response-rates.htm
Poor, sad rsm needs to think (sic) again about his “over half” assertion.
“Seems to be mean reversion of multiple job holders.” writes Princeton Steve not realizing the mean in question = 5% while the current reading = 4.9%. Stevie never learned to do preK arithmetic.
https://rooseveltinstitute.org/wp-content/uploads/2022/12/RI_CausesofandResponsestoTodaysInflation_Report_202212.pdf
December, 2022
The Causes of and Responses to Today’s Inflation
By Joseph E. Stiglitz and Ira Regmi
EXECUTIVE SUMMARY
Over the last couple years, the world has experienced the highest levels of inflation in more than four decades. There are multiple sources of economic disruption that have likely contributed to this inflation, most notably pandemic shutdowns and reopenings and Russia’s invasion of Ukraine. The inflation, in turn, has sparked a debate about its causes, with some claiming it is demand-induced, largely the result of high spending in response to the pandemic. Others focus on pandemic-induced supply shortages and demand shifts, possibly exacerbated by market power and market manipulation. While there may be elements of all of these, the policy response needs to address the dominant cause. If it’s a result of excessive aggregate demand, then monetary policy—reducing aggregate demand through monetary tightening—is appropriate. If it’s largely supply-driven, a more tailored response is required, including fiscal policy that alleviates the supply constraints.
Our analysis concludes that today’s inflation is largely driven by supply shocks and sectoral demand shifts, not by excess aggregate demand. Monetary policy, then, is too blunt an instrument because it will greatly reduce inflation only at the cost of unnecessarily high unemployment, with severe adverse distributive consequences. This paper presents a variety of fiscal and other policy measures that hold out the prospect of having a more significant effect on inflation. In particular, these measures would reduce inflation’s impact on the most vulnerable and provide long-term benefits to the economy without the likely high costs of excessively rapid and large increases in interest rates.
We look at both the aggregate and sectoral-level data, and show, notably, that real personal consumption has largely been below trend, particularly in the periods when inflation heated up, and total real aggregate demand has been consistently below trend, which reinforces the conclusion that the “problem” arises from the supply side. With three fiscal quarters of anemic growth, from the fourth quarter of 2021 to the second quarter of 2022, it is hard to see how excess demand by itself could be at the root of the problem. Moreover, inflation in the United States is no worse than in other countries even as Americans saw a more robust recovery, largely because we had more fiscal support. A sectoral breakdown of inflation, as well as a closer look at the patterns in the timing of inflation, further support the conclusion that excessive spending during the pandemic is not the principal cause of today’s inflation.
Breaking down inflation by sector reveals that it is tied to the obvious shocks and supply chain interruptions the economy has experienced, from high food and energy prices to the shortage of microchips for automobiles.
We also explain how the large pandemic-induced shifts in demand, such as those associated with housing, have contributed to today’s inflation.
Another important factor is the increase in market concentration, which has generated greater market power; the current circumstances have provided a prime opportunity for a greater exercise of that market power.
https://english.news.cn/20221209/5be7c78ffc654759beb43f8d6701bf38/c.html
December 9, 2022
China’s consumer inflation eases, factory prices likely to recover
BEIJING — China’s consumer inflation tempered in November as market supply increased, while factory-gate prices showed signs of bottoming out with month-on-month improvement, official data showed Friday.
The consumer price index (CPI), a main gauge of inflation, rose 1.6 percent year on year in November, down from the 2.1 percent uptick in October, the National Bureau of Statistics (NBS) said Friday.
On a monthly basis, the CPI edged down 0.2 percent, affected by domestic COVID-19 outbreaks and seasonality, noted Dong Lijuan, a senior statistician with the NBS.
Food prices reversed the 0.1 percent gain in October to fall 0.8 percent month-on-month, lowering the monthly consumer inflation by about 0.14 percentage points, according to the data.
Specifically, the price of pork, a staple meat in China, edged down 0.7 percent in November from the previous month. Authorities have been releasing pork from the central reserves in recent months and hog production kept rising, Dong said.
Prices of fresh vegetables fell by 8.3 percent, compared with the 4.5 percent month-on-month drop in October, thanks to sufficient supply underpinned by good weather conditions, according to Dong.
Overall, the decline in food prices is mostly the result of ample supply rather than COVID-19 outbreaks, Wen Bin, Chief Economist with China Minsheng Bank, said in a co-authored research note.
Non-food prices rose 1.1 percent from a year earlier, unchanged from October. The prices of gasoline, diesel, and liquified petroleum gas went up by 11.4 percent, 12.3 percent, and 4.6 percent year on year, respectively….
‘today’s inflation’ has accomplices expanding m2 and large qe, that ran too long.
even though we shun qtr and Milton Friedman.
today’s inflation, may not be the big worry.
You are dumb. Milton Friedman never bought into that Quantity Theory of Money BS.
f in reading….. what you want the words to mean is not what you got.
Anonymous: For a person who does not usually write in syntatically correct phrases, I find it amusing that you are critiquing somebody’s knowledge of the English language.
pgl,
Huh? Well, this does mean what one means by “believe in the Q theory of M.” For quite a few decades from the 1950s through the 1970s Friedman argued that indeed V was more stable than other major macro variables and thus did advocate having M1 or maybe M2 grow at a steady rate. However, he would later accept that stability of velocity of all the various money measures broke down and so he would move to advocating inflation targeting through use of interest rates later on.
But, he arguably did “believe in the quantity theory of money” for at least some period of time, at least some version of it.
Of course, Anonymous is being incoherent here, with velocity of M2 currently just completely unstable.
What inflation???? Once December comes in, some of you guys need to move on 6 months is key trend timline. When there is nothing left as next June is replaced, what then????
Interesting, but here are my questions:
1. What happened with relative response rates in 1999-2000?
2. What happened with relative response rates in 2006-07?
Until we know how these behaved during previous periods of jobs deceleration, plucking out this one datapoint may just be confirmation bias. My working hypothesis would be that a decline in response rates is not random, but rather due to households with bad news not reporting, and so is asymmetric.
My theory is that previous periods are not going to inform us about response rates at this time.
I base it on the record-low unemployment rate: When the boss has to work, rather than fill out surveys, because he can’t find enough employees, response rates will fall.
Let me say again, the response rate is low for the initial release of payroll employment data, but not for the revised data. The divergence between payroll and household data persists after the revisions we have so far. Slok is probably barking up the wrong tree.
I don’t know, but Slok strikes me as a pretty sharp cat. Not one to go missing things.
Both were period of over investment. Not this time. My guess real consumer spending which stopped growing between February-September is probably a better bet why household employment slowed. My guess it picks back up again after October’s surge. Not the first time in the series this has happened. I can speak to my own company, we didn’t hire enough this holiday. Period. So we are scrambling into Christmas downtime. Why consumers delayed purchases was pretty evident. Corporations overhiked prices. New car sales are gonna surge next year as new prices start to fall bringing in buyers. What recession???
Payroll survey response rates dipped from 1999 through 2002 for all three surveys, rose in 2008 and remained elevated for some years in all three surveys.
Don’t know about the household survey, since the only data I can find start in 2012.
Any survey dependent on calling people or even knocking on their doors is going to have problems going forward. People have door cameras and don’t respond to anyone they don’t know. Their phone systems often block calls from people they don’t know. So the response rates will be lower and there will be a bias in responses in favor of older and less tech savvy people.
https://www.nytimes.com/2022/12/14/business/economy/uk-inflation-prices.html
December 14, 2022
Britain’s Inflation Rate Dips From a Four-Decade High to 10.7 Percent
The pace of price rises in November edged lower, from 11.1 percent, but households are still being squeezed as wages fail to keep up.
By Eshe Nelson
Britain’s inflation rate eased away from a 41-year high on Wednesday, but the slowdown brings only limited relief to a nation gripped by a deep cost-of-living crisis.
Consumer prices in Britain rose 10.7 percent in November from a year earlier, bringing the rate of inflation down slightly from 11.1 percent in October, which was the highest annual rate since 1981, the Office for National Statistics said.
Despite this tentative sign that inflation might have peaked, British households are being squeezed by high energy bills, food costs and mortgage rates, while wage growth is failing to keep up with inflation. Britons are facing a sharpest decline in living standards over the next two years in records dating to the mid-1950s, which is prompting a growing wave of labor unrest. Railroad and postal workers are on strike on Wednesday over demands for higher pay, while nurses are set to walk off the job on Thursday….
Among G20 countries, 4 showed lower real wages in 2022 than in 2008: United Kingdom, Italy, Japan and Mexico. * Economic policy in the UK since 2008 strikes me as having been especially unfortunate for ordinary families. Jeremy Corbyn as head of Labour suggested important policy changes, but Corbyn was replaced as Labour head and is actually being removed from Labour after decades representing the Party in Parliament.
* https://www.ilo.org/wcmsp5/groups/public/—dgreports/—dcomm/—publ/documents/publication/wcms_862569.pdf
“Among G20 countries, 4 showed lower real wages in 2022 than in 2008: United Kingdom, Italy, Japan and Mexico.”
And JohnH just today touted his thesis that Cameron’s regime raised real wages by keeping inflation down with a large output gap!
pgl thinks that the UK’s inflation of the early 2010s was caused by austerity. Go figure!
And what does the recent drop in UK real wages have to do with the real wage increases of 2015? Naturally pgl fails to notice that inflation in the UK is currently running in excess of 10%, which easily explains why real wages have dropped so much recently.
https://fred.stlouisfed.org/graph/?g=RyAn
January 30, 2018
Real Hourly Earnings in Manufacturing for United States, United Kingdom and Germany, 2007-2022
(Indexed to 2007)
https://fred.stlouisfed.org/graph/?g=WKJS
January 30, 2018
Real Hourly Earnings in Manufacturing for United Kingdom, 2007-2022
(Indexed to 2007)
German real wages were doing great until recently. Of course real economists knew that. UK real wage performance lagged US real wage performance. Shhh – please do not tell JohnH as this fact will make him all angry again.
But thanks – great information!
Historically German inflation has been well below UK inflation…but according to pgl inflation has nothing, absolutely nothing to do with real wages.
Yesterday Andrea Mitchell interviewed Dr. Fauci and the issue of hydroxychloroqine came up. As it turns out it hit me who that insane supply-sider that defended Reagan’s tax cuts and who is also a Vdare racist. Moses had discovered that those scary Upper East siders known as the “Young Republicans” love the presence of the Vdare founder. The clown I had to deal with 40 years ago is Paul Craig Roberts who still calls himself an economist and who has a website where you can read his history of writing utter BS:
https://www.paulcraigroberts.org/2020/08/03/hydroxychloroquine-one-more-time/
It is a proven undeniable fact that if given early, hydroxychloroqine (HCQ) given with azithromycin and zinc will cure coronavirus. It is a proven undeniable fact that hydroxychloroquine is safe. It is an approved medicine and has been in use for 65 years with an outstanding safety record.
His writings on economics are just as absurd. But he gets along with Lawrence Kudlow for obvious reasons.
@ pgl
I thought this was interesting. Honestly I had no idea which of Menzie’s threads to put this in, and I wasn’t about to relegate it to the space under 9 of “ltr’s” prattles. Curious your or anyone else’s thoughts on it:
https://www.politico.com/news/magazine/2022/12/16/washington-post-fred-ryan-self-demolition-00074241
There’s a journalist I follow closely named Ziva Branstetter. I think she is one of the best journalists in her profession. She left WaPo recently after prior claiming it was her dream job. So I was left wondering “Why??–Why does someone leave what they had stated before was their dream job??”. Now I’m wondering if there’s any connection here. The answer is that the culture of WaPo has drastically changed under amoral sociopath Jeff Bezos, who has zero business owning a major newspaper.
How does Putin react to the following news? The picture tells the story. Putin enjoys his champagne:
https://www.msn.com/en-us/news/world/in-just-24-hours-russia-loses-over-700-soldiers/ar-AA15gapL?ocid=msedgdhp&pc=U531&cvid=afbbf3e7351741aeb956e994ac940e46
Russia has lost a total of 96,000 soldiers – 740 alone within the last 24 hours. There are also 5,937 armed vehicles (+7), 4,562 (tank) vehicles (+13), 2,970 tanks (+4) and 171 special equipment (+1). Russian losses remain the same in artillery systems, 1,931, drones, 1,617, multiple rocket launchers, 404, aircraft, 281, helicopters, 264, and boats, 16.
404 multiple rocket launchers…… context.
the unclassified number of us himars is 540 launch vehicles, in 10 battalions, a couple in the usmc.
the unclassified new nat’l defense auth act (raise an army) would raise the us # of himars to ~700
bigger dod spending to come
and the con ops of artillery, tubed or otherwise is ‘shoot and scoot’
I understand that the Russians are not so good at the scoot part – which would explain their large losses. Russia is already desperate to try and replace their losses of everything. They have continued to barging for Iranian drones even as they are being shot down at a rate of over 90%.
We are moving towards a WW1 scenario where the war ended after one side realized they had no way of producing/procuring what was needed to even hold their frontline positions – and gave up rather than suffer a humiliating and destructive military defeat. What they got was a humiliating and destructive peace agreement. However, that peace agreement laid the foundation for Nazies and WW2.
i am not aware that was how ww i ended…. seemed to me there was a coup and the kaiser was deposed.
a 90% success rate is spectacular… with a complex, donated kill chain operated and maintained with neophytes running it.
https://www.nytimes.com/live/2022/12/14/business/fed-interest-rates-inflation#interest-rates-inflation-fed
December 14, 2022
Federal Reserve officials slowed their campaign to cool the economy at their meeting on Wednesday, but they also signaled that they expect inflation to prove more stubborn that they had previously expected and indicated that they expect to raise interest rates by more next year than they had initially forecast.
Policymakers voted at this meeting to raise borrowing costs by half a percentage point, a pullback after four straight three-quarter point moves. Their policy rate is now set to a range of 4.25 to 4.5 percent, the highest it’s been since 2007.
— Jeanna Smialek
Disgusting behavior from the Russian troops in Ukraine:
https://www.ibtimes.com/russian-soldier-admits-comrades-raped-ukrainian-women-reveals-rambo-syndrome-3638768
A Russian soldier recently admitted that some of his comrades have raped Ukrainian women in occupied territories amid the war. Speaking with the independent online newspaper The Insider, Russian soldier Nikita Chibrin of the 64th Motorized Rifle Brigade said four of his comrades raped a mother and daughter when they were occupying the village of Andriivka in Kharkiv Oblast.”There was a case in Andriivka when a mother and daughter were raped. Four guys did it. One ran away, the rest were beaten with stools by their fellow soldiers and commanders. They wanted to be shot,” Chibrin said in the interview. “They couldn’t be blamed because there was no evidence, so they were just discharged, let go.”
We have seen reports of Russian soldiers raping Ukrainian women many times. Each time I note this I challenge JohnH to either condemn these war crimes or admit he actually enjoys this garbage. JohnH has yet to say a negative word about are horrific war crimes.
The implication of your analysis would then seem to be that there is no recovery in multiple job holders to pre-pandemic levels, per this: https://fred.stlouisfed.org/series/LNS12026620
Why not? What’s your logic? Has the job market changed structurally?
Steven Kopits: No, that is not my point. As was highlighted earlier (please don’t make me dig up the comment), the increase in multiple job holder predated the divergence in NFP and household series, and furthermore, basic math showed that it could only account for minority of the divergence. Man, you are obtuse.
Macroduck already noted to Stevie this timing problem with his nonsense idea. I tried to do the basic arithmetic. The absolute growth in multiple job holdings this year was a mere 175 thousand whereas the payroll survey rose by 3.8 million. As I have noted many times – Stevie cannot do even 1st grade arithmetic.
You are arguing that the household survey is wrong — not reliable — because the response rates have declined (which really started in 2018 as I interpret the graph). Okay, so how unreliable is it, other than casting unfounded aspersions? How do you know how big the bias is, and in what direction? Show us the numbers. Support your case.
At this point, the increase in multiple jobs vs incremental workers is necessary to rebalance multiple job holders back into pre-pandemic norms. If you’re saying that increasing jobs really represents increasing workers, then the share of workers with multiple jobs must be increasing ore slowly than shown, no?
Personally, I see no reason to think that an economy with 3.7% unemployment and an aging population would not be at full employment and that such residual job additions as are occurring reflect a return of multiple jobs to pre-pandemic levels.
But go ahead, show us the math.
Steven Kopits: We have a number of real experts weighing in on this general question of establishment vs. household surveys. As noted earlier, Furman, 2016 and CEA, 2017 place almost total weight on the establishment series. A more formal analysis showing almost total weight on initial establishment series for real time analysis is provided by Goto, Jacobs, Sinclair and van Norder (2021). (As an aside, if I look at the final data for NFP and the adjusted household series, statistically the adjusted household series seems to respond to gaps between the two series, while the NFP series does not; formally, the adjusted series responds to an error correction term.)
See also this post for my explanations for why establishment seems more reliable than household this time around.
‘But go ahead, show us the math.’
This from someone who tried to explain a 3.8 million difference with another series that increased by a mere 175 thousand? Stevie – do not remind us how much your abilities at basic arithmetic sucks!
Steven Kopits: I show the math, here.
Keep ’em coming. I am going to use all these examples in my stats course this coming spring.
New post just for you. BTW – we already showed you the math. So do us all a favor – stop being a JERK.
https://fred.stlouisfed.org/graph/?g=lpO2
January 30, 2018
Multiple Jobholders as a percent of Employed, 1994-2022
(Indexed to 1994)
Some Price Cap Graphs, Thoughts on Russian Strategy
https://www.princetonpolicy.com/ppa-blog/2022/12/13/some-price-cap-graphs-thoughts-on-russian-strategy
Get a clue – no one here is guying to hire you as a consultant. And no one where appreciates your wasting our time with your promotion of your worthless blog.
Interestingly, this is my most reader post to my email list.
Yea I bet all those MAGA racists loved it.
Steven,
You may not be right here, but this is the topic where you are better informed than on others you comment on. This is what you should stick to, not macroeconomics where you regularly fall embarrassingly flat on your face.
Is the Kopits versus macroeconomics thing kinda like the Rosser versus Russian geopolitics thing?? Or is Kopits riding his hobby horse better than you??
Moses,
Do please lecture us again on how Russia managed to station troops in a NATO country (Romania, its southest part) in order to invade Ukraine, please please please, pretty please.
the question in my pea brain is: who is selling (satisfying the demand [in a micro sense]) the oil the ruskies can’t afford to sell?
OK I read your latest bizzaro rant and here is the only take away I could get from your horrific writing:
We place the fiscal breakeven for Russia at around $80 / barrel in September, as that is the point at which Putin called for production cuts. That is, when Urals fell back below $80, Moscow was looking for price support. Therefore, based on observed behavior — not a calculation of Russian budget requirements — we can make a case for an $80 Urals fiscal breakeven for Russia in September. In our view, this breakeven has probably risen since then, perhaps materially (and our breakeven assumes normal levels of oil and gas exports from Russia).
Let me get this straight – since Putin needs his oil prices to be $80 per barrel then this drives the world oil market? Now maybe you did not mean to imply this bizarro claim but if not – your writing is truly the most worthless trash I have ever read. Dude – we speak English here. Learn the damn language.
https://econbrowser.com/archives/2022/12/do-foreign-yield-curves-predict-us-recessions-and-gdp-growth
December 13, 2022
Rashad Ahmed adds an update to account for current data:
Using data available as of December 13, 2022, our model * forecasts a recession probability within the next 12 months of 68.1%. This is up from a probability of 42.5% taken August 15, 2022. For context, the median recession probability from the model was 16.7% over the 1979-2021 period and even lower when excluding recession periods. A reading as high as 68.1% had a false positive rate of 1.7 percent and a true positive rate of 59 percent between 1979- 2021. In the 6 recessions since 1979 to 2021, a reading of 68.1% or higher was virtually always followed by a recession.
* With Menzie Chinn
Did Tyler Cowen learn economics from JohnH and Bruce Hall?
https://www.bloomberg.com/opinion/articles/2022-12-13/higher-inflation-target-could-bring-lower-wages?sref=htOHjx5Y&leadSource=uverify%20wall
The Real Risk of Higher Inflation Is Lower Wages
Setting an inflation target of 4% may make it easier for the Fed to fight a recession, but it could make things harder for workers.
I get Brucie loves Tyler Cowen but this oped is dumb than rocks unless one is a Vulcan mind meld between Brucie and JohnH.
Funny! pgl can’t seem to process the very basic idea that reduced purchasing power (inflation) is closely related to reduced real wages. I mean, how dumb can you get?
Kopits: “Seems to be mean reversion of multiple job holders. So, no net new employees,”
I fail to grasp the implication that multiple jobs are somehow not real jobs. Employers most certainly have more employees working for them regardless of whether they were previously unemployed or have second jobs.
If there is any correlation, it seems that multiple jobs increases with an improving economy. Employers need more employees and make better offers and employees are willing and able to take a second job.
I did not say second jobs are not real jobs. But I think the majority are probably in the min wage type category. Nothing wrong with that. But rising second jobs might help explain how GDP in H1 call fall with increasing jobs, that is, the roll off of the stimulus was insufficient to counteract the gains of second job holders. I don’t know if that’s true, but it seems plausible to me.
Of course the actual math shows your claim is really dumb. Which for you is par for the course.
Yes, but…
Or, since we’re talking economics “On the other hand…”
Multiple job holders typically work in low-wage jobs. Increases in wages at the low end, which we’ve seen a good bit of since the recession, would reduce the need to take multiple jobs. So would demanding or being offered longer hours at a single job. The old “backward-bending labor supply curve.
There are reportedly, as of July, 2 million potential workers not in the labor force because of pandemic risk. Not quite sure how that figures in multiple job holders, but it certainly helps boost wages.
Stevie does not do labor economics. Stevie does self promotion to the MAGA racists.
https://fred.stlouisfed.org/graph/?g=oRII
January 30, 2018
Multiple Jobholders as a percent of Employed, 2000-2022
(Indexed to 2000)
https://fred.stlouisfed.org/graph/?g=pG4i
January 4, 2018
Employed Part-Time for Economic and Noneconomic Reasons, 2000-2022
(Indexed to 2000)