Based upon the working paper by Jan Eeckhout (UPF Barcelona), here’s the PCE inflation rate up to December:
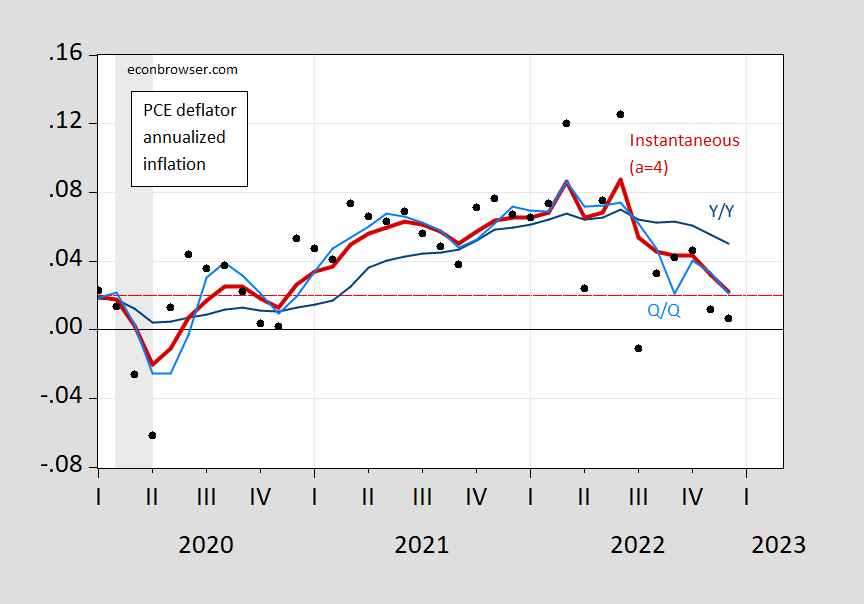
Figure 1: Year-on-year PCE inflation (blue), quarter-on-quarter (sky blue), month-on-month (black circle), and instantaneous inflation (T=12, a=4) (bold red), all annualized. NBER peak-to-trough defined recession dates shaded gray. Red dashed line at 2%. Source: BEA and author’s calculations.
Note that the instantaneous rate (a=4, tau=12) tracks the Q/Q inflation rate pretty well.
The instantaneous inflation rate upweights the most recent observation. How does this compare with alternative measures that attempt to track trends.
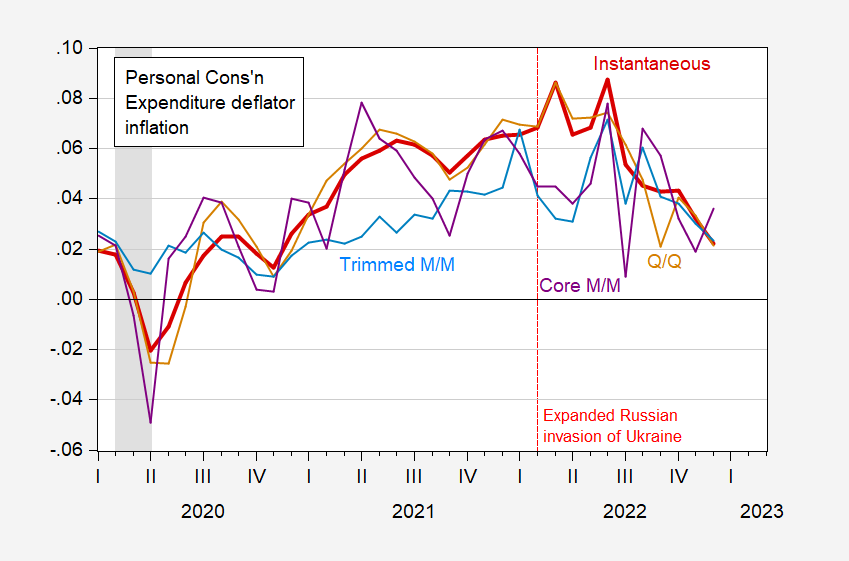
Figure 2: Instantaneous PCE inflation (a=4, T=12) (bold red), Q/Q inflation (tan), 16% trimmed mean M/M inflation (sky blue), and core M/M (purple), all annualized. NBER peak-to-trough defined recession dates shaded gray. Source: BEA and author’s calculations.
Interestingly, neither core m/m nor trimmed mean m/m tracks particularly well instantaneous inflation (a=4, T=12); different values of a might lead to different outcomes (a=infinity is full weight on most recent observation, a=0 is equal weights on all tau observation, a=1 is linearly declining weights).
What’s clear is PCE inflation measured with high weight on the most recent observation is declining, as I noted on Marketplace on Friday.
https://www.msn.com/en-us/news/politics/gop-rep-jim-jordan-spars-with-chuck-todd-over-classified-docs-and-fbi/ar-AA16SaRd
Jim Jordan goes onto Meet the Press to lie and lie about the classified documents issue. But wait – Tim Russett no longer this show so Jordan get the facts slammed back into his lying face. Nice job Todd.
Apparently, it’s SOP for Democrats to secret classified docs in unsecure garages [with access to a crack head in the employ of the CCP] and CCP-funded think tanks for seven or eight years.
Glad they let you get a word in during their short presentation.
It would be nice if NPR had an hour long economics roundtable show. But I’m guessing between ratings demands and placating the “woke” crowd ideas like that barely even see the light of day. So we end up with garbage programming”Freakonomics” which is the intellectual equivalent of “Friends” repeats or “Big Bang Theory” with canned laughter for to tell the 12-year old maturity 30 year olds when they are supposed to laugh. Lots of NPR is PSEUDO-intellectual, but if anchors talk in a snob northeast accent nobody notices.
“Current practice to measure inflation for monetary policy uses the average annual inflation rate. When inflation changes fast, whether increasing or decreasing, the annual average rate is biased towards data too far in the past and conveys the true price level with six months delay. I propose to use instantaneous inflation as a more adequate measure of the price change. The measure trades off noise in the data with the precision of the instantaneous price change. Using the latest inflation numbers that instantaneous inflation in the US and the Eurozone is back to the
target of 2% and that the high inflation period is over. This is not so for the UK, Japan and Australia.”
Consistent with what Blinder recently said. Now we tried to get Bruce Hall to actually read Blinder’s excellent piece but Brucie clearly did not.
Now I guess the continuing high inflation in the UK and Australia is all Biden’s fault.
‘Other countries. Turning to difference currency areas, we see inflation in the Eurozone remarkably mirrors what happens to price in dollars in the United States. The monthly reading for inflation in December 2022 was negative and instantaneous inflation is falling fast. It has not reached 2% yet (it is closer to 4%) but it is substantially lower than the conventional inflation measure which is at 9.2%.’
Good news for the Eurozone. Does anyone know how the Germans, French etc. have managed to get inflation down? Have they resorted to some sort of tight macroeconomic policy regime?
January 2019:
Gasoline was $2-something [$3.39].
Eggs were $1-somethging a dozen [$5.00].
The 30-year mortgage rate was 3% [6.15%]
Inflation was 1+% [6.5%].
And we had World peace.
What happened?
[Actual data 28 January 2023 observations]
“Inflation was 1+% [6.5%].”
Inflation was 1+% [1+%].
OK I corrected your most obvious lie. Watching Eagles v. 49ers so I will let others rebut your Trumpian BS.
Anonymous:
January 2019:
Inflation was 1+% [6.5%].
[ This is of course correct. ]
PGL:
Inflation was 1+% [1+%].
OK I corrected your most obvious lie…. I will let others rebut your Trumpian BS.
[ This is the typical, profane intimidation and incorrect. ]
https://fred.stlouisfed.org/graph/?g=C6lz
January 15, 2018
Consumer Price Index and Consumer Price Index Less Food and Energy, 2017-2022
(Percent change)
I guess you did not read the blog post either.
BTW Anonymous – do bother to READ the post before writing such a STUPID comment.
Read? It’s two graphs.
President Obama, “Never underestimate Joe Biden’s ability to f**k things up.”
Buttigieg 2024!
He’s doing a bang-up job on the supply chain . . .
Is your real name Donald Trump Jr?
Inflation was 1+%
https://fred.stlouisfed.org/series/CPIAUCSL
Checking the actual data, CPI rose by 1.9% in 2018 and then rose by 2.2% in 2019.
Anonymous lied again.
By “What happened to World Peace (sic)?” you presumably mean that Russia has invaded (more of) Ukraine, thereby adding another conflict to the violence in Myanmar, Yemen, Syria, Haiti, Tigray… So the answer is “Russia invaded Ukraine.”
That’s also a partial answer to the inflation question. Other parts include avian flu, drought, increased profit margins, a tight housing market…
Russia is still trying to take over Ukraine. Profit margins appear to be coming down (as noted by NDD). Egg smuggling from Mexico is probably not sufficient to lower prices much, and the flu is highly persistent. You’re right to point out mortgage rates, which are working to contain housing prices, though also working to restict supply. Drought persists in much of the west despite recent above-average recipitation:
https://droughtmonitor.unl.edu/
Other questions?
Wait…2019? There was one other thing…I’m sure of it… Whay was that?
anonymous: I don’t know what you mean by inflation was 1+%. M/M annualized CPI inflation was -0.4%; as of December 2022, it -0.9%.
Professor Chinn,
I read the author’s example in his paper but was not able to understand how to do the calculation. As mentioned, in a prior post, I understand how to compute exponential smoothing factors with optimizing functions, but not able to do the instantaneous forecast.
Any chance you could show an example calculation for a back bencher so a back bencher could make future calculations?
Thanks for considering.
I was able to understand the various inflation measures and computations leading to the instantaneous inflation formula and thus,
I am up to the formula on page 4 for instantaneous inflation. k(tau) is dependent on both “a” and tau, so I need to see if my data shows the same curves as the article.
I’m very curious to see your results Sir. You have my genuine admiration. Be strong and keep digging into the math.
I think my calculations are correct for the instantaneous inflation for k(0,0) as shown on Figure 2 page 4 of the article, but I am having trouble with the calculation for k(tau,4). I made a product table for (tau,a); the calculations agree (as best as I can tell) with Figure 2a Kernel Weights, page 4 of the article. My product table used with the remainder of the formula, calculates the instantaneous inflation for k(0,1) at 1.8 and k(11,1) at 0.15 as shown on page 3 of the article.
I just noticed there is a 1/31/2023 update of the article. I was using the 1/23/2023 version, so the page references I made may not link to the 1/31/2023 version.
Moses,
Dividing the CPI index for December 2022 at 298.11 by the December 2021 index at 280.13, the result is 1.0642 or about 6.4% Y/Y. You can also get the same result by computing the product of each monthly inflation relative for the twelve months of 2022. For example, use Excel’s Product function to calculate the product of 1.0065 through 0.9992 to show the result of 1.0642.
If the instantaneous model on page 5 has an exponent of one, you will get the same answer as the Y/Y or the product calculation shown above. The k(tau) exponent will have a value of one whenever a=0. Whenever the exponent of the page 5 model is equal to one, the result is equal to the Y/Y calculation.
Page 4 says, “Uniform kernel: a = 0. This is the kernel that the monetary authorities currently use, since for a = 0, we get κ(τ, 0) = 1 for all τ. In other words, each month, recent or distant, receives an equal weight.” As the article mentions on page 1, “…a=0 corresponds to the conventional measure….”
However, still having trouble with the calculation for a=1,2,4.
Dec-21 280.13
Jan-22 281.93 1.0065
Feb-22 284.18 1.0080
Mar-22 287.71 1.0124
Apr-22 288.66 1.0033
May-22 291.47 1.0097
Jun-22 295.33 1.0132
Jul-22 295.27 0.9998
Aug-22 295.62 1.0012
Sep-22 296.76 1.0039
Oct-22 298.06 1.0044
Nov-22 298.35 1.0010
Dec-22 298.11 0.9992
https://fred.stlouisfed.org/graph/?g=OdrS
January 30, 2018
Personal Consumption Expenditures price indexes for goods and services, 2017-2022
(Percent change)
https://fred.stlouisfed.org/graph/?g=twwl
January 30, 2018
Personal consumption expenditures price index and Personal consumption expenditures less food & energy price index, 2017-2022
(Percent change)
https://fred.stlouisfed.org/graph/?g=w3Wk
January 15, 2018
Sticky Consumer Price Index and Sticky Consumer Price Index less Shelter, 2017-2022
(Percent change)
https://fred.stlouisfed.org/graph/?g=Fn2j
January 15, 2018
Consumer Price Index for Rent and Owners’ Equivalent Rent, 2017-2022
(Percent change)