The trade balance [November release] rose to -$83.3 billion vs. Bloomberg consensus of -96.3 billion. The goods trade deficit with China also shrank sharply.
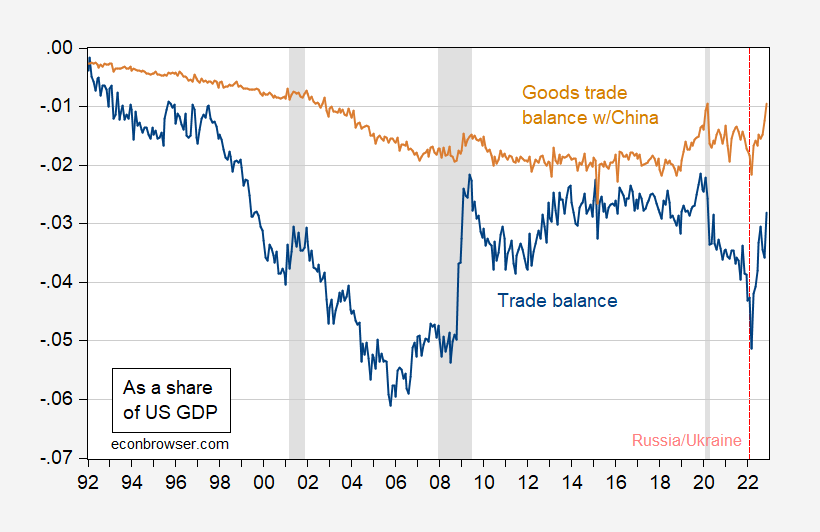
Figure 1: Trade balance as a share of GDP (blue) and goods trade balance with China (tan). US goods exports to, imports from China seasonally adjusted by author using X-13. GDP is IHS-Markit S&P Global. NBER defined peak-to-trough recession dates shaded gray. Source. BEA via FRED, IHS-Markit, NBER and author’s calculations.
The sharp improvements were caused by import declines exceeding export declines. While sharp, at least part of the decline made sense given past US dollar depreciation.
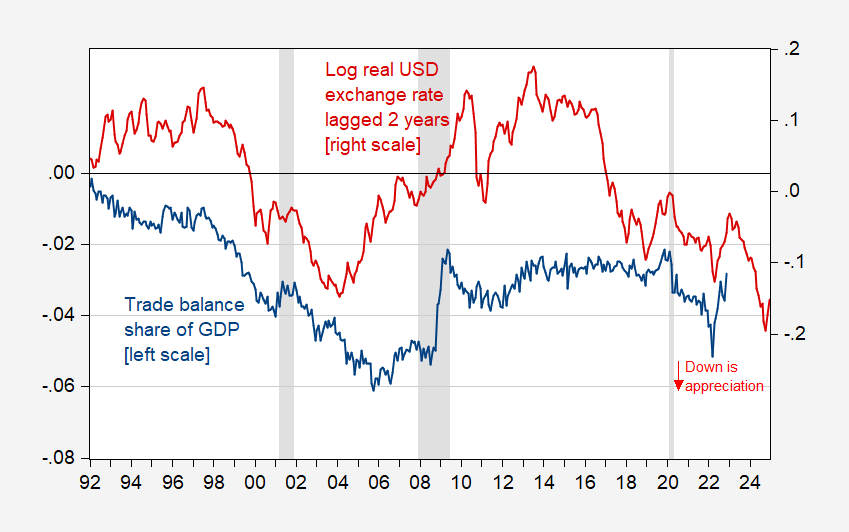
Figure 2: Trade balance as a share of GDP (blue, left scale) and real US dollar exchange rate against a broad basket of currencies, in logs 2006M01=0, lagged two years (red, right scale). GDP is IHS-Markit S&P Global. Real dollar is goods trade weighted through 2005; goods and services trade weighted thereafter. NBER defined peak-to-trough recession dates shaded gray. Source. BEA via FRED, Federal Reserve via FRED, HS-Markit, NBER and author’s calculations.
I’ve plotted the two series so that they should show a positive correlation, with a 2 year lag. Certainly, over the most recent two year period, the correlation is showing up as expected. That being said, with the dollar appreciation that occurred in the preceding two years, we should expect some return to expanding deficits, depending in part on how GDP evolves both at home and abroad.
Is the improvement in the trade balance good news insofar as GDP is concerned? In a mechanical sense, conditioning on the other components of GDP as already measured, a smaller trade deficit means the estimate of current GDP should be raised. On the other hand, to the extent that the imports are falling because of decreased import demand from reduced expenditures, rather than from expenditure switching, that means that the prospects for future GDP growth are darkened.
I’m not sure that we can infer from the composition of the import decline. Consumer goods led the decline, percentage-wise; however, given the boom in consumer spending on goods over the past year, I’m not sure what to make of this. Capital goods imports accounted for a much smaller decline, so maybe this does not signal an investment cutback due to a perceived incipient recession.
Thanks for putting this news in the context of the typical macroeconomic factors. Much to think about.
https://jabberwocking.com/10th-votes-same-as-the-9th
Kevin Drum covers the House Speaker debacle so we do not have to.
KEVIN got more votes. Well Kevin Hern is up to 7.
Kevin McCarthy’s vote count continues to decline.
Sharp pullback on consumer spending – because of higher interest rates? BTW- I was going to buy a new refrigerator – but now wondering if I can watch some YouTube videos and replace the motor in current 20 year old model – Also Mr. Fed Chair Powell – please stop! I’ve learned whatever lesson you are teaching.
Nope. Consumer spending has had no pullback. Normalization. Indeed, the Fed has no control over consumer rates which have improved since summer.
I think he was reading the import data but overall consumption can rise even as imports of consumer goods declines.
BTW – I read this with interest – I wonder if our capitalist overlords just can’t stand us/working class doing pretty well recovering from another GOP recession – their orders to the House GOP Dingbat Caucus/lackeys – create as much havoc as possible (also note to WIGOP – take the ACA $ already! it will help the state control healthcare costs,) https://www.theatlantic.com/ideas/archive/2023/01/new-year-good-news-economy-health-care/672629/
https://www.bls.gov/news.release/empsit.nr0.htm
Total nonfarm payroll employment increased by 223,000 in December, and the unemployment rate edged down to 3.5 percent, the U.S. Bureau of Labor Statistics reported today.
What? Employment growth is still strong? Dr. VMT Steve will likely say this is a fake number since he believes the Household Survey is the better indicator. Further down in this BLS news:
The employment-population ratio increased by 0.2 percentage point over the month to 60.1 percent.
After all the unemployment rate fell even though labor force participation went up. Time for Stevie to go fishing for some other fake statistics in order for him to continue recession cheerleading.
https://www.bls.gov/news.release/empsit.a.htm
The Household Survey says employment rose by 717 thousand last month!
Calling Princeton Steve – is this because some of your multiple job holders went back to working one job? Or is it now your position that the Household Survey is less than the Payroll Survey. That’s OK as you can take lessons from Lawrence Kudlow on this kind of flip flopping.
https://english.news.cn/20230106/4376d2db468e47858ff1fd2ee31aeed3/c.html
January 6, 2023
China’s services trade up 15.6 pct in first 11 months of 2022
BEIJING — China’s services trade value went up 15.6 percent year on year in the first 11 months of 2022, data from the Ministry of Commerce showed Friday.
The total trade value stood at more than 5.4 trillion yuan (about 783.61 billion U.S. dollars), according to the ministry’s spokesperson Shu Jueting.
Services exports expanded 15.5 percent year on year to 2.58 trillion yuan in the reporting period, while services imports totaled over 2.82 trillion yuan, up 15.6 percent from a year ago, resulting in a deficit of 237.62 billion yuan.
Trade in knowledge-intensive services raked in nearly 2.25 trillion yuan in the first 11 months of 2022, up 10.1 percent year on year, Shu said.
Knowledge-intensive services exports gained 13.4 percent to hit over 1.26 trillion yuan, led by categories such as intellectual property royalties and computing and information services….
https://www.imf.org/en/Publications/WEO/weo-database/2022/October/weo-report?c=924,&s=BCA,BCA_NGDPD,&sy=2000&ey=2022&ssm=0&scsm=1&scc=0&ssd=1&ssc=0&sic=0&sort=country&ds=.&br=1
October 15, 2022
Current Account Balance * and Balance as a percent of Gross Domestic Product for China, 2000-2022
2019
Balance ( 102.9)
Balance percent of GDP ( 0.72)
2020
Balance ( 248.8)
Balance percent of GDP ( 1.67)
2021
Balance ( 317.3)
Balance percent of GDP ( 1.82)
2022
Balance ( 329.6)
Balance percent of GDP ( 1.80)
* Billions of dollars
https://www.fao.org/worldfoodsituation/foodpricesindex/en/
FAO Food Price Index
The FAO Food Price Index (FFPI) is a measure of the monthly change in international prices of a basket of food commodities. It consists of the average of five commodity group price indices (cereal, vegetable oil, dairy, meat, sugar) weighted by the average export shares of each of the groups over 2014-2016.
Monthly release dates for 2023: 6 January, 3 February, 3 March, 7 April, 5 May, 2 June, 7 July, 4 August, 8 September, 6 October, 3 November, 8 December.
FAO Food Price Index continued to drop in December, however, it rose substantially on a yearly basis
The FAO Food Price Index (FFPI) averaged 132.4 points in December 2022, down 2.6 points (1.9 percent) from November, marking the ninth consecutive monthly decline and standing 1.3 points (1.0 percent) below its value a year ago. The decline in the index in December was driven by a steep drop in the international prices of vegetable oils, together with some declines in cereal and meat prices, but partially counterbalanced by moderate increases in those of sugar and dairy. For 2022 as a whole, however, the FFPI averaged 143.7 points, up from 2021 by as much as 18 points, or 14.3 percent.
《I’m not sure what to make of this.》
When will you learn to recognize noise?
Hard resets all over the place. This is still stimulus rolling off, I think. Should not be over-interpreted, but rather represents reversion to pre-pandemic norms. Same dynamics as H1 GDP, HH v CES, real estate and equity values, productivity, port throughput, job openings (still hanging in there), etc.
“Hard resets all over the place. This is still stimulus rolling off, I think. Should not be over-interpreted”
Hard resets? No one except you uses such asinine language.
Speaking of overinterpreting – there was some complete jerk who kept looking at the fall in the government deficit during a period when a massive recovery was raising taxes as the change in fiscal policy. That jerk was Economic Know Nothing Stevie Kopits. Dumbest troll ever.
“Trade Deficit Shrinks Dramatically”
dramatically = hard reset
Steven Kopits: Well, then we’ve had another “hard reset” just 7 months prior (April 2022), as well as hard resets in February 2009 and November 2008, when the trade deficit improved by larger amounts. Add 2015M04, 2012M12, 2012M02, and 2001M02 if you want to push the threshold down to 0.6 ppt of GDP, rather than 0.77 ppt of GDP recorded in 2022M11.
WRONG. If exports rose – then the trade deficit falls. And higher exports = higher aggregate demand.
Dude – you are the WORST ever at macroeconomics. THE WORST.
Again, I think it is important to distinguish between a suppression and a recession. In a normal business cycle, some of the various indicators covered here would represent the onset of recession. In the current case, however, it represents a reversion to pre-pandemic norms, for example, in the case of housing values, equity valuations, employment composition, inflation, port traffic, etc. Productivity is another example. Nevertheless, if you’re losing full time jobs as part time and multiple jobholders are increasing massively, well, we might not be surprised that productivity numbers look pretty bad. But the explanation appears to be a recovery of pre-pandemic trends, not some underlying collapse of economic potential. Therefore, we might expect some pretty weak productivity numbers in 2023 with no underlying structural implications for the economy.
https://www.princetonpolicy.com/ppa-blog/2023/1/4/us-non-farm-labor-output
“I think it is important to distinguish between a suppression and a recession.”
Needs editing
“I think it is important for Stevie to make up totally bogus words since he has no clue about basic macroeconomics”
Much more honest.
“But the explanation appears to be a recovery of pre-pandemic trends, not some underlying collapse of economic potential. Therefore, we might expect some pretty weak productivity numbers in 2023 with no underlying structural implications for the economy.”
So you draw your own little trend line and that tells you that there have been no underlying changes in long-term growth? Damn – you are one arrogant KNOW NOTHING. No wonder you never publish your little “forecasts”!
BTW – before you declare you were correct on anything regarding the labor market – maybe you should read Dr. Chinn’s latest post. Household survey rose by 717 thousand whereas payroll survey rose by 223 thousand, which makes a mockery of most of the BS you have been spewing. Of course no one expects you to ever be honest about these things. That has never been your style.
Um, Stevie? On the assumption that “hard reset” means something bad, I have news: productivity is rising. Rose in Q3 and based on current Q4 estimates, it rose in Q4. Here’s a rough GDP proxy based on GDPNow alongside official productivity data:
https://fred.stlouisfed.org/graph/?g=Yu9n
See? Growth. Gotta make allowances got government and farm output, but the proxy works reasonably well.
Now, about that “hard reset” muddle you keep writing, I figured I shuld give you the benefit of the doubt and see if a reasonable authority on econ and finance lingo might agree that it means something. Investopedia has nothing on “hard reset” and only two “reset” entries that I could find, one having to do with variable rate debt, the other an article about portfolio shifts:
https://www.investopedia.com/terms/r/reset-rate.asp
https://www.investopedia.com/the-express-podcast-episode-69-5215591
The thing about made-up, ill-defined terms is that they reek of ambiguity. The only benefit of ambiguity outside of literature* is that it provides deniability. “You misrepresent my meaning me, Sir! I didn’t say ‘recession’. I said ‘reset’!”
Here is what one of the economists ofan earlier generation had to say about sloppy language in economics:
“…by a disorderly and ambiguous terminology we are led into the most palpable mistakes and misunderstandings…”
– Eugen von Böhm-Bawerk
We don’t really have time for “palpable mistakes and misunderstandings”, so let’s not be tossing around “disorderly and ambiguous” made-up language.
I do agree that Covid and government response to it have made economic analysis tricky – all the more reason to be precise in our speech and writing.
Hard reset is just the flip side of suppression. Stevie has his own pet terms since he flunked Principles of Macroeconomics.
“I have news: productivity is rising. Rose in Q3 and based on current Q4 estimates, it rose in Q4.”
Stevie once again links to his blog post where he thinks his chart is his “interpretation”. I provided my verbal explanation of what his productivity chart shows and this troll just ignored my comment. OK – notice that it not only shows that Q3 increase but more importantly according to his own chart – productivity is above his trend line.
I get Stevie cannot be bothered to read the posts here or some of the more informed comments. I get Stevie never bothered to study basic economics. But this troll cannot even be bothered to read his OWN chart?
Round 12 and the Never Kevins have already lost 4 people. But the other 3 already voting voted for Hern or Jim Jordan. McCarthy will get more than 200 but less than the magic 217.
Round 3 had only two nominees. But it looks like it will be:
Jeffries 212
McCarthy 214
Jim Jordan 6
That is if Rosendale sticks to his guns. But even if he flips – McCarthy will have failed for the 13th time.
Never Kevins only 7
McCarthy 213
Jeffries 212
But here’s the problem for Kevin. He peeled off the easiest of the Never Kevin 20 by promising the entire store. Unless Kevin totally puts his “manhood in a lockbox”, he is not getting to the majority of those voting. If Kevin does totally cave, he will be the most worthless Speaker of all time.
Some of Kevin’s supporters are using a really stupid sandwich analogy. Damn – these clowns need to take a lunch break.
If McCarthy slips by two more votes and some (four?) Republicans wander out of the chamber during a vote, Jeffries will become Speaker.
That was my hope but it looks like McCarthy has made a deal with the devil. McCarthy will be Speaker but a totally neutered one.
https://twitter.com/costareports/status/1611416399485747216
Some House Republicans just walked off the floor in disgust with Gaetz. I’m in speaker’s lobby and some members are cursing out Gaetz as they leave the floor. “I’m not listening to this —-!” one House R says… others fuming and going outside to balcony to cool off.
I must have missed it – what did this little creep say?
Yes, this will continue to fall yry sharply, one of the illusions of the “Kopits contraction” last year. This will boost underlying growth in 2023. Expect a lot of hooting and whining by the financial elite. But it shows they don’t got a clue with government bean counting. Trade from a accounting pov, WAS the recession last year. Now in 2023, it will be a positive to gdp. Even with exports nominally declining. The over spending has long ended and we imported too many goods at once.
one of the illusions of the “Kopits contraction” last year.
Best line of the year so far. Kopits does not realize how the BLS news undermines his pet thesis. In fact, this worthless troll is asking us to read his latest blog post. Don’t bother – as it is the usual worthless disinformation.
https://fred.stlouisfed.org/graph/?g=IBTh
January 4, 2020
Average Hourly Earnings of All Private and Production & Nonsupervisory Workers, * 2020-2022
* Production and nonsupervisory workers accounting for approximately four-fifths of the total employment on private nonfarm payrolls
(Percent change)
https://fred.stlouisfed.org/graph/?g=Qe7j
January 4, 2020
Real Average Hourly Earnings of All Private and Production & Nonsupervisory Workers, * 2020-2022
* Production and nonsupervisory workers accounting for approximately four-fifths of the total employment on private nonfarm payrolls
(Indexed to 2020)
I wonder how much is oil price driven. We had a pretty dramatic price increase as the gap opened, and then the converse later.
Not making an assertion. Just an I wonder.