The employment situation release for December 2022 provides latest available monthly data on the economy’s conditions. Here’re a variety of labor market indicators:
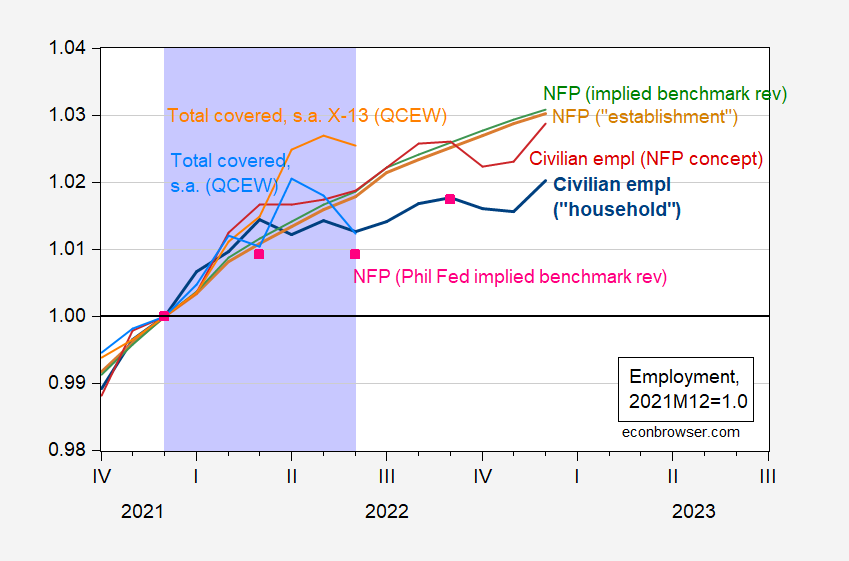
Figure 1: Civilian employment over age 16, FRED series CE16OV (bold blue), civilian employment adjusted to nonfarm payroll concept (red), nonfarm payroll employment, FRED series PAYEMS (tan), nonfarm payroll employment series adjusted to reflect preliminary benchmark revision by author (green), nonfarm payroll employment adjusted by Philadelphia Fed to reflect preliminary benchmark revision (pink squares), Quarterly Census of Employment and Wages (QCEW) total covered employment, adjusted by Census X-13 by author (orange), QCEW adjusted by geometric moving average (sky blue), all expressed relative to 2021M12 values, all seasonally adjusted. Lilac shading denotes hypothesized (by Mr. Steven Kopits) 2022H1 peak-to-trough recession. Source: CE16OV, PAYEMS from BLS via FRED, preliminary benchmarked series constructed by author using data from BLS, Philadelphia Fed, civilian employment adjusted to NFP concept from BLS, QCEW from BLS, and author’s calculations.
If you thought the household series was better measuring employment than the establishment, then — when assessing trends in the nonfarm sector — one would not find much difference in estimated change in employment from the end of 2021, when making the series compatible in terms of coverage (that is, tan line versus red line).
Why is this the case? It’s because the civilian employment series (overall) jumped up in December. The extreme volatiliy in the household series, combined with substantial revisions, shows up in Figure 2. This is why macroeconomists tend to focus more on the establishment series than on the household series (Furman (2016); CEA (2017); Goto et al. (2021)).

Figure 2: Change in nonfarm payroll employment from October release (green), from November release (tan), from December release (blue), and Bloomberg consensus (sky blue square); change in civilian employment from October release (purple), from November release (chartreuse), from December release (red), all in thousands, s.a. Source: BLS via FRED, various releases, Bloomberg, and author’s calculations.
What do business cycle indicators look like, given the employment release? This is shown in Figure 3, below.
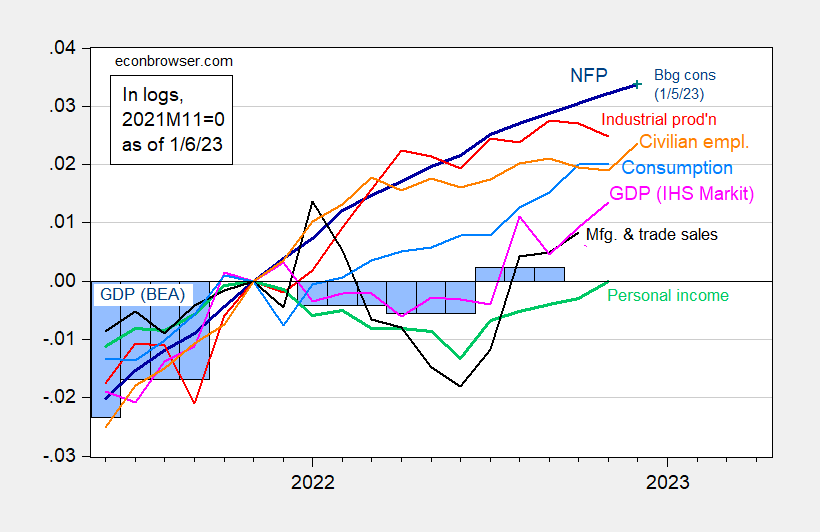
Figure 3: Nonfarm payroll employment, NFP (dark blue), Bloomberg consensus of 1/5 (blue +), civilian employment (orange), industrial production (red), personal income excluding transfers in Ch.2012$ (green), manufacturing and trade sales in Ch.2012$ (black), consumption in Ch.2012$ (light blue), and monthly GDP in Ch.2012$ (pink), GDP (blue bars), all log normalized to 2021M11=0. Source: BLS, Federal Reserve, BEA, via FRED, IHS Markit (nee Macroeconomic Advisers) (1/3/2023 release), and author’s calculations.
Taken together, recognizing that the NBER BCDC focuses on nonfarm payroll employment and personal income ex-transfers, it seems that the economy retained momentum in November-December. JOLTS data suggested tight labor markets through November.
I might also note that to the extent that the civilian employment series peaks before the NFP series (in the last four recessions, the civilian peaks before the NFP 50% of the time, and at the same time 50% of the time), then our fears of a recession having already starting in November are allayed.
We have more insight from weekly economic indicators, which cover data through December 31st.
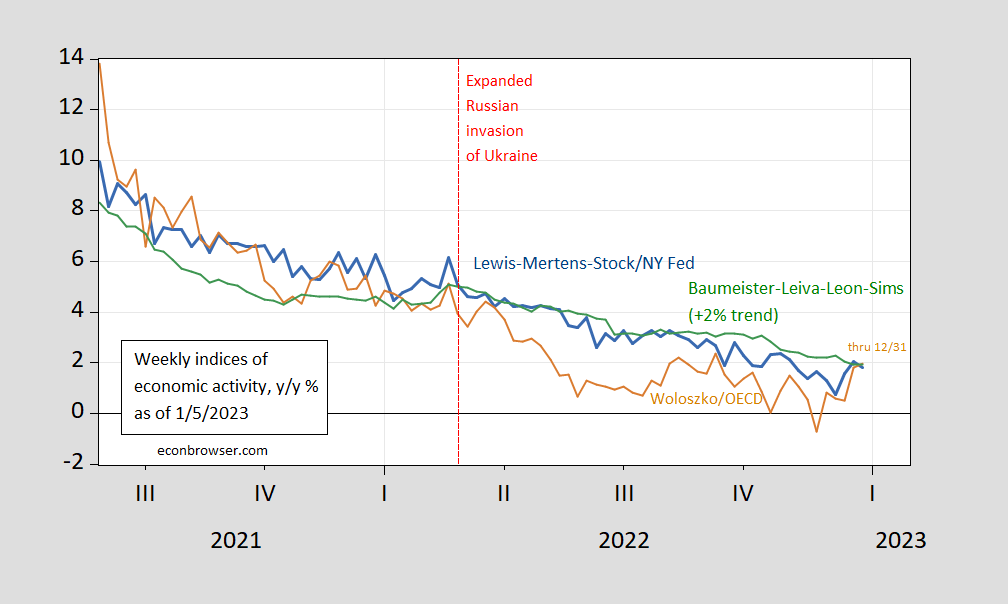
Figure 4: Lewis-Mertens-Stock Weekly Economic Index (blue), OECD Weekly Tracker (tan), Baumeister-Leiva-Leon-Sims Weekly Economic Conditions Index for US plus 2% trend (green). Source: NY Fed via FRED, OECD, WECI, and author’s calculations.
The WEI reading for the week ending 12/31 of 1.8% is interpretable as a y/y quarter growth of 1.8% if the 1.8% reading were to persist for an entire quarter. The OECD Weekly Tracker reading of 2.0% is interpretable as a y/y growth rate of 2.0% for year ending 12/31. The Baumeister et al. reading of -0.1% is interpreted as a -0.1% growth rate in excess of long term trend growth rate. Average growth of US GDP over the 2000-19 period is about 2%, so this implies a 1.9% growth rate for the year ending 12/31.
“If you thought the household series was better measuring employment than the establishment, then — when assessing trends in the nonfarm sector — one would not find much difference in estimated change in employment from the end of 2021, when making the series compatible in terms of coverage (that is, tan line versus red line). Why is this the case? It’s because the civilian employment series (overall) jumped up in December.”
An excellent point. Back in the Bush43 days when Lawrence Kudlow would declare the more reliable series to be the one that gave the higher increase for that particular month, I noted over at Angrybear that when one looks at these series over a longer period of time, their divergences were not that large.
Now Princeton Steve has committed on your trade balance posts by completing ignoring the trade sector altogether hinting that he has always been right on his labor market nonsense EVEN THOUGH this latest information should have any sane person realize that a lot of his bloviating was completely baseless.
To return to the matter of part-time and multiple job holders, let me add my analysis from the just released CPS numbers:
The March – December 2022 period proved quite unusual by historical standards. Although the employment level rose by more than 900,000 during this period, those employed full time actually declined by nearly 300,000, even as part-time workers soared by nearly 900,000 and multiple jobholders advanced by nearly 700,000.
A simple interpretation might suggest that service employees sidelined by covid returned to their jobs during this period, with some of them downshifting from full to part-time. Meanwhile, with price inflation running well ahead of wages for much of the year, many lower wage workers found additional jobs to help make ends meet.
https://www.princetonpolicy.com/ppa-blog/2023/1/6/us-employment-trends-march-december-2022
My God! Did you not notice the news from the BLS? Did you not read this post?
Look – no more of your worth bloviating until you at least try to be honest about the data. No more promoting your utterly worthless blog.
We have all had it with your garbage. Take it somewhere else.
https://fred.stlouisfed.org/series/LNS12026620
Multiple Jobholders as a Percent of Employed
5.1% as of Feb. 2020.
5.1% as of Dec. 2022.
According to the latest BLS data, multiple job holders represented 4.6% of the employed in March. In December, multiple job holders represented 5.1% of the employed. That difference is worth an incremental 684,000 multiple job holders on an increase of 916,000 employed. So, yes, multiple job holders are in fact material in the equation.
Part time workers are even more important, adding 886,000 such jobs in March-December on 916,000 incremental employed.
See the numbers: https://www.princetonpolicy.com/ppa-blog/2023/1/6/us-employment-trends-march-december-2022
I know how to read a FRED graph troll. Yea – this ratio fell and then it went back up. Volatility is not a trend. And real oil consultant has to know this. Then again volatility gives lying trolls like you a chance to misrepresent. Which is the only thing you are good at.
‘See the numbers’
Yea – your cherry picked numbers. Gee Stevie – I guess you never learned what holistic actually means. Oh wait – in your set of pet terms holistic = lying with statistics. Got it.
Multiple job holders and part time work are common around Christmas. It’s a distortion that sDonal adjustment is meant to deal with, but seasonal adjustment is particularly tricky in Q4. Add to that problem that the period over which adjustment factors are calculated includes the Covid recession and recovery, and seasonal adjustment is even less reliable – overall and particularly for Q4.
Ay claim based on part time and multiple job holders which has December as an end-point is pretty speculative.
Analysis requires understanding what it is possible to know – a holistic approach, if you will. A weak understanding of the factors involved means a weak analysis.
Kopits is like the Warren Commission. He wants to tell a story than uncover what really happened. He can hire Roger Stone to play Clay Shaw.
That’s a fair point: there are a lot more multiple job holders as of December.
But it’s also true that employment levels are also way up in December.
So if we take March to October to avoid the holiday effect, here are the numbers, in thousands:
Labor force: +345
Employment: +265
Full time: -408
Part time: +505
Multiple job holders: +157
Here are the increases as a percent of change in Employment:
March-Oct. March-Dec.
Full time: -154% -31%
Part time +191% +97%
Multiple +59% +75%
In either time frame, we can see that full time employment is falling, and part time and multiple jobs are rising.
As I recall, this discussion started as a result of the divergence of CES from the HH survey, which started in March. I speculated that the collapse in productivity might be associated with lower quality employment, notably second jobs. But this logic would also appear to apply to part time work. And the data bears that out for the period after Q1 (I have no made an analysis of Q1 2022). All the net rise in jobs (and then some) came from part time or multiple jobs. The narrative might argue that people who left their jobs during covid were disproportionately in the services, restaurants, hotels, entertainment, etc. Professionals by and large kept their jobs, with the plausible result that productivity soared. The return of lower wage workers, for which part-time and multiple jobs might be a proxy, would be associated with a fall in productivity (although not a fall in output, which also occurred in H1).
Pgl notes that the share of multiple job holders is now back at historical norms and the data appears to support that view. Notwithstanding, the productivity numbers suggest that we’re not back on trend yet, implying some incremental drag on output / hour in the coming year. That could be part time work or multiple work, or perhaps other factors might be in play.
I’d add that this discussion is yet another reason to distinguish a recession from a suppression.
New posts from our host calling out Stevie’s latest nonsense. It is like he and JohnH have started earlier hoping to eliminate all competition for that end of year awards!
I find most trademark infringement suits interesting but this one made me go EWWWWW:
https://www.politico.eu/article/donald-trump-make-sex-great-again-future-of-trump-condoms-european-union-patent-office/
Make sex great again! Future of Trump condoms rests with EU trademark office
German businessman wants to sell Trump-branded contraceptives, clothing and drinks.
Would you buy a Donald Trump-branded condom? Whether or not you will one day be able to do so rests on a decision by the European Union Intellectual Property Office, the unlikely venue for a bizarre legal dispute between Trump’s legal team and a German entrepreneur. Frank Lindner wants to sell a range of Trump-branded goods — condoms, clothing, beer and sparkling wine — and has filed an application with the EUIPO, as the Trump name is trademarked. But DTTM Operations LLC — which handles many trademarks for Trump, and which is being represented in Europe by Swedish law firm Potter Clarkson — is against the plan, according to correspondence filed to the EUIPO. The Trump lawyers argue there is a “likelihood of confusion on the part of the public” as there already are hotels, bars and restaurants using the Trump name in Europe, such as the Trump Turnberry hotel in Scotland. However, Lindner’s lawyer says there is no such risk. “There is no likelihood of confusion between golf and hotel services on the one hand and condoms, alcohol and non-alcoholic beverages on the other,” the lawyer argued in one of the legal documents. The choices of products that may be given the Trump name are a tad unusual. Trump is a well-known teetotaler and two women with whom he is alleged to have had affairs — model Karen McDougal and porn star Stormy Daniels — both told CNN that Trump did not like to use condoms during the sexual encounters they had with him in 2006. In her book, Daniels said her alleged tryst with Trump “may have been the least impressive sex” she’d ever had and likened his penis to a “toadstool.”
Stormy Daniels might tell potential German customers that this product only comes in small sizes.
Here’s a picture of average hourly earnings across a number ofindustries:
https://fred.stlouisfed.org/graph/?g=Yufj
I took out a couple to decrease clutter. Feel free to put build your pick your own series from this list:
https://fred.stlouisfed.org/release/tables?rid=50&eid=6471
Note that the “total” series is hidden behind “private services” in recent months – the two don’t ever diverge much. Hotels and restaurants are still raising pay at a good clip. Schools and hospitals no longer are. Finance guys appear to be doing well, but I think that may be a mirage, a composition shift due to layoffs.
It’s informative to switch from the current % change display to levels. Trade and transport hourly earnings have, for example, fallen recently, but remain far higher than in years past.
https://fred.stlouisfed.org/graph/?g=xudZ
January 30, 2018
Multiple Jobholders as a percent of Employed, 2017-2022
https://fred.stlouisfed.org/graph/?g=u12d
January 30, 2018
Employed Part-Time for Economic and Noneconomic Reasons, 2017-2022
https://fred.stlouisfed.org/graph/?g=r2H7
January 4, 2018
United States Employment-Population Ratio, * 2017-2022
* Employment age 25-54
https://fred.stlouisfed.org/graph/?g=sxNb
January 4, 2018
Employment-Population Ratios for White, Black and Hispanic, * 2017-2022
* Employment age 16 and over
https://fred.stlouisfed.org/graph/?g=sxNk
January 4, 2018
Employment-Population Ratios for White, Black and Hispanic, * 2017-2022
* Employment age 16 and over
(Indexed to 2017)
https://www.nytimes.com/2023/01/06/business/economy/recession-soft-landing.html
January 6, 2023
Even a Soft Landing for the Economy May Be Uneven
Small businesses and lower-income families could feel pinched in the months ahead whether or not a recession is avoided this year.
By Talmon Joseph Smith
One of the defining economic stories of the past year was the complex debate over whether the U.S. economy was going into a recession or merely descending, with some altitude sickness, from a peak in growth after pandemic lows.
This year, those questions and contentions are likely to continue. The Federal Reserve has been steeply increasing borrowing costs for consumers and businesses in a bid to curb spending and slow down inflation, with the effects still making their way through the veins of commercial activity and household budgeting. So most banks and large credit agencies expect a recession in 2023.
At the same time, a budding crop of economists and major market investors see a firm chance that the economy will avoid a recession, or scrape by with a brief stall in growth, as cooled consumer spending and the easing of pandemic-era disruptions help inflation gingerly trend toward more tolerable levels — a hopeful outcome widely called a soft landing.
“The possibility of getting a soft landing is greater than the market believes,” said Jason Draho, an economist and the head of Americas asset allocation for UBS Global Wealth Management. “Inflation has now come down faster than some recently expected, and the labor market has held up better than expected.”
What seems most likely is that even if a soft landing is achieved, it will be smoother for some households and businesses and rockier for others.
In late 2020 and early 2021, talk of a “K-shaped recovery” took root, inspired by the early pandemic economy’s split between secure remote workers — whose savings, house prices and portfolios surged — and the millions more navigating hazardous or tenuous in-person jobs or depending on a large-yet-porous unemployment aid system.
In 2023, if there’s a soft landing, it could be K-shaped, too. The downside is likely to be felt most by cash-starved small businesses and by workers no longer buoyed by the savings and labor bargaining power they built up during the pandemic….
Off topic, Russia’s blame game –
The death of some number of Russian conscripts (perhaps between 86 and 400, but “somewhere in the middle” is a pernicious logical fallacy) has led to a lot of blame shifting:
https://www.politico.eu/article/pro-war-russia-enraged-military-failing-ukraine/
The most bloddy-minded critics are most vocal, and want to punish some generals. As a means of apportioning blame, I suppose that’s as good a method as any, but how does that improve Russia’s war effort? Hasn’t the turnover in generals been pretty high so far, to little effect? Dvornikov came and went. They mostly come from the same military culture and training and there is reason to think that culture and training are what has failed in Ukraine.
Anybody know enough about Russia’s military to offer an educated opinion?
Your question is what?? “Are Russian generals really the ones to blame?” “What is the main reason for Russia’s failure?? “If lower level Russian generals relieved the higher level generals would that produce better results?”
I would say, as a non-expert, that the whole damned thing was a clusterf*ck.
Putin assumed (and Barkley Rosser regurgitated from Russian state media like he was quoting American/British intelligence officials) that Eastern Ukraine would happily go along for the ride after having their family homes bombed into oblivion. They assumed it was sharper to send in ground troops before strategically knocking out Ukraine’s air defenses. And on and on and on and on. You don’t strike at residential/civilian zones until AFTER taking out military targets. I could find 9th grader Junior ROTC kids who could tell Putin and the Kremlin that much.
https://www.nytimes.com/interactive/2022/12/16/world/europe/russia-putin-war-failures-ukraine.html
A persistent theme among all those revolting speeches as one GOP troll after another got up to nominate McCarthy was how Federal spending is out of control. Kevin Drum runs the number on inflation adjusted spending per capita and all that hot air was BS:
https://jabberwocking.com/raw-data-federal-spending/
The basic story is simple: we spent a ton of money during the pandemic and then cut back in 2021 and 2022. We are currently spending at a rate slightly lower than we would have projected back in 2020.
Dry humor is the best humor.
https://twitter.com/jamie_raskin/status/1611163233066287105