The core figure exceeds consensus (y/y 5.4% vs. 4.9% Bloomberg).
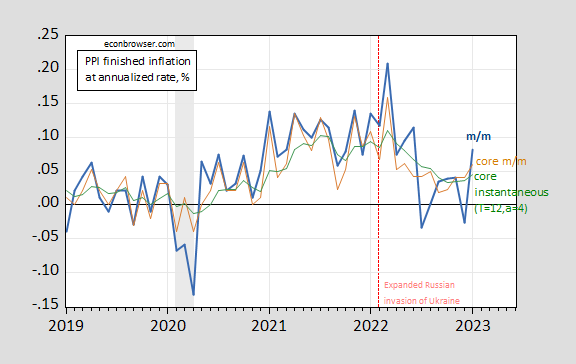
Figure 1: Month-on-month annualized PPI inflation (bold blue), Core PPI inflation (tan), instantaneous Core PPI inflation (T=12,a=4) (green). NBER defined peak-to-trough recession dates shaded gray. Source: BLS via FRED, and author’s calculations.
Core instantaneous inflation (T=12, a=4) rises noticeably less than core m/m.
Figure 2 shows instantaneous CPI and PPI (finished goods and services) inflation.
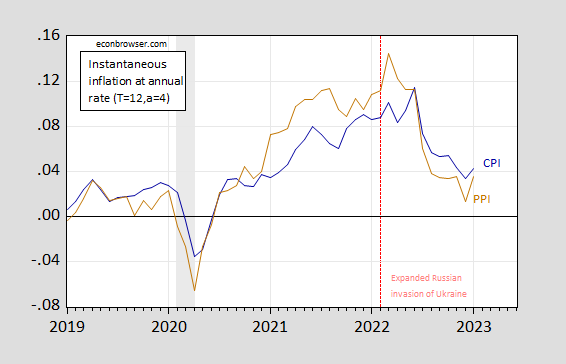
Figure 2: Instantaneous CPI inflation (T=12,a=4) (dark blue), and instantaneous PPI inflation (T=12,a=4) (brown). NBER defined peak-to-trough recession dates shaded gray. Source: BLS via FRED, and author’s calculations.
The markets are taking the core PPI numbers, in conjunction with retail sales and CPI numbers, as indicating higher inflation – and hence higher terminal Fed funds rates – than a week ago.
Market commentary on market price responses to news often seems to ignore the wisdom that a single data point doesn’t amount to a new trend. That’s why sticky price measures, instantaneous measures and averages over time are useful.
Figure 2 shows a deceleration in instantaneous measures in December and a re-acceleration in January, which shows this particular combination of T&A aren’t always enough to filter out noise. (Knock wood and hope this doesn’t attract any dumb.)
Short-term Inflation forecasting hasn’t been very useful since early 2020. We don’t know what the latest inflation readings imply for the trend. Nor do Fed folk.
As a full bred degenerate I have the right to make perverted innuendoes if I want to. My kind of sickness doesn’t wander by your street every day you know……. I mean really.
Moses,
If you are interested, linked below is an article discussing Kernel and Bandwidth issues along with some code for R, that you may want to try.
https://towardsdatascience.com/kernel-regression-made-easy-to-understand-86caf2d2b844
Much of it goes above my head, but I appreciate the share and that you were considerate enough to think it could help me.
Yer welcome.
MD,
Rereading p. 75 of Beryl Sprinkel’s book, “Money & Markets”, 1971, he advised using the average of annualized amounts by averaging the prior six months of annualizations as a way of detecting the current “trend” of inflation.
Averaging FRED series PPIFIS annualized amounts for prior six months, this calculation shows about 2.9%.
Averaging FRED series CPIAUCSL annualized amounts for the prior six months, this calculation shows about 4.1%.
Unfortunately models perform the worst when you need them the most. They are pretty good at prediction stable trends, but often fail to identify the point when things change. The never ending question of “is this just noice/aberration or have things finally changed” is the hardest question to answer.
Household debt getting some attention today as well. Some worry about students’ loans later in the year tapping out young peoples:
https://libertystreeteconomics.newyorkfed.org/2023/02/younger-borrowers-are-struggling-with-credit-card-and-auto-loan-payments/
Don’t worry though, Jerome Powell has nothing to say about the above, he’s too worried that Americans have too many jobs now, and if the labor market gets “too tight” labor will have more negotiating power for higher wages, and this scares the holy hell out of Jerome Powell’s inner demon. He’s not worried about young people spending half their lives paying off interest on debt. JD Georgetown Jerome has large conglomerate CEOs and TBTF bankers (important people, not tuition paying riff-raff) he has to placate and lubricate. A bastard has to have priorities you know.
Professor Chinn,
Is there an EViews automated way to compute the instantaneous inflation?
I am having trouble determining how to weight each of the prior twelve month’s inflation readings.
PPI too choppy to read much into any one month’s data but I think the mini-selloff is healthy. Market has felt too resistant to pressures over the past couple weeks even as rate expectations have shifted toward “higher for longer”.
I know this about the PPI (just to forestall a snarky comment from the usual suspect), but I thought this was a good way of looking at the CPI and inflation.
https://www.statista.com/chart/29328/consumer-price-index/?utm_source=Statista+Newsletters&utm_campaign=6e2b348ae8-All_InfographTicker_daily_COM_PM_KW7_2023_Thu&utm_medium=email&utm_term=0_662f7ed75e-6e2b348ae8-339775394
There was some magical point to a link that told us we do not have negative inflation? Come on Brucie – no interpretation? Oh yea – Kelly Anne is still emailing to you what you are supposed to say. Got it!
LOL, Just can’t help yourself.
Yea – every time you put up something stupid (which seems to be about 6 times a day) I will call out the stupidity. Get used to it.
Now you might TRY to provide honest and useful comments – oh wait, that will NEVER happen. Carry on!
And as some people might think: “Great, inflation is cooling. Now when will prices be back to normal?”
Some people might think …. ? One would have to be a gold bug moron to think average inflation should be zero over an extended period of time. Oh wait – this stupid idea of prices going back to “normal” explains the incredible stupidity that comes through in Bruce Hall’s incessant rants.
I’ll let others judge who is “ranting”.
You put up garbage. I take it out.
I would ask you to take ownership for your incessant stupidity but then I know you are incapable of doing so.
Question to everybody:
I expect the Fed and BoC to raise overnight rates by a total of 75 bps between now and mid-summer. That assumes that the US economy will only start to seriously slow in H2 2023.
What are the odds that the US economy starts to slow so quickly in H1 2023 (March to June) that another 75 bps of rate hikes is not necessary?
@ Mr. Poole
“Click here” the Cowardly Lion said [ then immediately broke into song “If I Were King of the Forest” ]
https://www.cmegroup.com/markets/interest-rates/cme-fedwatch-tool.html
I assume you’d want to click on the July tab with blue lettering and dark grey background just above the top of the bar chart. Based on Powell’s behavior, right or wrong, I would guess they’ll raise it that full 75 bps. I am NOT saying that is the correct decision, I am saying that is how I think it will happen based on Republican Juris Doctor thinking.
Zero probability of leaving rates unchanged (or even a rate reduction)? Ahem!
@ Mr. Herzog Thank you. For whatever reason I was unaware of that website.
Pasted:
Probabilities of possible Fed Funds target rates are based on Fed Fund futures contract prices assuming that the rate hike is 0.25% (25 basis points) and that the Fed Funds Effective Rate (FFER) will react by a like amount.
Must admit that I have no idea what ‘Republican Juris Doctor thinking’ is.
Menzie introduced me/us to the CME fed rate link, so you should address your thanks to him.
The “Republican Juris Doctor thinking” is my juvenile smart-alecky way of exuding my anger and dislike of a Georgetown JD Jerome Powell.
@ Erik Poole
Make sure you click on all the gray tabs near the top, because I don’t think all of the prediction probabilities are based on what you copy pasted. There’s like 6 tabs connected to the time frame of the Fed decisions.
I am with el erian, Feb should been 50bps,
total 100 bps by July
h2 2023,
lot of demand out there from lockdowns and free movements.
view to sticky inflation, consumer hang in. until they don’t
I also agree with El Erian’s take on monetary policy. He is using a RE Keynesian approach which is still standard for most if not all central banks.
A 100 bps hike by July takes the FF range to 550 – 575 bps. That might put FF rates in positive real rate territory.
Professor Chinn,
In Figure 1 you show (tau=12, a=4). Should it be shown as (T=12, a=4)?
tau =0 to 11
(T-tau)^a*12 Sum (T-tau)^a k(tau,a)
tau a T
0 0 12 12 12 1.0
0 1 12 144 78 1.8
0 2 12 1728 650 2.7
0 4 12 248832 60710 4.1
AS: Yes, you are right! τ should read T.
AS: Thanks for the correction, I’ve made the change in notation in the relevant posts.
Professor Chinn,
It looks like the box on Figure 2 needs changing also.
At lease you know I read the data and charts.