Weekly indicators from Lewis-Mertens-Stock (NY Fed) Weekly Economic Indicators, and Baumeister, Leiva-Leon and Sims WECI and Woloszko (OECD) Weekly Tracker through 2/11/2023 were released today.
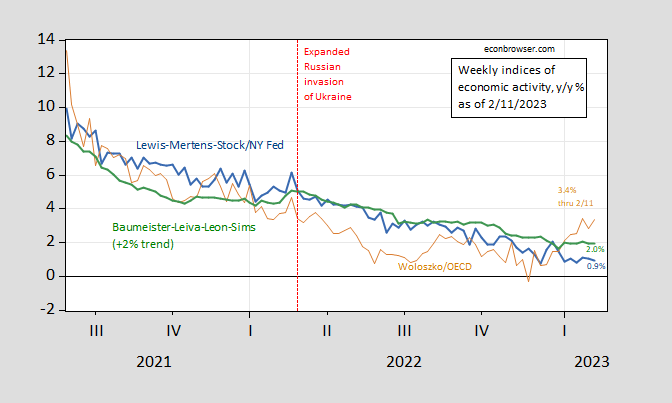
Figure 1: Lewis-Mertens-Stock Weekly Economic Index (blue), OECD Weekly Tracker (tan), Baumeister-Leiva-Leon-Sims Weekly Economic Conditions Index for US plus 2% trend (green), and IHS Markit monthly GDP (blue bars). Source: NY Fed via FRED, OECD, WECI, and author’s calculations.
There’s been a sharp rebound in the Weekly Tracker, which had dipped into negative for the week ending 11/26, now exceeding the WEI (0.9%) and WECI+2% (2.0%). The WEI reading for the week ending 2/11 of 0.9% is interpretable as a y/y quarter growth of 0.9% if the 0.9% reading were to persist for an entire quarter.The Baumeister et al. reading of -0.03% is interpreted as a -0.03% growth rate in excess of long term trend growth rate. Average growth of US GDP over the 2000-19 period is about 2%, so this implies a 1.97% growth rate for the year ending 2/11. The OECD Weekly Tracker reading of 3.4% is interpretable as a y/y growth rate of 3.4% for year ending 2/11.
The OECD Weekly Tracker continues to rise, even as the other two series slowly decline. It’s important to remember the WEI relies on correlations in ten series available at the weekly frequency (e.g., unemployment claims, fuel sales, retail sales), while the WECI relies on a mixed frequency dynamic factor model. The Weekly Tracker — at 1.1% — is a “big data” approach that uses Google Trends and machine learning to track GDP. As such, it does not rely on actual economic indices per se.
In the 2020 recession, the “Weekly Tracker” showed a more immediate decline than the measures based on actual economic indices.
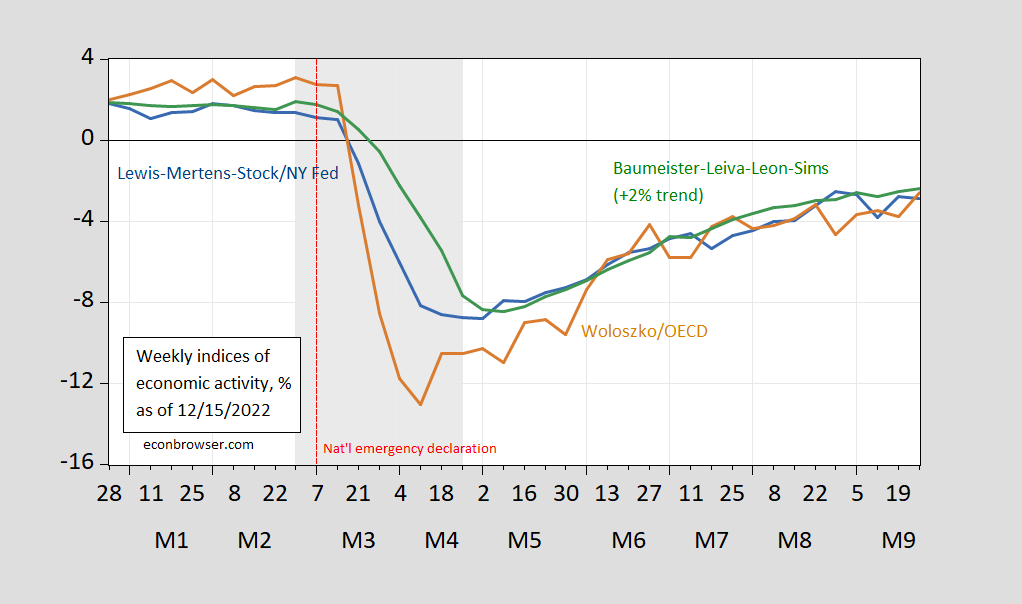
Figure 2: Lewis-Mertens-Stock Weekly Economic Index (blue), OECD Weekly Tracker (tan), Baumeister-Leiva-Leon-Sims Weekly Economic Conditions Index for US plus 2% trend (green). NBER defined recession dates shaded gray. Source: NY Fed via FRED, OECD, WECI, NBER, and author’s calculations.
For me, the dynamic factor approach is more familiar, so I think for the moment I’m giving more credence to the WEI and WECI (that being said, the Weekly Tracker better matches IHS Markit/S&P Global monthly GDP y/y growth, as shown in this post).
I’m with Menzie, I like the blue green lines. They keep on insisting in hiking rates, I mean who the hell do we think will win that war?? (rhetorical Q)
I want to recommend George Soros’ speech that was given recently at the Technical University of Munich. I thought he had many important things to say. Often when people get older, they speak slower in a kind of “drawl” , their memory recall may slow some, and their ability to “hold onto” a continuous train of thought becomes more difficult. But, we should not forget they have an incredibly huge storage of knowledge and life experience, and if we show patience in listening to the elders, a treasure trove of knowledge and wisdom is there to be had. Why throw that away?!?!?!?! Again Soros speech was at Technical University of Munich within the last week.
FREDblog has an analysis of Urban CPI with and without shelter. It turns out that the CPI without shelter included has declined from 106.5 to 105.7. OMG!!! Deflation!!! Shouldn’t Krugman and his ilk be lecturing us about the dire consequences of deflation? Isn’t time the nip the average worker’s incipient real wage gains in the bud?
https://fredblog.stlouisfed.org/2023/02/shelter-inflation-rises-up/
https://fred.stlouisfed.org/series/LES1252881600Q