Year-on-year headline and core inflation both down, but both slightly above consensus (with headline at 6.4% vs. 6.2% Bloomberg consensus). (Month-on-month both at consensus, given rounding). Other measures provide ambiguous signals.
First, we have various measures of overall CPI at m/m changes.
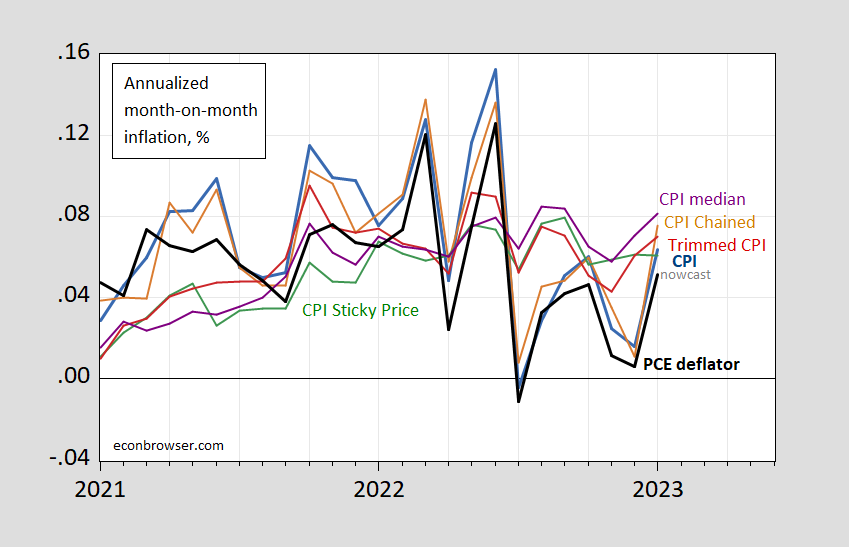
Figure 1: Month-on-month inflation of CPI (blue), chained CPI (brown), 16% trimmed CPI inflation (red), sticky price CPI inflation (green), personal consumption expenditure deflator inflation (black), all in decimal form (i.e., 0.05 means 5%). January PCE deflator is Cleveland Fed nowcast of 2/14. Chained CPI seasonally adjusted log levels X-13 (brown). NBER defined recession dates (peak-to-trough) shaded gray. Source: BLS, BEA, Atlanta Fed, Cleveland Fed, and author’s calculations.
All month-on-month measures save sticky price CPI inflation rise in January. Trimmed CPI inflation also rose, suggesting the acceleration was broad-based albeit more modes than for CPI overall. In any case, we know that month-on-month changes, while providing a more contemporaneous reading on inflation, have a larger noise component. Hence, I plot in Figure 2 m/m versus median, core and instantaneous (per Eeckhout) inflation (T=12, a=4).

Figure 2: Month-on-month CPI (black circle), and instantaneous inflation (T=12, a=4) (bold teal), month-on-month median inflation (purple), month-on-month core CPI inflation (tan), all at annual rates. NBER peak-to-trough defined recession dates shaded gray. Source: BLS, NBER, and author’s calculations.
Instantaneous (T=12, a=4) inflation is up to 4.4% from 3.4% in December (using CPI revised up through December, incorporating new seasonals, and new weights as of January data), but is still far less than 11.4% in June 2022. (For additional discussion of instantaneous inflation, see this post.)
Second, core inflation measures have stabilized at the m/m horizon (and continue to descend at y/y).

Figure 3: Month-on-month core CPI inflation (blue), chained core CPI (brown), personal consumption expenditure core deflator inflation (black), all in decimal form (i.e., 0.05 means 5%). January PCE deflator is Cleveland Fed nowcast of 2/14. Chained CPI seasonally adjusted log level using X-13 (brown). NBER defined recession dates (peak-to-trough) shaded gray. Source: BLS, BEA, Atlanta Fed, Cleveland Fed, and author’s calculations.
Fed funds (CME) futures imply no change to rates at the March 22 meeting, but slightly higher for May and June.
Addendum: Pawel Skrzypczynski has calculated CPI core ex-shelter; I’ve added q/q annualized inflation for CPI, core CPI and core CPI ex-shelter:
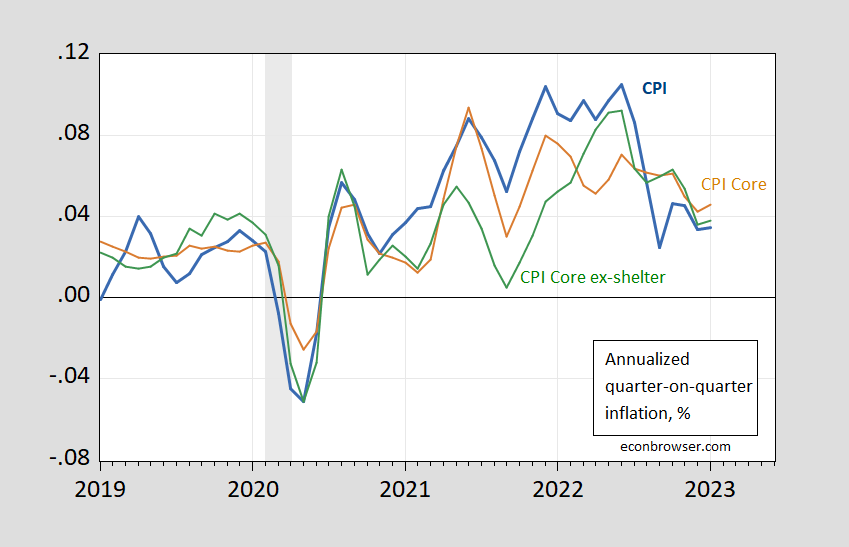
Figure 4: Quarter-on-quarter CPI inflation (bold blue), core CPI (tan), and core CPI ex-shelter (green), all annualized. NBER defined peak-to-trough recession dates shaded gray. Source: BLS via FRED, NBER, Pawel Skrzypczynski, and author’s calculations.
On a m/m annualized basis, core CPI inflation is 5.1%, while core CPI ex-shelter is 3.2%.
Krugman yesterday suggested m/m inflation would rise but we should not make too much of this.
“Heartache for the Fed and bad news for consumers as inflation remained searingly hot in January.”
Some know nothing over at LinkedIn. Searingly hot? What a dork. Oh yea – the dork works for KPMG so maybe I should not be that surprised.
The media correctly reported a slight reduction in the 12-month inflation rate, but they missed the story I think. On a monthly basis, the total CPIU in January rose faster (0.5%) than it did in December (0.1%) and the increase in the core index was the same as in December (0.4%). The reason why the 12-month rate fell in January has nothing to do with current inflationary pressures but to math. The calculation for the 12-month rate for the total index in December used the monthly value for January 2022, which was 0.6%. The calculation of 12-month rate for January dropped the 0.6% and included the January 2023 value of 0.5%. That swap accounts for the reduction in the 12-month rate between December and January. A more accurate reading of the January CPI data is that inflationary pressures are at least unchanged but may be a bit stronger than they were in December.
Kim Kowalewski: Excellent point. I am not a fan of y/y growth rates. Three month (which doesn’t deal directly with the point you mention) or m/m are more informative of current inflation trends.
While I know you dislike calculating average price increases from a point in time, June 2022 (294.7) through January 2023 (300.5) increased just under 2%. That’s not as scary as the January 2021 through June 2022 period.
https://fred.stlouisfed.org/series/CPIAUCSL.
There are still concerns that consumers will continue to be hit with higher food prices this year.
https://www.cbsnews.com/news/inflation-food-grocery-prices-financial-pain/
The U.S. Department of Agriculture Economic Research Service is forecasting a return to something closer to “normal” for food prices in 2023. At present, they are projecting grocery prices to increase between 3% and 4% over the course of 2023. Respondents to our Consumer Food Insights Survey also expect a decline in the rate of inflation during 2023. Whether these forecasts bear out remains to be seen. The Federal Reserve interest rate hikes to appear to have had some impact on the overall inflation rate, although this does not appear to have yet trickled down to food. Many analysts are projecting a recession during 2023, which would likely put downward pressure on spending and prices. According to our analysis, spending on fresh fruits and vegetables, and especially on food at restaurants and alcoholic beverages would likely to take the biggest hit if consumer incomes fall. While predicting individual food prices is always risky business, we are likely to see higher beef prices in the years ahead when the current reductions in breeding stock ultimately dent fed cattle inventories.
https://ag.purdue.edu/commercialag/home/paer-article/food-price-outlook-for-2023/
Bruce Hall: I don’t mind doing the calculation you have in mind; I just don’t think it should be called “inflation rate”, lest confusion reign. I would call it a cumulative change in the price level if you do what you do.
This is the best babbling you could manage? Kelly Anne Conway must feel disappointed she bothered to pay you anything.
“While I know you dislike calculating average price increases from a point in time, June 2022 (294.7) through January 2023 (300.5) increased just under 2%. That’s not as scary as the January 2021 through June 2022 period.”
Now when I pointed out that the annualized change in CPI was less than 2% – some whiny little boy named Bruce Hall went ballastic. Could you please tell this whiny little boy to stop using your name?
“A “hunger cliff” is looming for millions of Americans, with 32 states set to slash food-stamp benefits beginning in March. The cuts will impact more than 30 million people who are enrolled in the Supplemental Nutrition Assistance Program, or SNAP, in those states, according to data from the U.S. Department of Agriculture. Among the states where recipients are facing cuts are California and Texas, which have greatest number of people on SNAP, at 5.1 million and 3.6 million recipients, respectively.”‘
Huh – I found this in Brucie boy’s link. Another item Brucie boy forgot to read. Oh wait – he is happy with these cuts as the Bruce Hall solution to deficits is to slash assistance to starving children. After all – the idea that we make rich people pay more in taxes is SOCIALISM.
Now you’re being silly.
Bruce Hall
February 15, 2023 at 7:24 am
Brucie boy seems to suggest caring about children “is being silly”. Yea – we get to Brucie. You could care less about anyone besides your little MAGA self.
Doh!
And here I thought January was the seventh straight month of slower year-on-year price increases.
Silly me. If that was really the case, it would be the headline, wouldn’t it?
Core ex-shelter and core services ex-shelter/transportation/medical insurance seem to be useful slices of the report to watch (shelter lags, transportation impacted by energy, med insurance all over the place at least MoM). Looking at the former you see steady disinflation over 4mo or so, latter you see some potential stickiness in services and still rising, but at a lower level than the big headline prints.
Speaking of which, here’s a reminder of the lag between the actual sales price of private homes sold and owners equivalent rent:
https://fred.stlouisfed.org/graph/?g=1026l
We can already be reasonably certain that OER will begin to fall in coming quarters, based on the recent selling price of homes. Notice also the considerable size and persistence of the divergence between the two measures. Typically, big divergence leads to big adjustment in OER. Right now, that divergence demonstrates why CPI, or any CPI aggregate which includes OER, is of questionable value in setting policy.
So the BLS is now recalculating the consumer basket every year instead of every two years. This has an interesting feedback effect when inflation is changing rapidly. In this case, for example, because spending on housing has been increasing rapidly, the BLS has increased the weighting of housing in calculation of the index. The increased weighting has a small multiplier effect that amplifies housing inflation. This effect reverses as housing inflation declines.
You’ll know when I’m pretty lost or confused about any topic (at least in the current context) when I start referencing articles that quote Jerome Powell. It’s like my keyboard version of a shoulder shrug. The data in this link is old, I’m mainly linking this because the explanations given on certain inflation stats.
https://www.cnbc.com/2023/01/12/inflation-dropped-to-6point5-percent-in-december-2022.html
Menzie why do you prefer annualised monthly figures which must be more volatile than annual figures.
Is this another yank quirk
Not Trampis: Because y/y is more backwards looking than m/m. People usually have to trade off noise against being retrospective.
@ Not Trampis
Why would you care if a tornado is hitting your house, when you can just take the mathematical average winds of your city for the last 6 months?? This is kinda what you’re asking. I’m in the stop Fed “tightening” crowd. But sometimes you have to know what is happening now. Yes American culture is obsessed with “the now”, but it isn’t always a bad thing.
hmmm