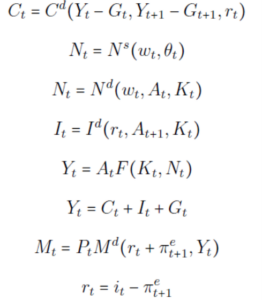
Consider the following model (from Garin, Lester and Sims):
Where
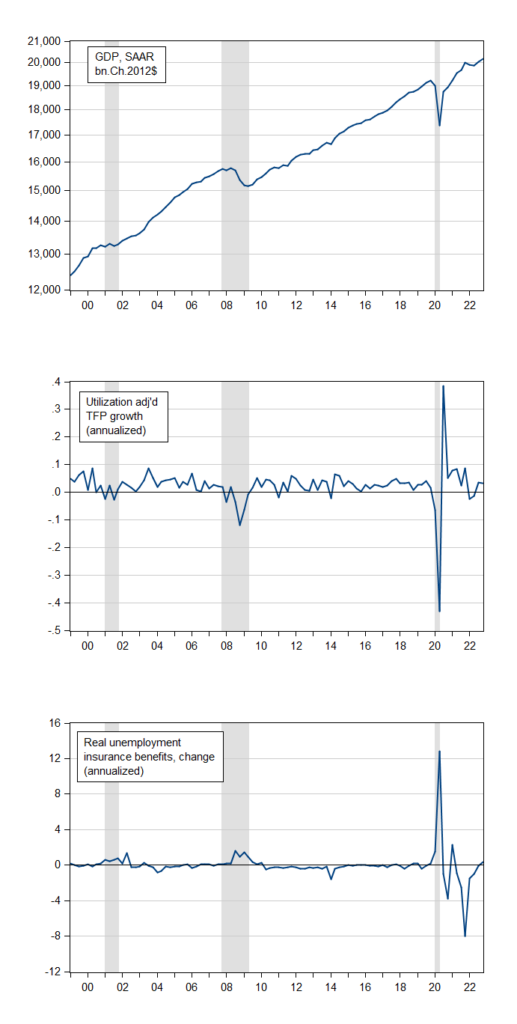
Do the following graphs of GDP, productivity shocks (ΔA) and unemployment benefits (Δθ) make sense in the context of the neoclassical model? That is, do the series in the bottom two graphs seem to explain the behavior in the series (e.g., recessions, booms) in the top graph?
Figure 1: Top panel – GDP in bn.Ch.2012$ SAAR. Middle panel: annualized quarter-on-quarter growth in total factor productivity adjusted for capacity utilization. Bottom panel: annualized quarter-on-quarter growth in real unemployment benefits. NBER defined peak-to-trough recession dates shaded gray. Source: BEA via FRED, SF Fed, NBER, and author’s calculations.


https://www.huffpost.com/entry/tucker-carlson-proves-meme_n_64083439e4b0c62918df5497
Check out how Tucker Carlson would have covered other important historical events including Auschwitz.
All other news organization are still being blocked from access to these tapes that were given exclusively to Faux “News”.
There will be a whole new set of mocking, when the real news get into showing what else these supposedly peaceful people did in clips Tucker didn’t show.
Maybe they can begin on it just by identifying people in the “Faux tourist tapes” and search for those people in already public files of convicted insurrectionists. Or just do fake news Fox style and take footage of the violent people before they become violent (then follow with tapes of the same person being violent). I think we will have months of fun from this.
Ken Burns has always been a national treasure. His latest is spot on:
https://www.msn.com/en-us/news/us/ken-burns-compares-desantis-bills-to-soviet-system-on-cnn-the-way-the-nazis-would-build-a-potemkin-village/ar-AA18kBku
Documentary filmmaker Ken Burns joined CNN on Tuesday and accused Florida Governor Ron DeSantis (R) of creating a Soviet-like system through his bills targeting materials available in public schools…“By trying to dictate what teachers can and cannot teach, Florida House Bill 999 is an assault on the very liberties articulated by the Founders,” Burns recently tweeted.
Burns is a little too far to the left even for my taste. But there’s not much argument Burns has improved the public dialog and civics dialogue in America. He probably won me over with his baseball stuff, but the public parks stuff was good (minus the dramatizations). Some of acting scenes were just goofy community theatre B-acting in the public parks one. Like watching Barbara Stanwyck, Joan Crawford, or Burt Lancaster. But just reminding people the importance of public parks is a great contribution. I hope many of them, even the big ones can remain free to the public, with no ticket charge. Everyone (outside of maybe violent criminals) deserves to have that joy.
My parents took the mules down the Grand Canyon, and they heaped praise on the experience years after.
I’m assuming this post is 95% intended for Menzie’s students’ eyes/adventures, but also that Menzie doesn’t mind terribly if we give our thoughts on it. Obviously Menzie can choose to not post this if I am obstructing the students’ learning with my thoughts.
I was slightly (“slightly” here read as very) confused by some of the variables (as I often am) because some letters can have different meaning depending on the economics exercise/ equation. And also some of them I flat out don’t know. I think the crux of the questions (although I’m sure there’s build up foundation in previous chapters, the crux of the info here, is in Chapter 18. Examples being, as the book itself mentions, Chapter 9 and Chapter 12.
Professor Chinn
A couple dumb questions:
RE: “That is, do the series in the bottom two graphs seem to explain the behavior in the series (e.g., recessions, booms) in the top graph?”
Using an eyeball test the bottom two graphs look related, to the first graph, but…
1. Can we use Granger Causation to answer your question?
2. How much of the Garin, Lester and Sims 1,000+ page text does an ignorant person need to read to answer your question?
AS: (1) Maybe, although using Granger causality still relies upon the “technology shock” measuring a true technology shock. (2) Chapters 18-20 discuss the neoclassical model and RBCs.
Thanks.
Hang on…is this a trick question? Real business cycle models have snuck into the conversation.
I vaguely recall that RBCs rely on two assumptions – technology shocks and big voluntary swings in employment – to deal with deviations in output from trend. Rather like assumptions of perfect information, rationality, frictionless trade and the like, technology shocks and big voluntary swings in employment are assumed as a way to sweep Keynesianism under the rug. The assumptions adopted to dispense with Keynes are as problematic as anything in Keynes. I don’t think the shocks in question had much to do with technology.
@ AS
I, I don’t know how to say it, “intensely skimmed” (oxymoron?) chapter 18. I picked up some broad level things that I had either not learned or had long forgotten. I would say it’s worth reading just for some “big picture” understandings, even if you still felt a little handicapped answering Menzie’s question. You’re better at forecast stuff than I am, so if I learned something you can probably pick up twice the enlightenment I did.
Just learning the variables’ letters/symbols is useful as I think they are kind of “universal” among economists, although some slight differences between texts/papers.
I thought the answer might be something loosely related to the McCall model, mentioned in Chapter 17.
Moses.
Thanks for the comments.
Speaking about enlightenment, it would be great to have a guest contributor demonstrate how the contributor forecasts nonfarm payroll.
I will most likely be too high with my forecast of Friday’s nonfarm payroll at 284k. Below is a summary list of forecasts I could find from economic calendars.
At least I am within the Econoday range.
AS ********************284k
Bloomberg**************200k
Briefing.com*************220k
Briefing consensus*******205k
Econoday**************215k ******range**175k to 325k
MarketWatch***********225k
Did you adjust for weather’s boost in January? Heating degree days in February were below average for the month, but January was considerably further below average. A ballpark estimate for jobs added to the January tally due to weather is 125,000. Some part of that will probably be subtracted from February jobs.
MD,
Thanks for the thoughts, but no, I am not that sophisticated to adjust for weather and heating degree days. Do you have a source for heating degree days?
I notice that EIA has an entry, but I have not yet carefully reviewed possible data.
Degree-days – U.S. Energy Information Administration (EIA)
https://www.eia.gov/energyexplained/units-and-calculators/degree-days.php
At first thought, heating degree days would seem to affect outside jobs such as construction.
Speaking of January weather, Powell made mention of it in testimony, recognizing that a poor match between reality and seasonal adjustment could account for the strength of some of January’s data. Marketplace noticed, too:
https://www.marketplace.org/2023/03/08/how-much-should-we-trust-seasonally-adjusted-numbers-these-days/
Speaking of seasonality, here’s a look at core CPI, not seasonally adjusted:
https://fred.stlouisfed.org/graph/?g=10WKU
Note that in a typical year, Q2 is one of two quarters in which price increases are tame, Q4 being the other. Last year, Q2 was the strongest quarter for price increases. Quite a shock for Fed folk.
So let’s pretend to be a Fed guy. Another Q2 like the one last year would be a nightmare. (Not likely, since Q2 last year was the first full quarter of Russia’s renewed war in Ukraine, but January induced memories of last Q2.) On the other hand, Q2 this year is likely to show a sharp reduction in y/y inflation, core and headline, due to base effects. The press loves y/y inflation comparisons, so Q2 may provide cover for an end to rate hikes. I doubt Bernanke or Yellen would have been this timid, but Powell isn’t either of them.
@ AS
OK, the paper is disgustingly long. And I have not read it all myself. But remember, Menzie’s shanty town minions aim hard and go above and beyond the call for customer satisfaction:
https://www.brookings.edu/wp-content/uploads/2015/09/BoldinTextFall15BPEA.pdf
AS,
Here’s one source:
http://www.faculty.luther.edu/bernatzr/DecWx/Month01/Data/HDD_01.htm
http://www.faculty.luther.edu/bernatzr/DecWx/Month02/Data/HDD_02.htm
Note how months are differentiated.
Heating degree days aren’t a perfect indicator of weather effects on the economy. Precipitation matters, too, but this gives an easy way to check on likely weather effects.
@ AS
I like 268k. I think you’re in the ballpark. I think you’re closer than the consensus.
311,000
That damned so-and-so AS beat me on the forecasting again. June, I think our boy has all grown up now.
We both beat the consensus forecast though. What does AS and Uncle Moses both beating the consensus forecast for Non Farm Payrolls mean for the broader humanity?? Will FOX News TV hosts stop making private comments that are polar opposite to their publicly made comments?? Will pickup owners stop driving over icy bridges and icy overpasses in winter with empty truckbeds?? Tune in for tomorrow’s episode of “As the World Gropes Itself.