Productivity growth underperforms (-2.7% vs. -1.8% Bloomberg consensus, q/q AR), while unit labor costs surprises on the upside (+6.3% vs. +5.5% consensus, 3.3% previous).
Hours rose as output fell. Seemingly pretty bad news, but I think it’s useful to put these recent growth rates in context by looking at the levels.
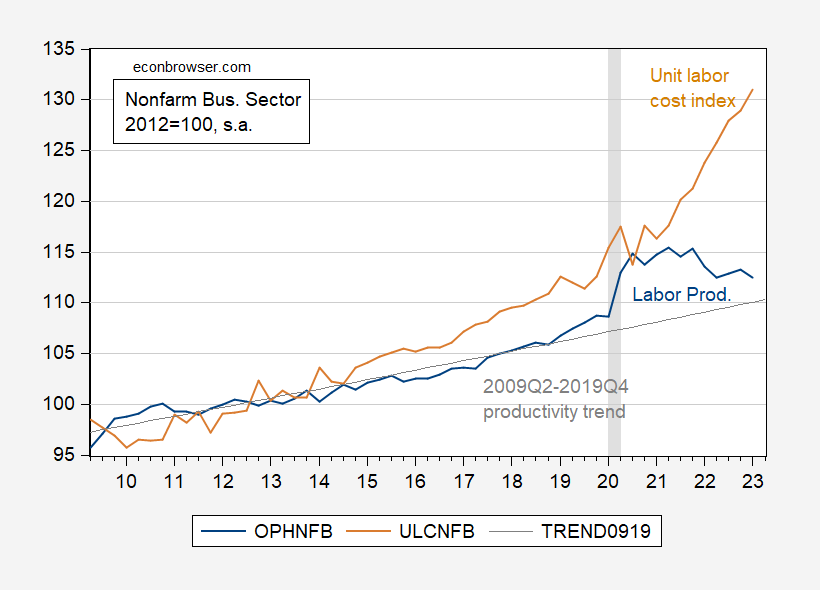
Figure 1: Nonfarm business sector output per hour index (blue), 2009Q2-2019Q4 deterministic trend (gray line), and unit labor costs index (tan), all 2012=100, all on log scale. NBER defined peak-to-trough recession dates shaded gray. Source: BLS, NBER, and author’s calculations.
One should view the lackluster productivity growth against the backdrop of an immense surge in measured productivity associated with the labor shedding during the pandemic, and the shortfall in employment relative to pre-pandemic trends. The current level is above the pre-pandemic trend (not that that is where productivity should be – that depends on lots of other factors). Right now, we are adjusting out of labor dis-hoarding into labor hoarding, explaining the decline in measured labor productivity.
(Note that these estimates will be revised over time; 80% of changes from advance to 3rd release to q/q AR productivity range from -1.0% to +1.4%.)
On the other hand, unit labor costs — the ratio of compensation to real output per hour — continued to rise. One way of thinking about this variable is that it represents a form of cost-push shock. Hence, a quickly rising unit labor cost (ULC) index confronts the Fed with a tougher challenge, as compared to a decelerating growth of ULCs.
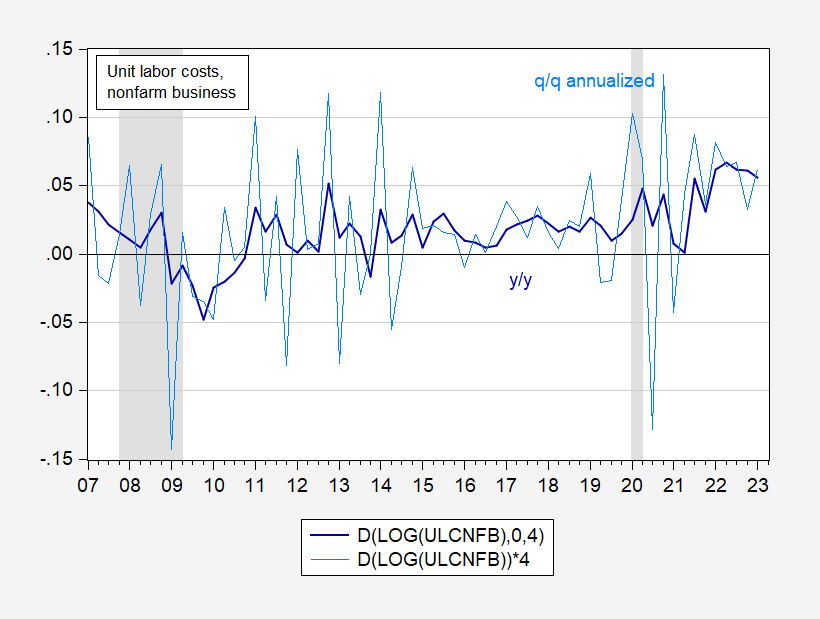
Figure 2: Growth rate of year-on-year unit labor costs (ULC) (dark blue), and quarter-on-quarter annualized (light blue), both calculated using log differences. NBER defined peak-to-trough recession dates shaded gray. Source: BLS, NBER and author’s calculations.
Final note: We rely on labor productivity because we believe we estimate it with greater accuracy than total factor productivity. In fact, total factor productivity (TFP) calculations are also affected by changes in capacity utilization (so capital “hoarding” as well as labor hoarding). Below I present y/y growth in labor productivity (from Figure 1) as compared against y/y growth in TFP and utilization adjusted TFP, as estimated by John Fernald.
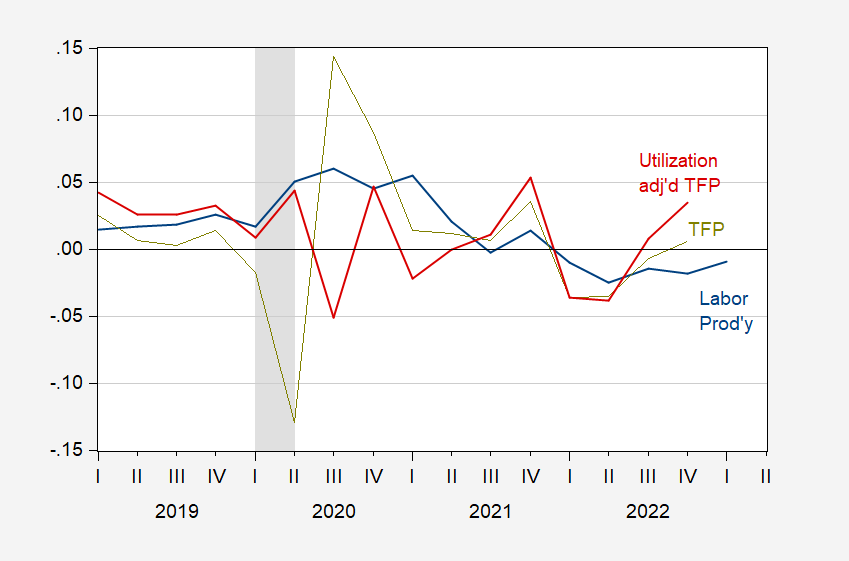
Figure 3: Year-on-year growth rate of output per hour (blue), of total factor productivity (chartreuse), and utilization adjusted total factor productivity (red), all calculated using log differences. NBER defined peak-to-trough recession dates shaded gray. Source: BLS via FRED, Fernald/SF Fed, NBER, and author’s calculations.
Update, 9PM Pacific:
House, Orazem, Furman and I discussed the numbers on MarketPlace today.
https://fred.stlouisfed.org/graph/?g=lSy9
January 30, 2018
Manufacturing and Nonfarm Business Productivity, * 1988-2023
* Output per hour of all persons
(Percent change)
https://fred.stlouisfed.org/graph/?g=lSyd
January 30, 2018
Manufacturing and Nonfarm Business Productivity, * 1988-2023
* Output per hour of all persons
(Indexed to 1988)
https://fred.stlouisfed.org/graph/?g=DPeJ
January 4, 2018
Manufacturing and Nonfarm Business Productivity, * 2017-2023
* Output per hour of all persons
(Percent change)
https://fred.stlouisfed.org/graph/?g=DPeL
January 4, 2018
Manufacturing and Nonfarm Business Productivity, * 2017-2023
* Output per hour of all persons
(Indexed to 2017)
Isn’t labor productivity somewhat volatile? Now how much of this rise in unit labor costs the movement in measured productivity versus labor compensation?
https://fred.stlouisfed.org/graph/?g=VIBB
January 4, 2018
Manufacturing Productivity & Compensation, 1988-2023
Output & Real Compensation * Per Hour
* Includes wages, salaries, and employer costs for employee benefits.
(Percent change)
https://fred.stlouisfed.org/graph/?g=VICJ
January 4, 2018
Manufacturing Productivity & Compensation, 1988-2023
Output & Real Compensation * Per Hour
* Includes wages, salaries, and employer costs for employee benefits.
(Indexed to 1988)
https://fred.stlouisfed.org/graph/?g=Siid
January 30, 2018
Nonfarm business productivity and real compensation, 2017-2023
(Percent change)
https://fred.stlouisfed.org/graph/?g=Sii4
January 30, 2018
Nonfarm business productivity and real compensation, 2017-2023
(Indexed to 2017)
I wonder how much executive board pay effects an individual firm’s unit labor cost and if that number (or a pool of firms’ numbers) could be scaled (??) to measure executive board pay’s impact on unit labor cost of the entire U.S. economy??
https://fred.stlouisfed.org/graph/?g=z21W
January 15, 2018
Shares of Gross Domestic Product for Private Fixed Nonresidential & Residential Investment Spending, Government Consumption & Gross Investment and Exports of Goods & Services, 2017-2023
https://fred.stlouisfed.org/graph/?g=z21I
January 15, 2018
Shares of Gross Domestic Product for Private Fixed Nonresidential & Residential Investment Spending, Government Consumption & Gross Investment and Exports of Goods & Services, 2017-2023
(Indexed to 2017)
Except I see little challenge. These so called “costs” are mythical and made up bean accounting. Unit pure cost is up because per person is down. This cannot be accounted for in how it affects inflation. It may effect little.
GREGORY BOTT: What you have written is pure gibberish.
Denial is a river…….just because you make a graph doesn’t make it so. Much like “solar” tariffs nonsense. Not only is the U.S. Solar industry foreign led, but it’s quality is poor. Most US manufacturing has a large foreign component. 50% of West Virginia coal goes to China. Maybe we should ban it?????
The Bott is an early version of ChatGPT.
pgl: If it is, it’s a *very* early version.
Just a reminder – there is room for gain in real compensation even in the absence of gains in productivity, merely to catch up on prior disparities:
https://fred.stlouisfed.org/graph/?g=139hW
Or, to put it another way:
https://fred.stlouisfed.org/graph/?g=139jt
Off topic, banks –
This is probably not good:
https://ycharts.com/indices/%5ES2TR
Complex as finance can be, sometimes it’s simple. Investors might, for instance, decide “I will keep shorting regional/mortgage exposed/poorly capitalized banks until thr Fed cuts rates.”
The rule is, never fight the Fed. That rule is interest-rate-centric; betting against banks that have not planned well for Fed tightening isn’t “fighting the Fed.”
Market pricing says “The Fed will ease.” Powell’s message this week was “We’ll see.” That’s fighting the Fed. Banks are caught in the middle.
I have been reading “How the World Became Rich – the Historical Origins of Economic Growth” by Koyama and Rubin. The section on the economic impacts of the Black Death is interesting. With population reduced by 50% in some areas – wealthy overlords tried to impose low wage labor laws and restrict movement from people trying to move to other more prosperous areas. But eventually the Black Death lead to the end of serfdom across Europe.
I see some parallels with our current pandemic and more than a million excess deaths in the U.S. Having to increase pay for low-wage workers. And – also – the GOP trying to impose harsh child labor laws – https://www.npr.org/2023/04/27/1172544561/new-state-laws-are-rolling-back-regulations-on-child-labor (here in Wisconsin the GOP is proposing that 14 year olds not only be forced to work in slaughter plants and operate heavy machinery – but also serve alcohol to adults https://www.cbsnews.com/news/wisconsin-bill-14-year-olds-serving-alcohol-tony-evers-britt-cudaback/ – by the way – in some taverns I have been in Wisconsin – I can easily imagine having a 14 year old server will lead to an underage drinking party among local youth.) Also I notice the GOP is restricting the movement of young women in some red states – https://www.theguardian.com/world/2022/may/03/us-abortions-travel-wave-of-restrictions
I foresee further economic deterioration for red states/red areas and people moving to blue areas/blue states for more personal freedoms and better jobs, public infrastructure, healthcare, education, and ability to vote.
Back on topic (-ish):
Unemployment in the first four months of the year was 3.47%, down from 3.77% a year earlier, and 3.78% in pre-COVID January-April 2019. The number of unemployed people has fallen 6.5% this year, while employment rose 1.8%. Notably, non-management manufacturing employment rose by 2.9%.