With industrial production coming in, we have the following picture of some key business cycle indicators followed by the NBER BCDC. Also included is GDPNow as of today.
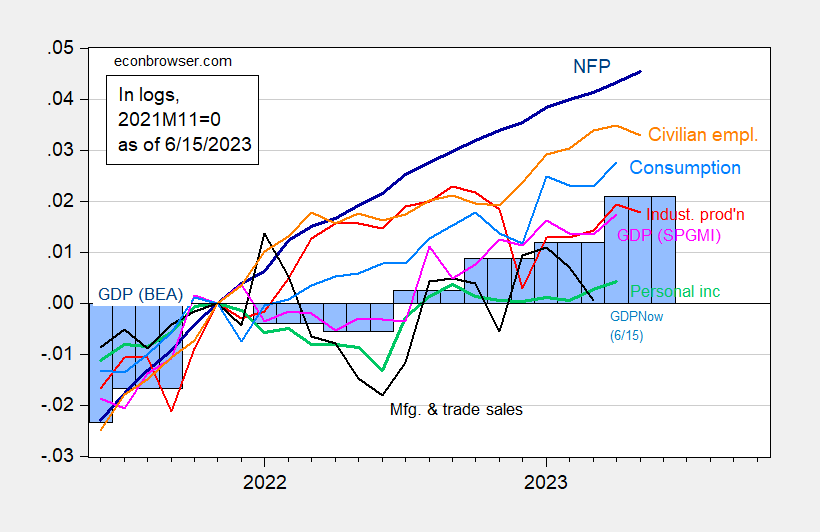
Figure 1: Nonfarm payroll employment, NFP (dark blue), civilian employment (orange), industrial production (red), personal income excluding transfers in Ch.2012$ (green), manufacturing and trade sales in Ch.2012$ (black), consumption in Ch.2012$ (light blue), and monthly GDP in Ch.2012$ (pink), GDP (blue bars), 2023Q1 is GDPNow of 6/15, all log normalized to 2023M01=0. Bloomberg consensus level calculated by adding forecasted change to previous unrevised level of employment available at time of forecast. Source: BLS, Federal Reserve, BEA 2023Q1 2nd release via FRED, Atlanta Fed, S&P Global/IHS Markit (nee Macroeconomic Advisers, IHS Markit) (6/1/2023 release), and author’s calculations.
Industrial production: down -0.5% from 9/22 peak
Real manufacturing and trade sales: likely close to unchanged in April, still down -1.0% from 1/23 peak
Real personal income less transfer receipts: up +0.05% from previous 1/23 peak
Real spending on goods: down -0.002% from 1/23 peak
Real spending on services: up +0.4% since 1/23 (often peaks only after recession begins)
Payrolls: up +0.7% since 1/23
So, are you still thinking before end of 2023 for the recession??
An actual good answer to your question would require an epistle. Here’s the Cliff’s Notes version of the Cliff’s Notes version instead.
The NBER might ignore increasing payrolls (it did several times the 1970s), but not a big increase in real consumer spending as well.
The big decline in gas prices in H2 last year fueled an increase in real disposable consumer income. Aggregate real payrolls reflect that. And that increased income has been deployed particularly on services. Since consumption leads employment, this is in turn continuing to fuel job growth. That effect will probably abate in H2 this year as YoY comparisons are less positive.
BUT ALSO, supply chain disruptions in the vehicle and construction industries have disrupted the Fed’s typical interest rate transmission mechanism. Instead of declining, vehicle sales are still increasing, and housing under construction is only about 2% off peak, whereas it usually takes a decline of 10% or more to be consistent with a recession.
The bulk of long and short leading indicators still say recession is near – just as they have for the last 6+ months. I think the producer side of the economy may already be in a very shallow downturn. But because of the special issues with vehicles and housing, I don’t have a good feel for when those might turn down enough to put the final nail in this expansion’s coffin.
Appreciate the reply. Some nutrition to chew on.
Incidentally, the Philly Fed’s estimate based on the QCEW for Q4 is out:
“ For 2022 Q4, payroll jobs in the 50 states and the District of Columbia rose 0.3 percent, after adjusting for QCEW data.” (Roughly 450,000).
Based on the steep slowdown in the QCEW numbers, this isn’t a surprise. Of course, we had a similar situation for Q2, that got revised away later.
Just double-checked. Looks like that 0.3% is an annualized rate. That would make the total Q4 estimated gain only about 100,000-125,000 jobs.
Subject to revisions!