New Deal Democrat suggests normalizing on 2023M01 instead of to 2022M11. Here’re the NBER BCDC indicators, plus monthly GDP, as well as a slew of others, since then.
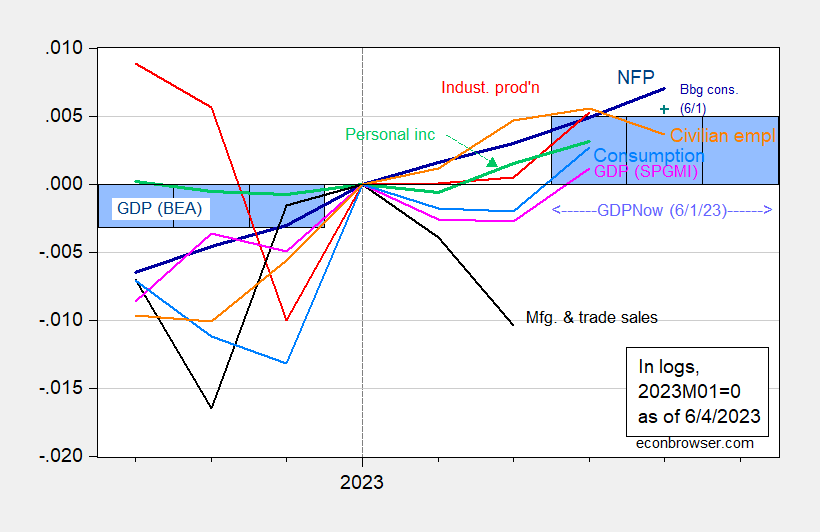
Figure 1: Nonfarm payroll employment, NFP (dark blue), Bloomberg consensus of 6/1 (blue +), civilian employment (orange), industrial production (red), personal income excluding transfers in Ch.2012$ (green), manufacturing and trade sales in Ch.2012$ (black), consumption in Ch.2012$ (light blue), and monthly GDP in Ch.2012$ (pink), GDP (blue bars), 2023Q1 is GDPNow of 6/1, all log normalized to 2023M01=0. Bloomberg consensus level calculated by adding forecasted change to previous unrevised level of employment available at time of forecast. Source: BLS, Federal Reserve, BEA 2023Q1 2nd release via FRED, Atlanta Fed, S&P Global/IHS Markit (nee Macroeconomic Advisers, IHS Markit) (6/1/2023 release), and author’s calculations.
As New Deal Democrat points out, NFP and personal income are not as obviously rising as when normalized to 2022M01. They are, however, still rising (CPS series civilian employment is falling May, but as noted elsewhere, one should not put too much weight on this series given its volatility). Note GDPNow growth as of 6/1 (so using data from 2/3 of quarter 2) is positive, at 2% q/q SAAR.
And alternative series.
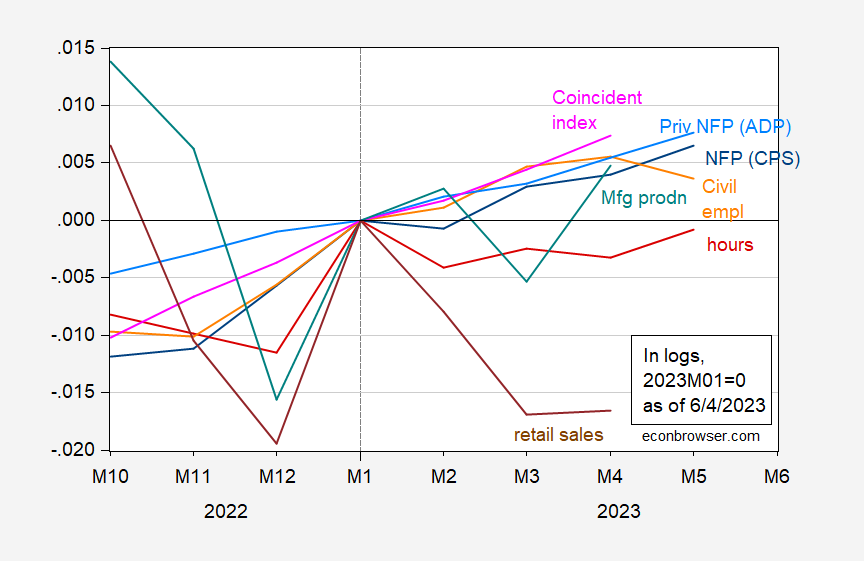
Figure 2: Civilian employment adjusted to nonfarm payroll employment concept (dark blue), private nonfarm payroll employment from ADP (sky blue), civilian employment (orange), aggregate weekly hours for production and nonsupervisory workers (red), manufacturing production (teal), coincident index (teal), retail sales ex-food services deflated by CPI (brown), all log normalized to 2023M01=0. Bloomberg consensus level calculated by adding forecasted change to previous unrevised level of employment available at time of forecast. Source: BLS, Federal Reserve, and Philadelphia Fed via FRED, and author’s calculations.
Aggregate hours are indeed down slightly. Retail sales too, although that series is quite volatile. This series has been trending downward since 2022M04.
So, looking at a shorter period, one might be able to infer a deceleration more clearly.
Thanks for posting.
One difference in my note was that industrial production peaked in September 2022, and I normed it to 100 (.000 iin your iteration) there. So my take is the production is still down, even if it was up in April relative to January. And real personal income is only up .1% from its previous September 2022 peak.
Also, as to real personal consumption expenditures, in both the 2001 and 2008 recessions, they continued to rise well into the actual recession. As best as I have been able to construct the measure back to 1959 (using the nominal figure divided by the chain weighted index), it also rose well into or even throughout about half of the recessions between then and the end of the century. Which means to some extent I am discounting its continued increases now (although it is a very robust increase. Particularly as to services).
I’ll tell you, and you can take it for whatever it’s worth since I can’t crunch numbers as well as you and “AS” and Menzie can. But I don’t see a recession happening in ’23. I might see it as a possibility not far after ’23, but I don’t even see a “start date” pre December 31 ’23. And when I say “start date”, I mean as in NBER-BCDC looks at it 3 years from now and decides it “began in ’23”. I just don’t see it.
Speaking of the business cycle, something odd happened this past week in ocean freight rates. The Baltic dry index fell 21.6%:
https://tradingeconomics.com/commodity/baltic
The Xeneta Shipping Index (XSI) recorded a record-large 27.5% drop in container rates in May.
https://www.ajot.com/news/xeneta-container-rates-alert-long-term-ocean-freight-rates-collapse-by-almost-30-in-a-month-as-new-us-contracts-reflect-market-reality
https://xsi.xeneta.com/
An ETF which tracks dry shipping firms is behaving rather like the Baltic index:
https://www.marketwatch.com/investing/fund/bdry
For the inflation outlook, this is good news. Otherwise, maybe not so good. These declines follow several months of falling freight rates, so while rates were elevated a year ago, they no longer are. This latest drop looks like a vote against the global outlook.
Here are exports for the U.S. and China as of March:
https://fred.stlouisfed.org/graph/?g=15OYw
Aside from the latest jump in Chinese exports, which tend to be noisy, the recent trend is toward weaker export growth. Freight rates suggest April and May were probably weak. China has a new Covid surge underway, but it’s not clear that has much to do with the plunge in shipping rates.
The Baltic Exchange Dry Index has shown a lot of volatility over time. It reached incredible highs during the commodity boom some 15 plus years ago and then plummeted starting with the Great Recession. This index rose a lot during the recovery from the pandemic but as the global economy weakens, this index is plunging again. Shipping can be profitable in good times and brutal in others.
Eurozone inflation down to 6.1% in May vs 7.0% in April. Mainly due to energy and food. Mixed messages in USA auto sales. month to month auto sales lower while year to year auto sales are higher. Supply at dealerships is improving while they claim there is still “pent-up” demand. I’m not sure how you measure that last part though. Maybe someone can tell us how to tabulate “pent-up” demand for cars. My thought is that it’s wise to wait as long as you can if you’re on the fence about getting a new car. The 2007 Toyota is still holding up while I educate myself on these models. Reading pays off. Two years ago Kia was at the top of my list. Now I wouldn’t even walk onto a Hyundai or a Kia dealership for free hot dogs and soda. And you know I love freebies.
This may explain some of the weakness in freight rates, but rates are down in Europe and Asia, as well rates for U.S. bound cargos:
https://www.cnbc.com/2023/06/02/west-coast-ports-shut-after-union-workers-walk-off-job-over-wages.html
More strikes.
I wonder what a simple click on the 5 year graph of either of these would tell us about chances of a recession in the next 3 years?? That the Fed should have been raising rates because of demand side inflation?? Who do the rate increases really help and why does it help them??
https://fred.stlouisfed.org/series/TERMCBAUTO48NS
https://fred.stlouisfed.org/series/PSAVERT
We’ve been told (sold), by credentialed economists (Larry Summers etc) that “a flood of money” was released during the Covid pandemic. How does that equate with a savings rate of 8% pre-pandemic and a savings rate of 4% post pandemic?? I guess the geniuses working at Harvard have figured out Americans can’t stand to see anything over 4 figures in their savings/checking?? Or is the “flood of stimulus money” and “demand created” inflation just a large pile of cow crap, dished out to explain profiteering and predatory price practices, sold as “demand caused inflation” to the American public by Larry Summers and his pals at CNBC/Bloomberg??
Gosh, I wonder…….. But who goes singing to the bank with high profit margins while simultaneously blaming wage earners for the inflation?? Gosh, it almost makes Larry Summers and friends seem like proponents of class warfare, doesn’t it?? Naaaahh!!! Only the great unwashed ever partake in class warfare. The bums.
Saudi Arabia has cut another million barrels per day from production:
https://www.latimes.com/business/story/2023-06-04/saudi-arabia-cuts-oil-output-by-1-million-barrels-per-day-to-boost-sagging-prices
Recall that Saudi Arabia’s oil minister had been jawboning speculators ahead of the OPEC meeting:
https://www.middleeasteye.net/news/saudi-oil-minister-tells-speculators-watch-out-and-blasts-climate-activists
You’d think the Saudis would know better. Crude prices just suffered their worst monthly fall since November, 2021, following OPEC’s April production cut announcement. I guess this is where desparation sets in.
Here’s the picture:
https://fred.stlouisfed.org/graph/?g=15P3D
interesting:
us continues to draw the strat petrol reserve,
26 May inventory all product in usa is 7.8% more than year ago, cumulative domestic crude +4.6% yoy, cum crude imports -30% yoy and usa cum net exports +777% (i double checked the decimal) yoy.
i do not think aramco is turning away buyers!
While we’re (I’m) on the topic of trade, here’s an example of why friends don’t let friends trust pundits, no matter how smart or well-intentioned:
“When some people hear “decoupling”, they think of an Iron Curtain type situation — a world carved into two separate and distinct trading blocs, one led by China and the other led by the developed democracies, each of which trades with each other but not with the other bloc. While I do think something like this is a possibility in the long term, I would be surprised if it happens in the short term. You can see in the trade numbers that we’re not even really headed in this direction yet; Chinese exporters may have lost a bit of profitability, but U.S.-China trade hit an all-time high in 2022.”
https://www.noahpinion.blog/p/decoupling-is-just-going-to-happen
That’s Noah Smith, a very smart man. Notice how Smith relies on nominal bilateral trade, not scaled against anything but Itself. We all know that’s a questionable practice with growing, currency-denominated series. Growing series hit all-time highs quite regularly.
Let’s instead look at U.S. imports from China as a share of total U.S. imports:
https://fred.stlouisfed.org/graph/?g=15P4I
Some things to notice. China’s share of U.S. imports flattened out from 2015 and has been falling since 2018. Not only that, but Smith looks to be wrong about 2022 being a record year for U.S. imports from China. Smith relied on a press report from the BBC; FRED shows 2018 as the record year by a slight margin. FRED also shows a very sharp decline in U.S. imports from China so far this year, which pretty strongly falsifies Smith’s underlying claim about trade.
The point Smith wants to make is that investment will decouple – is decoupling – sooner than trade. I don’t know what the appropriate comparison would be to make that argument, but I know that Smith got off to a poor start by making a naive, mistaken claim about trade.
Smith is able enough to check his assertions, but he didn’t. Smith may not have a habit of thinking about ratios when dealing with series which are growing. He did a pundit thing, relying on a press report. By the numbers, trade decoupling is already underway.
Don’t rely on pundits.