Headline m/m +0.1% vs. +0.2% Bloomberg consensus, core at +0.4% at consensus. Here are several measures on a month to month basis (annualized).
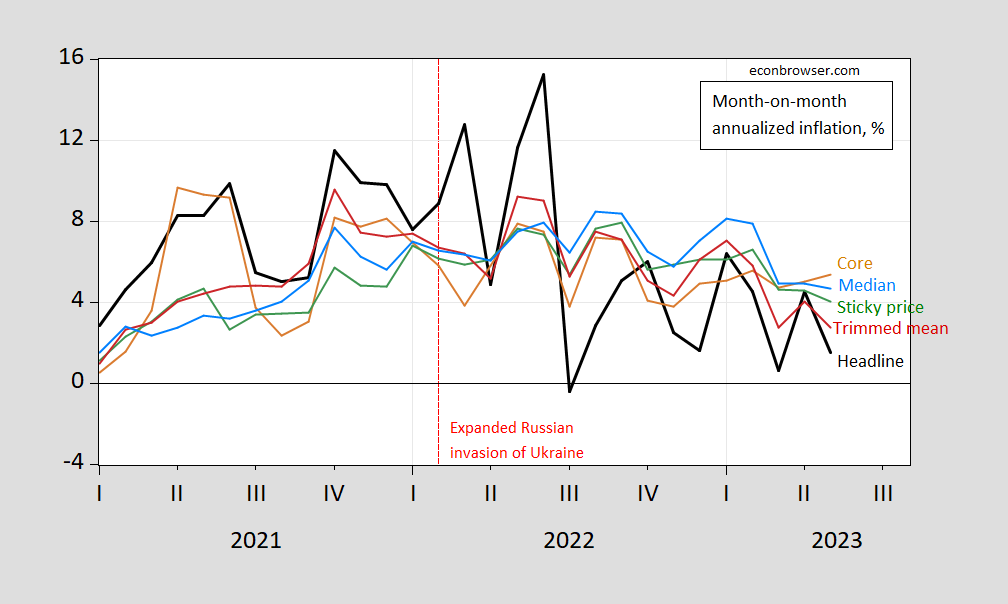
Figure 1: Month-on-month annualized inflation for headline CPI (bold black), core (tan), sticky price (green), trimmed mean (red), and median (sky blue), all in %. Source: BLS, Atlanta Fed, Cleveland Fed, and author’s calculations.
What about core services ex-shelter? Pawel Skrzypczynski has the data here.
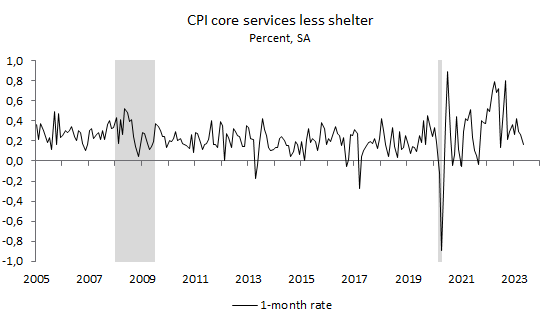
Source: P. Skrzypczynski, 13 June 2023.
There’s a downward trend for all m/m measures, save core (although core services ex-shelter is down).
Can we infer something about headline trend. I plot instantaneous inflation (T=12, a=4) per Eeckhout (2023), compared against m/m and the conventional 12 month change.
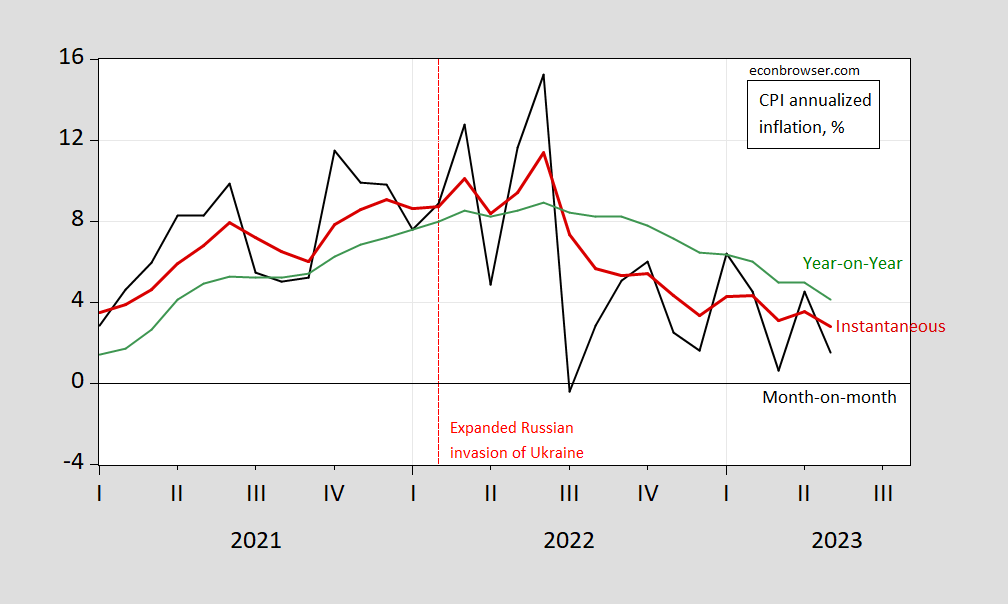
Figure 2: Headline CPI month-on-month inflation (black), instantaneous (T=12, a=4) (bold red), and year-on-year (green), all in %. Source: BLS, and author’s calculations.
Instantaneous inflation in May is 2.8%. Over the 1986-2023M04 period, CPI inflation run about 43 bps higher than PCE price inflation, so translating accordingly, one can think of instantaneous inflation about 0.4 ppts higher than the level consistent with a 2% PCE inflation target.
Whether the downtrend in high frequency inflation will decline substantially and quickly is the big question. Jason Furman explains why he is skeptical.
Just to repeat, y/y headline CPI and core services ex-shelter are both going to soften due to base effects after July 2022 drops out. Year-ago inflation shouldn’t figure into policy decisions much at all.
Cormac McCarthy passed away.
https://www.theguardian.com/books/2023/jun/13/cormac-mccarthy-dead-novelist
Eventually there had to be a good man with that surname.
“The CPI-based Ecumenical Underlying Inflation measure was 3.5% in May, down from 4.0% last month. This is the median of 21 measures (7 measures over 3, 6 and 12 months each) all re-meaned to match PCE inflation.” Furman
Is 3.5% too high? Little Brucie boy goes “oh no” the price level rose last month. Yea – he is the type of gold bug Krugman noted in his recent oped, which suggested our inflation target should be somewhere between 3% and 4%.
pgl,
Thank you for letting us ignorant(me) know what the Ecumenical Underlying Inflation measure is and how calculated.
Not being on Twitter, I am not certain if I saw all of Furman’s comments.
https://fred.stlouisfed.org/graph/?g=10MV2
January 15, 2020
Consumer Price Index for Food and Energy, 2020-2023
(Percent change)
https://fred.stlouisfed.org/graph/?g=10MV4
January 15, 2020
Consumer Price Index for Food and Energy, 2020-2023
(Indexed to 2020)
Furman is always objective in his analyses (just like Jim Hamilton). Furman is also not afraid of clearly stating his thoughts and projections. Most others in this arena aren’t nearly as respectable. I’m glad Menzie is linking to Furman to show how things should be done.
Econned: Glad you admire Furman’s writings, as I have. I actually know Furman. I don’t think we’re that far apart in how we think methodologically. Don’t think we write in such different ways (you’ll note that if you do a search on Econbrowser, he is cited numerous times). I suspect you just just have an aversion to me personally, which explains why you go ballistic when reading this weblog.
Menzie Chinn,
I see I’ve struck a nerve…
-I do admire Furman’s style
-I also “actually know Furman”.
-You and Furman do have similarities methodologically (moreso school of thought), but he kind of publicly put you in your place recently from a methodological perspective as I’m sure you remember regarding statistical significance (although I doubt you see it that way).
-The approach you take when writing for pop-econ is very different than Furman’s.
-You citing Furman has zero to do with your writing style relative to Furman.
-I don’t know you personally and – based on this blog, your research, and the sparse public appearances I’ve witnessed of you – I don’t have an opinion of you personally… my aversion to your blogging is that you’re extremely biased and subjective and you put on a front to act as if you aren’t biased/subjective.
-Me pointing out your biases and subjective analyses isn’t “going ballistic” and I’d challenge you to show an example of me actually “going ballistic” – whatever that means on an econblog.
Econned: I’m going to stick to substantive matters here. I don’t think he would agree he “put me in my place”. The issue is whether it makes more sense to treat the CPI as a I(1) series or a segmented (deterministic) trends series. see https://econbrowser.com/archives/2022/04/four-questions-and-four-answers-us-and-euro-area-core-inflation
Menzie,
Because I’m certain Furman respects you as a colleague (and because Furman is generally a nice guy who isn’t in it for the “gotcha”) he restrained himself. Even still, he borderline mocked your analysis. See, e.g., “Not sure I agree. If you asked which country grew faster over the last decade France or Belgium you would not ask whether the forty quarterly growth rate differences in the growth rates was statistically significant. Among other issues is measurement error, including seasonal adjustment errors, some of which are serially correlated. You would need a complex specification for the 40 quarterly growth differences. Or you could avoid that and do the 10-year difference. To make it more extreme, if we had daily growth rates would we do 3,650 of the daily differences? Might not show a star significant difference btwn Italy and US growth. But a decade of cumulative data would.“
Econned: Suppose we think segmented trends is appropriate. Suppose further we know when the segments occur. Is the coefficient for acceleration statistically significant? Try it yourself. And/or you can read this post.
and the professional jealousy of econned towards prof. chinn emerges ONCE AGAIN. perhaps if econned had greater success professionally or personally, he would not project his jealousy in such an immature way. but he does. which is why he could never achieve success professionally or academically.
“Because I’m certain Furman respects you as a colleague (and because Furman is generally a nice guy who isn’t in it for the “gotcha”) he restrained himself. Even still, he borderline mocked your analysis.”
Econned admits he does not know Furman but now this pathetic little troll knows Furman had to restrain himself from mocking Dr. Chinn? Seriously Econned – are you some sort of mind reader?
Econned has consistently shown his only talent in life is being a complete and worthless jerk.
econned seems to be a mind reader, with his unedited understanding of the mind of furman. unsubstantiated commentary by econned. opinion piece. professional jealousy.
This tolerant reply (one of my favorite words in the English language, right underneath “it’s free”) Menzie gave to Econned about how to properly decipher CPI data reminds me of a fortune cookie note I once read, “Respond intelligently even to unintelligent treatment”. I wish I had the personal discipline to make this my life motto. Menzie has the ability to do this~~that’s at least one way (of doubtless many) Menzie is a better man than me.
Menzie Chinn,
Your attempt at obfuscating is slick and you know it. You also know that your “Econbrowser base” of fanboys are none the wiser.
Econned: I don’t understand what is “obfuscating” about my reply. Please explain. The use of HICP seems to address the issue of differential deflator construction.
econned is wrong, AGAIN, and whining about it. what a surprise. more professional jealousy from the snowflake.
Hey troll – find some other blog to pollute.
I suspect econned has never interacted with Furman, either through the internet, phone, in person, or any platform. So Furman never told him he was wrong about topics X, Y, and Z and therefor making Furman more likable. The day Econned saunters up to a bar stool next to Furman, and Furman proceeds to tell Econned how he has everything Macro ass-backwards is the same day Econned tells us Furman is a poser and a jerk.
Econned claims to be a fan of Milton Friedman. I bet Econned never met Dr. Friedman. I have. And he was generally a nice person but if he saw someone saying something questionable, Dr. Friedman would not be shy about saying so.
Now we get Econned probably has never presented a paper on economics in his worthless life. But had he done so in a conference where Milton Friedman was in attendance, the devastating comments from Dr. Friedman would have sent little Econned out of the room crying his little eyes out.
Leo Rosenberg
Thu, Jan 13, 2022, 9:53 AM
to me, bcc: Leo
https://fred.stlouisfed.org/graph/?g=Fn2B
January 15, 2020
Consumer Price Index for Rent and Owners’ Equivalent Rent, 2020-2023
(Percent change)
https://fred.stlouisfed.org/graph/?g=HKys
January 15, 2020
Consumer Price Index for Rent and Owners’ Equivalent Rent, 2020-2023
(Indexed to 2020)
[ That these basic costs are already so high and likely to remain so is worrying to me. These costs for moderate and low income households have to be an increasing problem. ]
Professor Chinn,
Thanks for posting the 2.8% instantaneous CPI All value. I managed to make the correct calculation.
I also spent considerable time to understand some basics of the Nadaryla-Watson nonparametric regression with a Silverman bandwidth. Using a calculated bandwidth of 1.8, I found a N-W value of 2.7% for May using twelve months of data. Not certain whether the N-W method or the instantaneous method is preferred.
An especially important and relevant essay:
https://www.nytimes.com/2023/03/09/magazine/poverty-by-america-matthew-desmond.html
March 9, 2023
Why Poverty Persists in America
A Pulitzer Prize-winning sociologist offers a new explanation for an intractable problem.
By Matthew Desmond
In the past 50 years, scientists have mapped the entire human genome and eradicated smallpox. Here in the United States, infant-mortality rates and deaths from heart disease have fallen by roughly 70 percent, and the average American has gained almost a decade of life. Climate change was recognized as an existential threat. The internet was invented.
On the problem of poverty, though, there has been no real improvement — just a long stasis. As estimated by the federal government’s poverty line, 12.6 percent of the U.S. population was poor in 1970; two decades later, it was 13.5 percent; in 2010, it was 15.1 percent; and in 2019, it was 10.5 percent. To graph the share of Americans living in poverty over the past half-century amounts to drawing a line that resembles gently rolling hills. The line curves slightly up, then slightly down, then back up again over the years, staying steady through Democratic and Republican administrations, rising in recessions and falling in boom years.
What accounts for this lack of progress? It cannot be chalked up to how the poor are counted: Different measures spit out the same embarrassing result. When the government began reporting the Supplemental Poverty Measure in 2011, designed to overcome many of the flaws of the Official Poverty Measure, including not accounting for regional differences in costs of living and government benefits, the United States officially gained three million more poor people. Possible reductions in poverty from counting aid like food stamps and tax benefits were more than offset by recognizing how low-income people were burdened by rising housing and health care costs.
The American poor have access to cheap, mass-produced goods, as every American does. But that doesn’t mean they can access what matters most.
Any fair assessment of poverty must confront the breathtaking march of material progress. But the fact that standards of living have risen across the board doesn’t mean that poverty itself has fallen. Forty years ago, only the rich could afford cellphones. But cellphones have become more affordable over the past few decades, and now most Americans have one, including many poor people. This has led observers like Ron Haskins and Isabel Sawhill, senior fellows at the Brookings Institution, to assert that “access to certain consumer goods,” like TVs, microwave ovens and cellphones, shows that “the poor are not quite so poor after all.”
No, it doesn’t….
Matthew Desmond is a professor of sociology at Princeton University.
Finishing with the theoretical problems that Isabella Weber encountered in suggesting price controls might be used to limit this round of inflation. The suggestion was dismissed in the New York Times, the reason being an inferred criticism of the price adjustment thinking of Milton Friedman. Just as David Card had found in working on the effects of a minimum wage increase, and as Naomi Klein later found with her work on Shock Doctrine, challenging the thinking on Friedman can elicit fierce opposition.
I side with Weber, and think the writing of Matthew Desmond is a further support:
https://www.journals.uchicago.edu/doi/full/10.1086/701697
January, 2019
Do the Poor Pay More for Housing? Exploitation, Profit, and Risk in Rental Markets
By Matthew Desmond and Nathan Wilmers
Abstract
This article examines tenant exploitation and landlord profit margins within residential rental markets. Defining exploitation as being overcharged relative to the market value of a property, the authors find exploitation of tenants to be highest in poor neighborhoods. Landlords in poor neighborhoods also extract higher profits from housing units. Property values and tax burdens are considerably lower in depressed residential areas, but rents are not. Because landlords operating in poor communities face more risks, they hedge their position by raising rents on all tenants, carrying the weight of social structure into price. Since losses are rare, landlords typically realize the surplus risk charge as higher profits. Promoting a relational approach to the analysis of inequality, this study demonstrates how the market strategies of landlords contribute to high rent burdens in low-income neighborhoods.