Down, from WSJ survey (as noted in article):
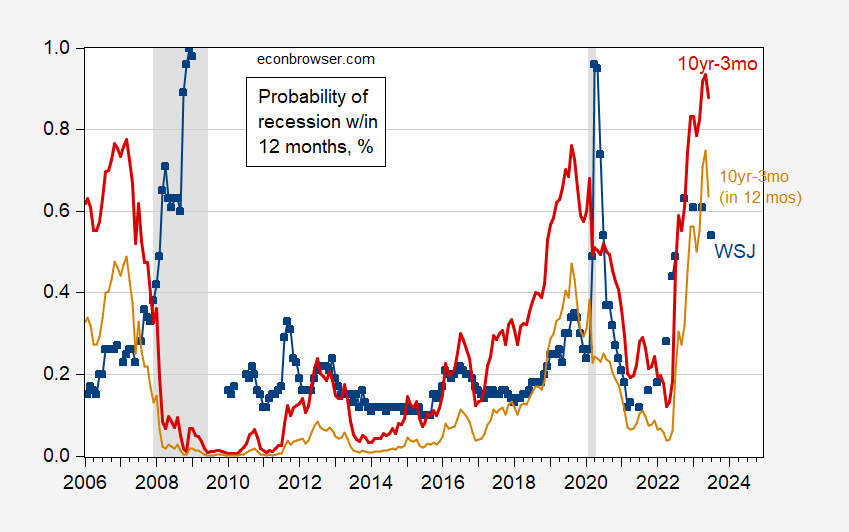
Figure 1: Probabilities of recession within next 12 months, median from WSJ survey (blue square), from probit using 10yr-3mo Treasury spread (red), and for recession in specifically 12 months ahead (tan). NBER defined peak-to-trough recession dates shaded gray. Source: WSJ, NBER, author’s calculations.
54% is still pretty high. Hatzius/GS at 15% is I think an outlier (which doesn’t mean he’s wrong!)
I know it’s not my place to assign homework, but…
I would love to see the recession odds estimate including debt service ratios as a regular feature in charts like Figure 1. You demonstrated the difference including DSR makes in odds estimates in this post:
https://econbrowser.com/archives/2023/06/recession-probabilities-based-on-multiple-financial-measures
The “all factor” estimate from that post had recession odds around 22%, the “term spread + short rate + DSR” estimate at around 10% – much lower than conventional term-spread estimates and lower than the median WSJ estimate. With the rise in interest rates, debt service will rise over time, increasing recession odds at given short rates and term spreads, so the difference in estimates may diminish with time.
Something is going on to reduce the reliability of simple term spread recession forecasts. Might as well keep an eye on alternatives.
Macroduck: Unfortunately, the debt-service-ratio (from BIS) used in our study ends at Q4 2022. We need an alternative (and better yet, monthly instead of quarterly), preferably measured with little error.
Off topic, but let’s face it, the 2024 campaign has begun –
A little something for math lovers – the relationship between campaign spending and election outcomes is linear:
https://www.sciencedirect.com/science/article/abs/pii/S0954349X19302012?via%3Dihub
In 2012 Congressional elections, roughly even spending on a given race resulted in roughly even odds of either party’s candidate winning the seat, and the end-points (one or the other party doing 100% of the campaign spending in a race) are roughly symmetrical. This is apparently true for every election from 2000 through 2020. I interpret this to mean that safe districts are safe and competitive districts are won by spending.
The authors recognize that polls can drive money as well as money driving polls, and use an instrumental variable to account for that. Money drives poll results more than polling drives money.
It’s not a surprise that money wins seats. It is, to me, interesting that the relationship is linear and that dispersion of data around the linear trend is not great. Looks like money’s effect on political outcomes is simple and powerful.
How nice that the Supreme Court ruled as it did in Citizens United, ignoring the Court’s own precedent so that the influence of miney could increase. Ignoring “settled law” is not what is suggested by the dictionary definition of “conservative”, but there you have it.
This does not really seem to jibe with the failure of extremely well-funded Democratic challengers failing miserably in key races this decade (see: Amy McGrath in KY, who outspent McConnell $94 million to $67 million and still lost by 20 ppt in an R+16 state; or Sara Gideon who lost to Collins in ME or Jaime Harrison who lost to Graham in SC despite massively outraising and outspending).
Since 1980 real per capita income has more than doubled. Yet median usual weekly real earnings has risen by less than 14% in those 43 years.
https://fred.stlouisfed.org/graph/?g=175zt
This begs the question: where did all that growth in GDP growth go if it didn’t go to the average worker?
Real time inequality provides the answer:
– Income of the top 1% increased by 261.4%
– Income of the top 10% increased by 153.1%
– Income of the bottom 50% increased by 13.08%
https://realtimeinequality.org/?id=income&incomeend=03012023&incomefreq=monthly&incomegroups=Top%2010%25&incomegroups=Middle%2040%25&incomegroups=Bottom%2050%25&incomegroups=Total&incomestart=01011980&incometype=factor_income&incomeunit=Adults&incomey=perAvg
Clearly, a rising tide lifts all yachts, but many boats get stranded.
To match the growth in per capita GDP, someone’s income would have to be around the 95th percentile or above. While economists like to talk about GDP growth as indicative of how well the economy is doing, it also seems to be pretty indicative of how well those at the very top of the pareto income pyramid are doing.
It’s also interesting that mainstream economists tend to fixate on GDP growth but largely ignore the (lack of) growth in real earnings. Yet data on both are published with the same frequency. What would account for this disparity?
It has been said that the Dow Jones Industrial Average gets reported on the evening news every weekday because media owners like to hear how their stocks are doing. Could it be that mainstream economists play a similar role as broadcasters for those with incomes in the top income percentiles? Though economists’ forecasts are not available in real time, they are released every few days, indicating a market eager for such speculation. And that market is probably not coming from the average worker…
https://fred.stlouisfed.org/graph/?g=lT8Q
January 15, 2018
Real Median Weekly Earnings and Nonfarm Business Productivity, * 1980-2023
* All full time wage and salary workers & output per hour
(Percent change)
https://fred.stlouisfed.org/graph/?g=lT8R
January 15, 2018
Real Median Weekly Earnings and Nonfarm Business Productivity, * 1980-2023
* All full time wage and salary workers & output per hour
(Indexed to 1980)
https://fred.stlouisfed.org/graph/?g=npAT
January 15, 2018
Real Median Weekly Earnings * and Real per capita Gross Domestic Product, 1980-2023
* All full time wage and salary workers
(Percent change)
https://fred.stlouisfed.org/graph/?g=npB2
January 15, 2018
Real Median Weekly Earnings * and Real per capita Gross Domestic Product, 1980-2023
* All full time wage and salary workers
(Indexed to 1980)
“It’s also interesting that mainstream economists tend to fixate on GDP growth but largely ignore the (lack of) growth in real earnings. Yet data on both are published with the same frequency. What would account for this disparity?”
Well, as with so much of what you write, perhaps it’s your ignorance of what economists actually do, and of what economics actually is, that accounts for the disparity you think exists. You have repeatedly been corrected on your claims about what economist do, think, care about, but still you just keep writing the same stupid stuff.
Now, we know you think economics is limited to what ends up in the press and on TV. You’ve also made clear that you think economists are responsible for what ends up in the press and on TV. You’re wrong on both counts.
If you want to know what economists “fixate” on, you need to find out what they teach and write about. That would require looking into the curricula of university economics departments and into articles published in economics and social science journals. You clearly haven’t done that. You pretend instead that popular culture is the measure of all things. Popular culture may be the limit of your understanding but it isn’t all there is to the world.
You also seem to have missed the fact that the current Treasury Secretary, one-time Fed Chair and economic advisor to the president, Janet Yellen, is a labor economist.
Right on this very blog, the point has been made repeatedly that recession is not defined by GDP, but instead is defined by overall economic performance. The troll choir, of which you are a member in good standing, fixated on GDP. Real economists did not.
By the wat, there are a number of highly regarded journals specializing in labor economics, but no journals, to my knowledge, specializing in GDP.
And in your own little world, you have fixated on a single metric of economic performance – median usual weekly real earnings – while real economists use lots of data to improve our understanding of the world. Very often, those data have nothing to do with GDP. At first, you insisted that there was no official series on median usual weekly real earnings, claiming that economists were hiding something. Having been shown to be wrong on that point, you now insist that nobody else pays attention to the very series that others knew about, but you didn’t. Dr. Freud had a term for you behavior – he called it “projection”.
Johnny, you’re a fake, an imposter. You make stuff up. You know very little and much of what you know is wrong. And I still think you are paid to splatter your idiot rants here, paid to disrupt intelligent discussion. Why else would you be willing to embarrass yourself like this?
Oh, and your final paragraph? Johnny, even you have to realize how idiotic it sounds. It’s like you had some sentences left over and didn’t want to waste them. Do your masters pay you by the word?
We know Jonny’s master is Putin. One would think even Putin would expect something better than the usual trash Jonny spews.
“there are a number of highly regarded journals specializing in labor economics”
Journal of Labor Research is one of them:
https://www.springer.com/journal/12122
I mention this as I got one publication in this journal even though I do not even pretend to be a labor economist.
Now the Journal of Labor Economics is the prestige journal. Let’s ask little Jonny boy if he has ever published there.
If Jonny boy was serious about this issue, he could have simply noted how labor’s share of GDP for the US used to be 65% back in 1970 but has dropped to only 60% now. There have been LOTS of economists discussing the possible reasons for this including Paul Krugman (yea Jonny boy loves to trash Krugman as an uncaring know nothing but Jonny boy is the Know Nothing).
Jonny could have also noted how the US compares to other issues but I guess he is too dumb to do that either. So here you go:
https://w3.unece.org/SDG/en/Indicator?id=30
Interestingly, John Kenneth Galbraith wrote about the importance of countervailing power in the labor market. So that organized labor might balance increasingly powerful employers. Organized labor, however, as reflected in union membership rates has been steadily losing market power these last 40 years, and that loss of union countervailing power seems clearly reflected in loss of labor share of income. Where Amartya Sen has made a point of referring to Galbraith’s work on countervailing power, Paul Krugman has been sharply and, I think, intemperately critical of Galbraith’s work.
http://www.bls.gov/webapps/legacy/cpslutab5.htm
January 15, 2023
United States Union Membership Rates, 1984-2022
1984 ( 18.8)
1990 ( 16.0)
2000 ( 13.4)
2010 ( 11.9)
2020 ( 10.8)
2022 ( 10.1)
Union membership in Canada is about 30%.
http://www.bls.gov/webapps/legacy/cpslutab5.htm
January 15, 2023
United States Union Membership Rates, 2022
United States ( 10.1)
Hawaii ( 21.9)
New York ( 20.7)
Washington ( 18.0)
California ( 16.1)
Rhode Island ( 16.1)
Alaska ( 16.0)
Oregon ( 15.5)
New Jersey ( 14.9)
Connecticut ( 14.2)
Minnesota ( 14.2)
Michigan ( 14.0)
Illinois ( 13.1)
Ohio ( 12.8)
Massachusetts ( 12.7)
Pennsylvania ( 12.7)
Vermont ( 12.1)
Maryland ( 11.6)
Nevada ( 11.3)
Montana ( 11.2)
New Hampshire ( 10.1)
Kansas ( 9.8)
Missouri ( 9.6)
Maine ( 9.2)
West Virginia ( 9.2)
District of Columbia ( 9.1)
New Mexico ( 8.8)
Delaware ( 8.5)
Kentucky ( 7.9)
Indiana ( 7.4)
Alabama ( 7.2)
Wisconsin ( 7.1)
Iowa ( 7.0)
Colorado ( 6.7)
Nebraska ( 6.5)
North Dakota ( 6.4)
Mississippi ( 5.6)
Wyoming ( 5.6)
Arizona ( 5.5)
Oklahoma ( 5.5)
Tennessee ( 5.5)
Arkansas ( 4.8)
Idaho ( 4.7)
Florida ( 4.5)
Georgia ( 4.4)
Louisiana ( 4.2)
Texas ( 4.1)
Utah ( 3.9)
Virginia ( 3.7)
South Dakota ( 3.1)
North Carolina ( 2.8)
South Carolina ( 1.7)
So, Ducky, are you willing to address the main point of my comment–that real GDP growth is a good indicator to the rising incomes of the top 5%? And are you willing to acknowledge the fact that GDP growth over the past 40 years has largely bypassed the average American? Or are you going to ignore these points, thereby adding another data point to my contention that mainstream economists prefer to talk about GDP as an indicator of the “health” of the economy, instead of talking about indicators of broad-based (lack of) prosperity among the general population, which the economy is supposed to serve?
Johnny, I don’t dance to your tune. You and CoRev keep insisting that you set the terms of debate. Neither of you are honest or well-informed enough to be allowed that role.
Your claim that you have collected a data point whenever the rest of us refuse to stroke your ego is ludicrous. It’s also, by the way,right out of the trolls’ handbook. Claim that refusal to allow you to control the terms of debate means you win. It just means you haven’t earned the respect of other parties to the debate.
“real GDP growth is a good indicator to the rising incomes of the top 5%”
Huh – this sentence seems to say that the income of the ultrarich tracks overall income growth. Taken seriously this babble implies that income distribution has not gotten more skewed towards the rich. But everyone with a brain knows the ultrarich has a higher share of income now than they did over 40 years ago.
So Jonny boy’s main point is that Jonny boy’s writing sucks. But you knew that a long time ago.
McQuack, now you’re stalking me too!? “You and CoRev keep insisting that you set the terms of debate. Neither of you are honest or well-informed enough to be allowed that role. ”
I don’t set the terms, but I do point out the lies and errors of others. I don’t point out yours as often as others, because you provide so few details and add little value in your ideologically driven comments.
There have been some egregious errors lately, as in your insistence that averaged annual data shows sub-annual peaks/valleys. Really!? Are you so mathematically ignorant? Apparently so! Ideology über alles!
The ignorant liberal mind is an amazement.
CoRev: For a person who can’t distinguish between raw and “manipulated” data (When both are easily downloadable), and refuses to apologize for accusing the blog host for his/her error despite repeated requests, your assertion that you point out “lies” is incredibly rich.
“I don’t set the terms, but I do point out the lies and errors of others.”
CoRev is so full of it. What CoRev does is to take the insights of others as a prelude to his parade of lies.
Menzie,Yyu were the one who displayed annual averaged data and the peanut gallery still will not admit it? And you call me rich for questioning your past performance? Why have you not apologized for misrepresenting that NOAA temperature chart? Try this chart of the very same data, but with a trend for the past 8 years. https://www.ncei.noaa.gov/access/monitoring/climate-at-a-glance/global/time-series/globe/land_ocean/all/6/1850-2023?trend=true&trend_base=10&begtrendyear=2015&endtrendyear=2023&filter=true&filterType=loess
What NOAA says is: 2015 to 2023 trend ( -0.04C/Decade) Note that ole negative sign. I dunno. Out here in the real world a negative sign does not denote warming.
Do you wonder, as I do, why 2slugs cherry picked the period he did for his ARMA (1:1) test?
CoRev: You idiot, I wasn’t going to call you out on it, but now that you’ve brough it up, if you read the legend from NOAA itself in the graph, you’ll see it says “June”. It’s JUNE of each year that’s plotted. Other readers were able to glean that fact. You apparently were not.
I seldom write this, but you are truly, really, simply, a stupendously moronic idiot. And a pompous one at that.
If you don’t admit to (1) making this mistake, and (2) making an incorrect assertion regarding my alleged manipulation of raw data and/or misreporting, then I’m going to ban you.
I vote for banning, if this is a democracy. and you can ban econned as well, when he chimes in defending covid for stooopidity.
Menzie, I stand corrected, and I apologize. What was happening was my cookies were resetting some of the Parameters since I often use NOAA data. In particular the trend was resetting, and throwing my charts off.
CoRev: I don’t understand. The graph in the post you are citing indicates
JulyJune [correction – mdc 7/18/23]. There’s no room for misunderstanding.“If you don’t admit to (1) making this mistake, and (2) making an incorrect assertion regarding my alleged manipulation of raw data and/or misreporting, then I’m going to ban you.”
“And I heard bells ringing
I think I heard an Angel sigh
She said, there’ll be times……
There will be times……
You’re gonna hear the angels singing
You’re gonna hear the angels sing, they’ll say
Aaaaaawwww, aaaaaaaawwwwww, Aaaaaaawwwww, Aaaaaawwwwaaahh
Wo
Oh yeah, ah, wo”
—-David Lee Roth
The fool stands corrected? Not for long. He’ll return with a bang spewing more foolishness. That’s what fools do.
Menzie,” I don’t understand. The graph in the post you are citing indicates July. There’s no room for misunderstanding.” This is the graph I showed with its arguments: https://www.ncei.noaa.gov/access/monitoring/climate-at-a-glance/global/time-series/globe/land_ocean/all/6/1850-2023?trend=true&trend_base=10&begtrendyear=2015&endtrendyear=2023&filter=true&filterType=loess Note the 6 is JUNE and not July. This is the MONTHLY data for the same data set you cited for just JUNE.
So, I don’t understand your confusion. You may be having the same cookies issue as I have? If you read the arguments you might note that there is a trend request that doesn’t show because it is shown with the same color as the data, which is overlays it. As 2slugs likes to claim, a naive data representation.
CoRev: My mistake, June. I wrote down the wrong month. But it is for one month in each year. The correct month is referenced in the original response on 7/17 10:48AM PT post.
By the way, you have still not apologized for accusing me of posting maniupulated data. You have one more chance.
Menzie, when I go to your link, I get a different graph that you show: https://www.ncei.noaa.gov/access/monitoring/climate-at-a-glance/global/time-series/globe/land_ocean/1/6/1850-2023?filter=true&filterType=loess
I don’t know what you will see, but my graph till shows a trend line in the right hand corner, even when no trend is requested, But the biggest difference is C/F the RANGE scale. Your chart shows a range from -.60C to +1.20C. While my chart ranges from -.50C to +4.50C Both show 1850 thru ~1940 the C scale is below zero, and June 2023 is +1.05C.
We may be looking at charting/calculation bugs in the NOAA data representation S/W. We may also be looking at incomplete data, since a large part of the world-wide data collection is still manual and snail mailed. June data is probably still being collected
Maybe it is best to look at NOAA data graphing with a jaundiced eye.
CoRev: Graphs get updated. The static graph is what I was referencing in the post. Source: indicates the website I download the graph from — but I also included an access date because graphs change.
I’m hardly alone in concluding that mainstream economists avoid distributional issues. In fact, it’s not hard to find prominent observers who take mainstream economists’ avoidance/disinterest in inequality as a foregone conclusion.
Binyamin Appelbaum: “economists, who exert a profound influence on public policymaking, have an important role to play in analyzing the inequities of distribution, exploring the consequences, and shaping remedies. The past half century has provided a mountain of data…
Just as economists learned to incorporate the growth of knowledge into their understanding of the world, just as they have—for the most part—accepted the need to wrestle with the imperfections of financial markets, so too they now are grappling in earnest with the complexities of distributional questions.
Yet as a careful observer of the discipline of economics—albeit as an outsider looking in through the windows—engagement with these questions seems to me still constrained by a number of factors. Many economists have enduring doubts about the importance of distributional issues.” https://www.imf.org/en/Publications/fandd/issues/2020/12/economics-must-make-room-for-other-disciplines-appelbaum
Noah Smith: “Why would economists rather talk about efficiency than inequality? Having lived among them for a while, I don’t think the reason is what many people think…” https://english.aawsat.com/home/article/1301646/noah-smith/why-economists-avoid-discussing-inequality
The Atlantic: “Why So Few American Economists Are Studying Inequality…In recent years, it’s been European scholars who have written the blockbuster papers on the topic…
Michael Zweig, an emeritus professor at SUNY Stony Brook, says that American economists haven’t always shied away from social problems like class and inequality. But during the second half of the 20th century, he says, class was “driven from the discipline,” Zweig says. This is largely because U.S. economists focused on the market, always the market….
“In the American economics profession, the scope of economics as a field has been reduced to a study of the market, as though the market was the same thing as the economy,” he told me.
Eventually, the issue of income inequality became a “backwater” in American economics, the Washington University of St. Louis professor Steven Fazzari told the New York Times.”
https://www.theatlantic.com/business/archive/2016/09/why-so-few-american-economists-are-studying-inequality/499253/
You do have your go to people who also spin utter nonsense. Much like CoRev has his parade of clowns like Dr. Curry. Rehashing stupid spin does not make it honest worthy comment.
Jonny boy notes an article that highlights the work of Thomas Piketty, Emmanuel Saez, and Gabriel Zucman (the latter two who teach at Berkeley), Anthony Atkinson (London School of Economics), Nicholas Bloom (Stanford), Thomas Phillipon (New York University), Branko Milanovic (City University of New York), and Stefanie Stantcheva (Harvard) in an effort to claim economists do not care about income distribution?
Yea – Jonny boy cannot even read his own damn links.
“I’m hardly alone in concluding that mainstream economists avoid distributional issues. ”
this simply points to the fact that you are not well informed. less posting and more reading of the literature would server you well Johnny.
and I will point out, what right do you have to dictate to economic professionals what they should/not spend time and effort on?
You’re hardly alone in …keep dreaming. Seriously, how do you get your head through a door?
“At some point one has to wonder whether a corrupt version of ChatGPT has taken over pgl’s keyboard. His comments after all are nothing more than babbling BS… (just anticipating pgl’s usual astute, scholarly, and enlightened responses by pasting in one of his typical comments!}
Jonny boy thinks he is a funny guy. Only problem is that I have never used ChatGPT. Now Jonny has found a version of ChatGPT that thinks it is making jokes but alas this version is incompetent too. Hey Jonny boy – the kiddies are laughing AT you.
Since pgl says that he is not even using a corrupt version of ChatGPT to generate his insults, he must be suggesting that he is using a totally inferior product.
A real ChatGPT might actually look at the evidence I presented to show that growth of real per capital GDP since 1980 has closely matched the growth in income of the top 5%.
Of course, pgl, like many mainstream economists, is content to ignore income inequality and the distribution of increasing per capita GDP over the past 43 years…but he sures loves to show off the lameness of his automated insult generator!
“A real ChatGPT might actually look at the evidence I presented to show that growth of real per capital GDP since 1980 has closely matched the growth in income of the top 5%.”
this has not been disputed by anybody on this blog. you keep repeating something, in a complaining manner, that is not up for dispute.
“A real ChatGPT might actually look at the evidence”
JohnH admits that even the worst version of ChatGPT is far smarter than Jonny boy!
“are you willing to address the main point of my comment–that real GDP growth is a good indicator to the rising incomes of the top 5%?”
Damn – your main point is rather pointless. Then again – ALL of your stupid comments have no point.
Dude – go pollute some other blog with your serial BS.
https://fred.stlouisfed.org/graph/?g=ns5D
January 30, 2018
Labor Share of Nonfarm Business Income and Real After-Tax Corporate
Profits, 1980-2018
(Indexed to 1980)
Decline in labor share of income:
89.9 – 100 = – 10.1%
Increase in real profits:
401.7 – 100 = 301.7%
https://fred.stlouisfed.org/graph/?g=mQUa
January 30, 2018
Labor Share of Nonfarm Business Income and Real After-Tax Corporate
Profits, 2000-2018
(Indexed to 2000)
Decline in labor share of income:
88.6 – 100 = – 11.4%
Increase in real profits:
232.6 – 100 = 132.6%
And I thought Jonny boy was mixing apples and oranges.
https://fred.stlouisfed.org/graph/?g=nshU
January 30, 2018
Labor Share of Nonfarm Business Income and Real After-Tax Corporate
Profits, 1960-2018
(Indexed to 1960)
Decline in labor share of income:
88.0 – 100 = – 12.0%
Increase in real profits:
659.7 – 100 = 559.7%
I think the 10yr-3mo signal has been “contaminated” by the highly unusual appearance of two short term “price explosion” events that were predictably short lived. If you know that the drivers of higher prices are short term and that the Fed if anything will over-react and induce deflation it makes sense to accept lower rates on the 10-year than on the 2 year bond.
The rationale for demanding higher rates for longer terms is based on the idea that when you lock in money for 10 years you may lose opportunities for getting an even better rate later (on a 10 year or shorter bond). But if I am a bond fund manager or long term investor and I am 95% sure that rates will be lower in 3 months I would want to lock in the current yield on the 10 year bond because if I wait I may be “locked out forever”.
It makes perfect sense that money managers at this time predict decreased interest rates without expecting an economic downturn. This is a rare time when rational people would predict a fall in interest rates without also expecting a recession. I would expect that any recession we get would be shallow and short – and it would not surprise me at all if we don’t get one, in spite of the big signal from a parameter that normally is a reliable predictor of a downturn.
https://www.pnas.org/doi/10.1073/pnas.2216248120
June 27, 2023
Caught in the crossfire: Fears of Chinese–American scientists
By Yu Xie, Xihong Lin, Ju Li and Junming Huang
Thirty-five percent of respondents feel unwelcome in the United States *
Seventy-two percent do not feel safe as an academic researcher
Forty-two percent are fearful of conducting research
Sixty-five percent are worried about collaborations with China
Eighty-six percent perceive that it is harder to recruit top international students now compared to 5 years ago
* https://www.pnas.org/cms/10.1073/pnas.2216248120/asset/9825bacd-8c31-4f01-9978-9f876d722f67/assets/images/large/pnas.2216248120fig02.jpg
https://www.pnas.org/doi/10.1073/pnas.2216248120
June 27, 2023
Caught in the crossfire: Fears of Chinese–American scientists
By Yu Xie, Xihong Lin, Ju Li and Junming Huang
Abstract
The US global leadership in science and technology has greatly benefitted from immigrants from other countries, most notably from China in the recent decades. However, feeling the pressure of potential federal investigations since the 2018 launch of the China Initiative, scientists of Chinese descent in the United States now face higher incentives to leave the United States and lower incentives to apply for federal grants. Analyzing data pertaining to institutional affiliations of more than 200 million scientific papers, we find a steady increase in the return migration of scientists of Chinese descent from the United States to China. We also conducted a survey of scientists of Chinese descent employed by US universities in tenured or tenure-track positions (n = 1,304), with results revealing general feelings of fear and anxiety that lead them to consider leaving the United States and/or stop applying for federal grants. If the situation is not corrected, American science will likely suffer the loss of scientific talent to China and other countries.
Remember the Rubio Trump debate over small “hands”. It seem the Musk v .Zuckerberg feud is even more pathetic:
https://www.businessinsider.com/someone-please-stop-the-musk-vs-zuck-dick-measuring-contest-2023-7
The burning issue for young people who are dumb enough to be impressed by Matt Gaetz is whether Margot Robbie is a 7 or a 10 on the hotness scale?
https://www.msn.com/en-us/news/politics/matt-gaetz-tries-appealing-to-youngsters-at-tp-usa-conference-margo-robbie-is-not-mid/ar-AA1dUuJP?ocid=msedgdhp&pc=U531&cvid=ff99fee832a24fba8b4e4d44ee3fc180&ei=15peo
Oh well Gaetz gets rich people to buy him underage prostitutes so what the heck. MAGA.