State level GDP figures for Wisconsin was released last week. Here’s a picture of that series, compared to the Evers Administration’s forecast, and a naive forecast based on US GDP and lagged WI GDP.
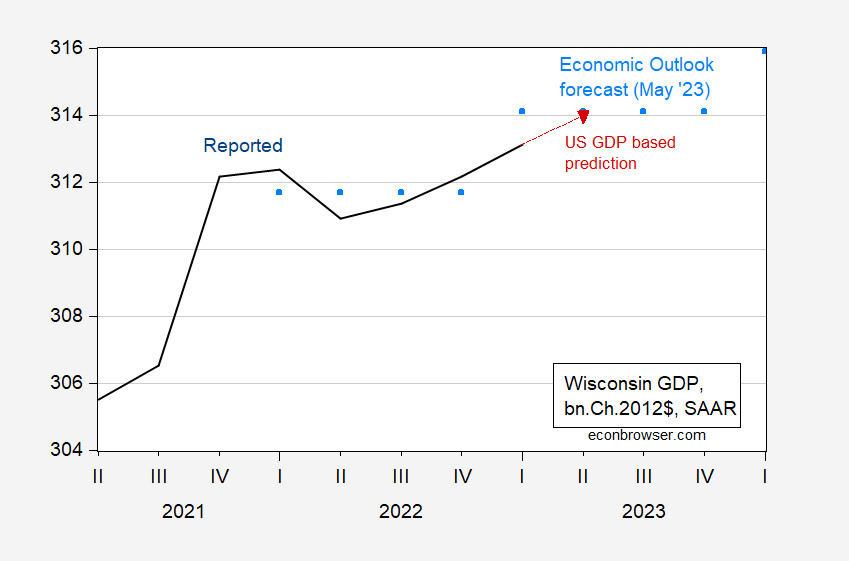
Figure 1: Wisconsin GDP from June 30 release (blue), forecast from May Economic Outlook forecast (sky blue squares), and forecast based on first difference of contemporaneous US GDP, lagged WI GDP (see discussion), and 6/30 GDPNow nowcast. Source: BEA, and Wisconsin Economic Outlook (May), and author’s calculations.
As noted in this post, the Administration’s forecast is based on SPGMI (nee IHS Markit) forecast for the US which includes a period of slightly negative growth.
The red dashed line denotes a forecast/nowcast for WI GDP which uses the following relationship which holds 2021Q2-2023Q1 (quarterly data).
ΔyWIt = -0.004 +1.01ΔyUSt + 0.37ΔyWIt-1 + ut
Adj-R2 = 0.84, NObs = 8, SER = 0.0028, DW = 2.06. Bold Face denotes significance at 5% msl using HAC robust standard errors.
While actual GDP is rising, it lags the nation in terms of growth since 2022Q4, as well as the (BEA) Great Lakes region. It also lags the growth rate of Minnesota (with Democratic Governor and legislatures).
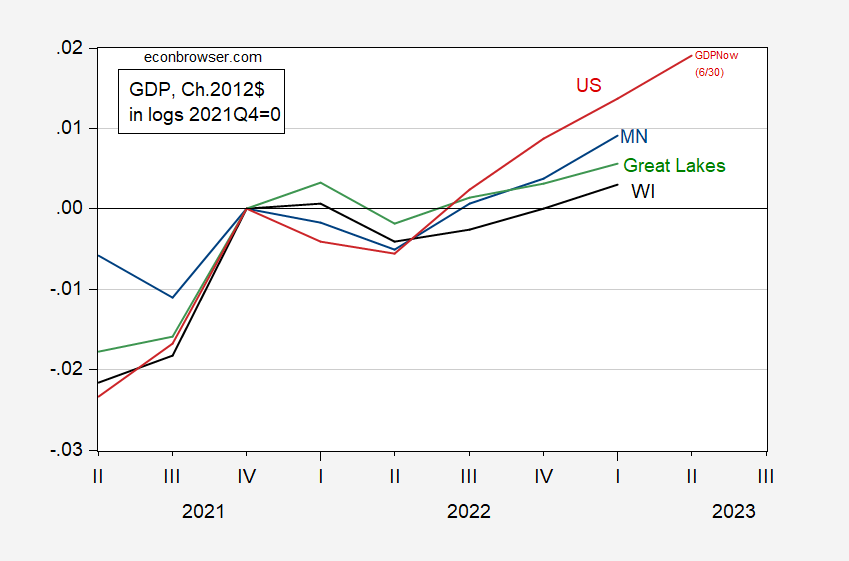
Figure 2: Wisconsin GDP (black), Minnesota GDP (blue), Great Lakes region GDP (green), US GDP (red). 2023Q2 observation for US GDP is Atlanta Fed GDPNow (6/30). Source: BEA, Atlanta Fed, and author’s calculations.
Oh no – the weather has caused the people sponsoring the 4th of July Nathan’s hot dog eating contest at Coney Island to be cancelled:
https://www.msn.com/en-us/news/other/nathan-s-2023-hot-dog-eating-contest-canceled-due-to-lightning/ar-AA1dq6Ro
Update – it was only a rain delay. Joey Chesnut won again downing 62 dogs.
Check out why Vietnam has banned the new Barbie movie:
https://www.msn.com/en-us/news/other/what-barbie-movie-s-south-china-sea-map-actually-shows/ar-AA1dq3h0
The Barbie movie is facing a release ban in Vietnam after a scene in the film showing a map of the world allegedly conflicts with the Southeast Asia country’s territory claims. A screenshot of the Barbie movie, starring Margot Robbie, has gone viral as she is pictured in front of a map which depicts territory that both China and Vietnam claim as their own. State media in Vietnam reported that Vi Kien Thanh, the head of the Vietnam Cinema Department, confirmed on Monday that Barbie was banned due to “the illegal image of the ‘cow’s tongue line’ in the film.” The “cow’s tongue line” is a Vietnamese phrase for the Nine-Dash-Line, which is the markings set out by China and Taiwan in the South China Sea. Under China’s version, they claim ownership over a significant portion of the territory, which has been disputed by Vietnam, the Philippines, the United States and Indonesia. The shot which is doing the rounds on the internet supposedly displays why Vietnam is banning Greta Gerwig’s Barbie movie.
Most likely, the studio knuckles under to Chinese pressure to represent the “cow’s tongue” area as belonging to China. Next thing you know, all maps in movies will show “China’s Sea” where the “South China Sea” is now.
The LATimes is all over this:
https://www.latimes.com/entertainment-arts/movies/story/2023-07-03/barbie-movie-banned-vietnam-china-nine-dash-line
The second map, which Vietnamese entertainment writer Nguyên Lê pointed out on Twitter, depicts the world as we know it. The map appears as Barbie, played by Margot Robbie, is having an existential crisis. Her showers have gone cold, she’s fallen off her roof and her high-heeled feet have gone flat. During a disco party, she abruptly asks aloud, “Do you guys ever think about dying?” The record stops spinning, and fellow Barbies and Kens stop dancing and stare with mouths agape.
For answers, Margot turns to another Barbie, played by Kate McKinnon, who appears to live in a less-pink gated mansion, secluded from the the others. Inside the house, audiences see the map of our world, as Margot’s Barbie asks, “What do I have to do?” “You have to go to the Real World,” McKinnon’s Barbie responds. The map of “the real world” looks as if it’s been drawn in crayon by a child. Accompanying the wacky shapes are labels for each continent — Africa, “Australia, and the one that counts most in the story you’re reading right now, Asia. Alongside the coast of what should be China, a trail of dashes jut out into the map’s ocean.
Drawn by a child or Trump with his sharpie?
Speaking of China, here’s a new version of a story which has been around longer than most of us:
https://thehill.com/opinion/international/4075341-china-is-in-default-on-a-trillion-dollars-in-debt-to-us-bondholders-will-the-us-force-repayment/
China’s government has been in violation of international financial norms since the revolution. It owes $1 trillion or so to U.S. bond holders.
Light staffing other 4th of July probably accounts for publication today. Gotta feed the beast.
JohnH is at it again. Most recent comment was basically solar is cheaper than fossil fuels. Source? None. Any understanding of how to measure these things? None. After all, it was your standard JohnH comment. Here is one of many informative discussions:
https://www.statista.com/statistics/493797/estimated-levelized-cost-of-energy-generation-in-the-us-by-technology/
Rooftop solar photovoltaic installations on residential buildings have the highest unsubsidized levelized costs of energy generation in the United States. If not for federal and state subsidies, rooftop solar PV would come with a price tag between 147 and 221 U.S. dollars per megawatt hour.
But this is the rooftop version. More:
LCOE for solar PV
Levelized cost of electricity or energy generation (LCOE) is a measure used to compare cost efficiency of different electricity generating technologies. It describes the average expense of building and maintaining a power plant divided by its total power output over the facility’s lifetime. The global levelized cost of electricity for utility scale solar PV ranges between 30 and 180 U.S. dollars per megawatt hour. The economic viability of solar PV installations is dependent on a variety of factors largely centering around topography and the predominant weather pattern at the installation site. In regions with high sunshine duration, installing solar PV would come with lower LCOE’s as electricity production may be higher. As countries may stretch across highly variable topography and even across climate zones, solar PV LCOE may also vary greatly within a country. The U.S. has some of the lowest LCOE’s for utility-scale solar PV, at 28 to 108 U.S. dollars per megawatt hour.
Oh gee – the cost varies a lot depending. Me thinks we are already over Jonny boy’s little head. Which is why this stupid troll did not tell us what LCOE is for coal or natural gas. And even if this worthless Know Nothing did – CoRev would lecture us why LCOE is all wrong.
Look I get we are learning by doing and the cost of providing renewables has been coming down over time. I just wish our trolls would do a little research before spewing their usual ignorant rants.
Ole Bark, bark again uses the flawed and incomplete LCOE model to compare electricity sources. I would show, even again, the peer reviewed paper comparing the Full Cost Of Electricity (FCOE) vs LCOE, but it would go over his poor ignorant head. Just like this did: “Rooftop solar photovoltaic installations on residential buildings have the highest unsubsidized levelized costs of energy generation in the United States. If not for federal and state subsidies,…”
Yes, subsidies is just one of the DIRECT costs not included in the LCOE, and yet Ole Bark, bark failed to actually refute that point with his quote.
Using the LCOE is just lying about RENEWABLES’ total indirect and even DIRECT (subsidies, back ups, grid expansions, environmental impact. etc) costs, which is too common when renewables zealots “compare cost efficiency of different electricity generating technologies.”
If renewables electricity was so much less expensive to thermal generated electricity than the market forces would demand implementation, and NOT governments. But on an economics blog we still this underlying need to deny facts (FCOE vs LCOE) and by doing so lie about comparative costs and their ensuing price differentials.
BTW, Ole Bark, bark finally admits that locale and weather can limit SV outputs., while ignoring its major flaw, the Sun WON”T SHINE AT NIGHT.
Sigh!@ The lying liberal mind is an amazement.
Easily found: https://www.eia.gov/outlooks/aeo/pdf/electricity_generation.pdf . The TL;DR is that natural gas is around $40 on average, PV around $30-$35, and Onshore Wind around $30 – $40, for most recent deployable technologies. Note that this is for places where people actually plan on putting stuff in – no including PV in Alaska, for example.