Some pictures, for those who believe in the constant or trend velocity Quantity Theory for the US.
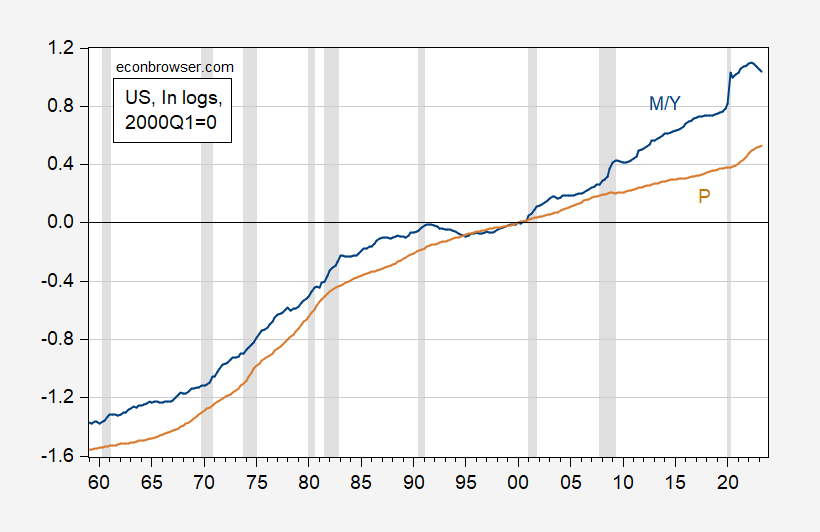
Figure 1: Log M2 divided by real GDP (blue), log GDP deflator (tan), both 2000Q1=0. NBER defined peak-to-trough recession dates shaded gray. Source: BEA, Federal Reserve Board via FRED, NBER, and author’s calculations.
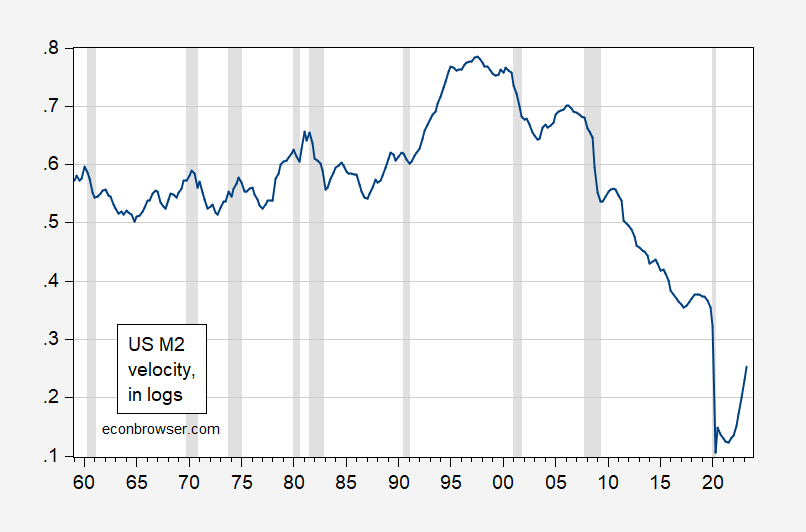
Figure 2: Nominal GDP divided M2 (blue), in logs. NBER defined peak-to-trough recession dates shaded gray. Source: BEA, Federal Reserve Board via FRED, NBER, and author’s calculations.
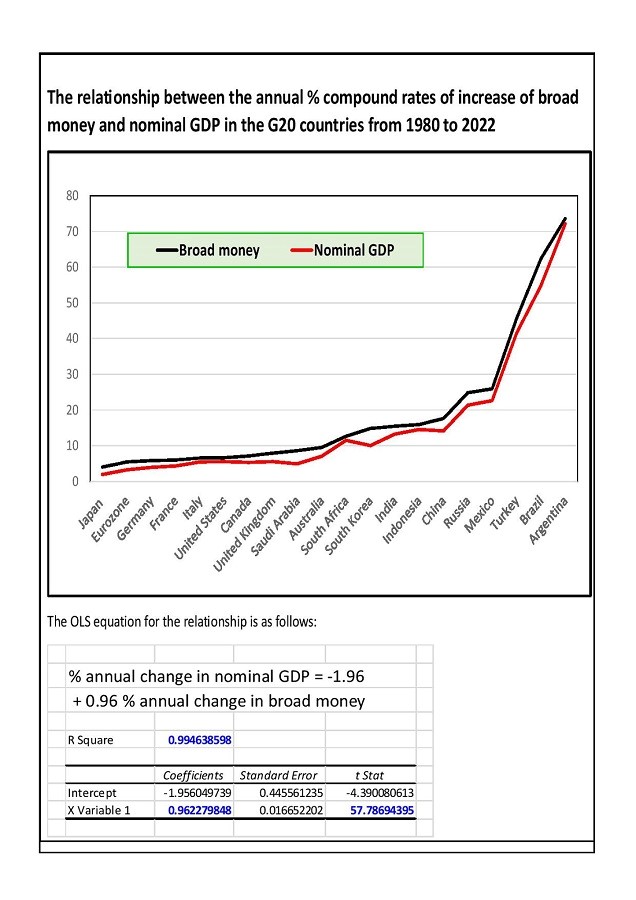
These graphs highlight the fact that a cross-country graph of money and price growth over the past 40 years, including high inflation countries such as Turkey, Brazil and Argentina, will miss large deviations within countries, particulary those with (relatively) small monetary shocks.
Source: Tim Congdon, Institute of International Monetary Research, August 21, 2023.


Menzie Chinn,
M2? This is a pitifully disingenuous post – those who see value in QTM use a divisia index as the monetary aggregate. And you know this.
Econned: Actually, I don’t know this. See this post.
Menzie Chinn,
You should do some reading on topics before you post.
As in that Bordo 2023 piece that you could not be bothered to provide the title or the link? Dude – you are beyond lazy so I provided the link. Yea I read this Hoover “quality” research. Bordo has made a career trying to justify this junk science.
You should listen to Tim Congdon’s latest. He used M2. Dr. Chinn was criticizing Congdon. Your abusive attack on Dr. Chinn should have been levied at Congdon instead.
Dude – did you not bother to listen to what Dr. Chinn was addressing? Or are you just a lying piece of trash?
“those who see value in QTM” are very dumb people. Your rant provided NOTHING to support what you are peddling. But see Dr. Chinn’s post that does.
Come on Econned – try once for your pathetic little life doing the real work. When you leave it to us to do the actual analysis, things do not work out well for your stupid little rants.
Stalker.
I just endured the latest from Tim Congdon which motivated the latest from Dr. Chinn. It was tortuous so I do not recommend anyone else wastes their time with this little clip. And I highly doubt Econned bothered to check out what Tim Congdon did – or maybe he did but is too stupid to know what was going on. But let me summarize what Tim Congdon did.
He took the overall change in M2 over the 1980 to 2022 period v. the overall change in nominal GDP for the same period. OK if one ignores the variability over time then a cross national comparison over a 43 year period may look special. But come on – what else would one expect?
Now Econned thinks he has the right to abuse Dr. Chinn for using the SAME measure of money Tim Congdon used. But had Dr. Chinn used a different measure of money then critics would slam him for comparing apples to oranges.
Simply put – Econned is the one being dishonest here. But what else is new. This is standard faire for the troll Econned.
Did Tim Congdon, Institute of International Monetary Research teach Princeton Steve monetary economics. I’m just waiting for the next claim that Velocity is mean reverting!