One argument for maintaining tight monetary policy is inflationary pressures — but the question is whether it’s from a positive output gap or cost-push shocks (or expectations). One big question is what is the size of the output gap.
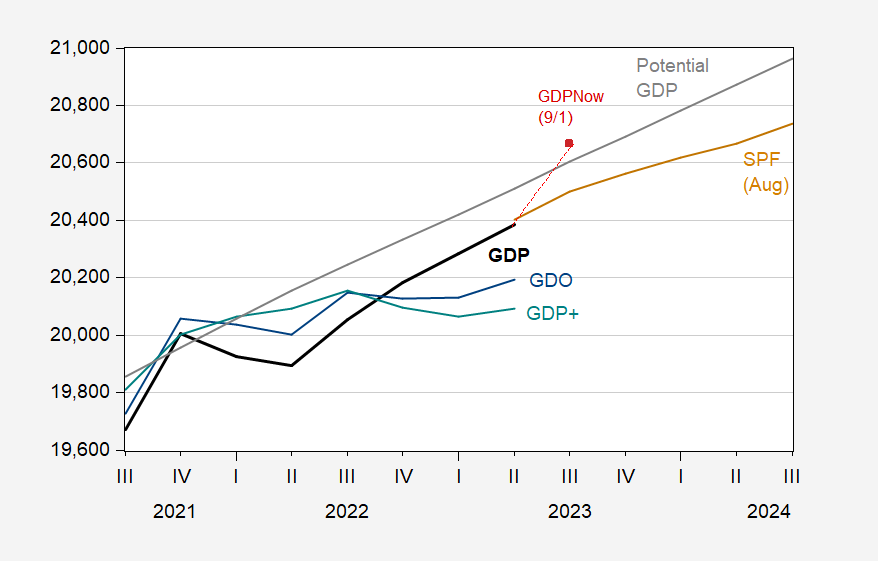
Figure 1: GDP (bold black), SPF median August forecast (tan), GDO (blue), GDP+ (teal), GDPNow of 9/1 (red square), and potential GDP (gray), all in bn.Ch.2012$ SAAR. Source: BEA 2023Q2 2nd release, Philadelphia Fed (GDP+), Philadelphia Fed (SPF), Atlanta Fed, CBO, and author’s calculations.
Note that the output gap as of Q2 was -0.6%, using GDP as reported. Using GDPNow as of 9/1 (a blistering 5.6% q/q SAAR) will set the output gap at essentially zero in Q3. On the other hand, GDO — which is likely to be more reliable than final revised GDP — is at -1.6% in 2023Q2 (GDP+ is at -2.1%).
If the output gap is currently negative, then the case for continued tightening is weak. This is even more so, even taking reported GDP as accurate, if the SPF median is correct and the output gap will be increasingly negative over time.
These calculations rely upon estimates of potential GDP. On this point, there is some disagreement. For instance, as of 2022, CBO’s output gap is 1.2 percentage points of potential GDP less than OECD’s (June 2023 Economic Outlook). The estimate for 2023 is 1.1 ppts lower. Relying upon the OECD estimate implies a better case for tight monetary policy.
For comparison’s sake, 2023Q2 CBO gap is -0.6 ppts, HP deviation is 0.3 ppts, and Hamilton filter is 0.6 ppts.
I recently wrote in response to Jake:
“I agree with you. But un an effort to be fair to Fed folk, I offer three plausible explanations for maintaining restrictive monetary policy for an extended period:
1) With employment still growing at well above the long-term sustainable pace, wages could put upward pressure on inflation…”
Uh, Oh. One of my plausible explanations bit the dust. Can’t say I’m surprised.
Menzie Chinn,
You mention “GDP” through this post but the data seems to show Real GDP.
1) Why not be clear that you’re displaying real GDP?
2) Why aren’t you displaying nominal GDP when the discussion is on the stance of monetary policy?
Econned: The legend to the graph states “all in bn.Ch.2012$ SAAR”. Most sentient beings understand that to mean “real”.
Are you exactly sure “sentient beings” includes Econned???
I’m beginning to believe that Econned is dumber than even CoRev, Bruce Hall, and JohnH. After all one has to be totally clueless to write “Why aren’t you displaying nominal GDP … “. Maybe for the benefit of this arrogant but clueless wonder, the IMF’s Back to Basics is a must read:
https://www.imf.org/en/Publications/fandd/issues/Series/Back-to-Basics/gross-domestic-product-GDP
Reminds me of the time that I cited two different, reputable sources aboout the output gap. In response, pgl had his usual meltdown, saying that they were all wrong…how could they be so wrong…obviously a bunch of liars! A few minutes later, apparently after having done some calculations on a napkin, he told me what the guaranteed, official output gap really was! For which I was eternally grateful, naturally…
Bottom line: the output gap depends on the measure of economic growth you want to use…with the possible exception of GDI. It would appear that some prefer the one that minimizes the gap, thereby making the case for lower interest rates and faster growth of asset prices…
JohnH: I don’t recall pgl writing what you ascribe to him. Could you provide link to that comment?h
JohnH
September 3, 2023 at 10:07 am
Jonny boy just made this BS up. Why? Well he is my mentally retarded stalker so hey!
It was over at EconomistsView.
‘JohnH
September 3, 2023 at 3:49 pm
It was over at EconomistsView.’
Now we know Jonny boy lied. He never made a comment about the output gap at Mark Thoma’s place. Which is why this troll cannot provide the link (EV is still there BTW).
No – Jonny boy polluted Thoma’s place with his stupidity and lies. He is trying to do the same here.
Menzie Chinn,
“Apologies”…I didn’t read that paragraph of a legend. Most sentient analysts know to accurately label their axes or directly label the series being presented. You tried to do the latter and failed. Maybe pick up a book by Ed Tufte.
Larger point still stands, why RGDP?
This is from the troll you told me he did not have to provide clear labels. Two faced jerk you are.
Professional jealousy makes a person double down when they make stoopid accusations. Econned cannot admit he was wrong, so he dives down the rabbit hole of stoopidity. Again.
Clearly labeled ‘all in bn.Ch.2012$ SAAR’. I guess little Econned never learned to read. You certainly never learned to label your own graphs. Or provide a source properly. As in “Bordo (2023)”.
Yea – you are incompetent. But you chirp needlessly at our host? Pathetic.
Whatever emotional quiver causes the stalker to stalk is going strong right now. The need to be rude is so obviously large, while the substance of the complaint is so trivial – nonexistent, really – as to be laughable.
Who was the guy whose only point was that the world should be decorated in error bars? It’s like that.
“Who was the guy whose only point was that the world should be decorated in error bars?”
RSM I think. An annoying twit. But not as rude as Econned. BTW Econned never held his QTM buddies to even the slightest shred of empirical rigor. Yea he is indeed a two faced jerk.
And the professional jealousy continues. Econned never misses the chance to whine, even if he has to make a stooopid comment to do so.
If you’re a drinker, like me, You can’t help but feel sad at the passing away of Jimmy Buffett. I don’t have a margarita, but I have 1/4 bottle of wine left and some Union labor beer, Humanity won’t forget you Jimmy. this glass is says “Cheers” to anyone who cares for their fellow man. We wouldn’t need to have much drinks if we took a couple minutes to care about each other, would we?? My Dad went to Tahiti when he was a bachelor Jimmy.
Jimmy Buffett’s appearance on Letterman in ’83 was a good one folks. Pulling for Mac Brown tonight.
Aged pirates everywhere mourn.
Cheers to a legend.
“These calculations rely upon estimates of potential GDP. On this point, there is some disagreement. For instance, as of 2022, CBO’s output gap is 1.2 percentage points of potential GDP less than OECD’s (June 2023 Economic Outlook). The estimate for 2023 is 1.1 ppts lower. Relying upon the OECD estimate implies a better case for tight monetary policy.”
How did the CBO measure compare to the OECD measure back during that 2016 flair up over Gerald Friedman’s little paper? As you may recall, some of Friedman’s defenders were claiming an enormous output gap.
I went back to 2015Q4 which was when Gerald Friedman wrote that paper claiming we could have 6% growth per year for the next decade. Yea – it did sort of ignore the problem with having aggregate demand push beyond potential GDP.
Real GDP was 97.6% of CBO’s estimate of potential GDP but there was a dustup over whether CBO was underestimating potential. I would have put the GAP closer to 5% rather than 2.4%. But to suggest as some Friedman defenders did at least implicitly that we had a 20% GAP back then was rather absurd.
This is what motivated my question about what the OECD was saying back then.