GDP surges, at 4.9%, compared to 4.3% Bloomberg consensus, and 5.4% from the Atlanta Fed’s GDPNow (It’s about a point less than the seemingly over-optimistic GDPNow of two month’s ago (8/24)). Jim’s post yesterday discusses the implications for recession calls, as well as for the macrostabilization (inflation reduction to target). Here’s a picture of where the advance estimate placed GDP, relative to nowcasts and forecasts.
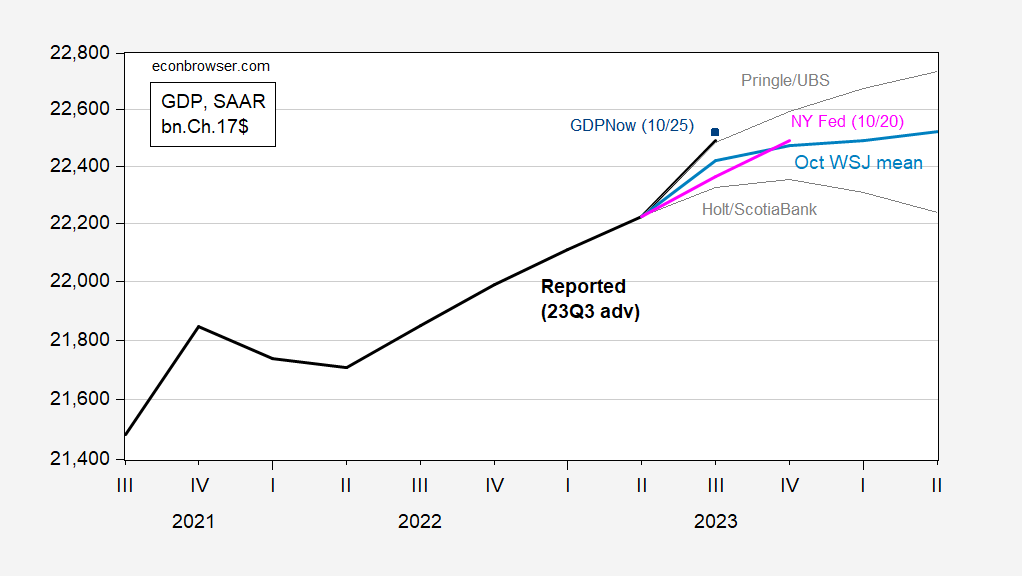
Figure 1: GDP 2023Q3 advance estimated as reported (black), WSJ October survey mean (blue), 20% trimmed range (gray lines), GDPNow (blue square), NY Fed nowcast (pink line), all in bn.Ch.2017$ SAAR. Source: BEA, WSJ, Atlanta Fed, NY Fed, and author’s calculations.
GDP is the expenditure side measure of output. As documented by CEA (2015) and Nalewaik and Braun (BPEA, 2011), GDO — the arithmetic average of GDP and GDI — is a more accurate measure of final GDP, with hGDP reverting more to GDO than otherwise.
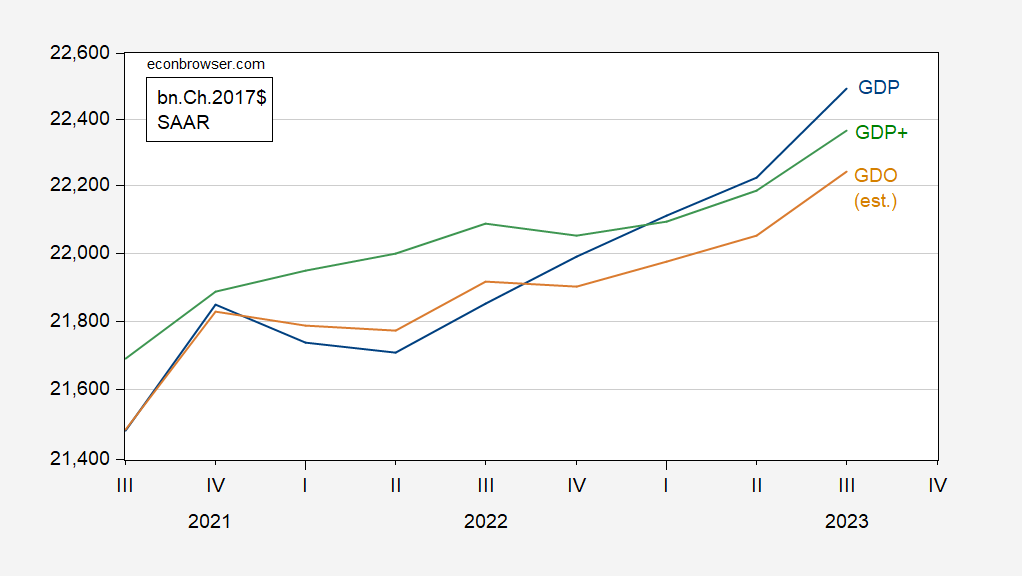
Figure 2: GDP (blue), GDO (tan), and GDP+ (green), all in bn.Ch.2017$ SAAR. GDO assumes enterprise income falls $100 bn (SAAR) in Q3. GDP+ assumes 2019Q4 GDP+ equals GDP. Source: BEA 2023Q3 advance estimate, Philadelphia Fed (accessed 10/26/23), and author’s calculations.
Recalling that in as of July 2001, the initial read for Q2 GDP growth was positive (when NBER placed the business cycle peak at 2001Q1), it’s always important to remember that GDP is subject to substantial revision (which is why the NBER BCDC does put primary reliance on this measure). The mean absolute revision (from advance to final) of 1.2 ppts (SAAR), and standard deviation of revision (from advance to final) of 1 ppt. (The mean revision is 0 ppts, so advance estimates of growth are on average unbiased.) With a reading of 4.9 ppts, and a MAR of 1.2 ppts, a negative reading on Q3 GDP in the final vintage seems unlikely.
The Philadelphia Fed’s GDP+, which incorporates information from revisions, indicates Q3 GDP is 1.5 ppts (SAAR) less than the GDP measure. Nonetheless, given previously higher growth readings than GDP, GDP+ rebased to 2019Q4 GDP+ = GDP indicates output 0.6% less than the official reading.
As an aside, the current vintage of GDP+ indicates no negative quarters of GDP growth in 2022H1, so a recession posited for that period seems contraindicated, even if one wanted to use a GDP-like measure for defining recessions.
My simpleton’s reading of this would be that revisions are most apt to be downward??
Back to fig bars, instant coffee and backyard branch cutting. Last chance before midnight rains hit and make things soggy messy.
Real disposable personal income dropped for the third straight month, countering persistent disinformation from those who insist on portraying how well labor is faring in these extraordinarily tight labor markets. https://www.bea.gov/index.php/news/2023/personal-income-and-outlays-september-2023
Gee Jonny the change over the past 5 months according to own link is zero. Dude – your lies are so transparent that a 2 year old child can rebut them. Now if you are going to lie about everything – try not to be so transparent.
Out of a sea of information, numerate people of good Intension will try to find a balance that makes sense of most or all of the information
The Johnnys of the world, quite to the contrary, look for that one data point which suits their bias.
Here, just for fun, are a random selection of various indicators of income:
https://fred.stlouisfed.org/graph/?g=1aJ8a
All show gains. Here is Johnny’s formerly favorite indicator of the terrible state of worker income, median usual weekly real income, which Johnny has stopped mentioning because it doesn’t tell the “bad, bad, bad” story he insists on telling:
https://fred.stlouisfed.org/series/LES1252881600Q#0
Johnny is a always going to insist that things are “bad, bad, bad” and it’s always the Democrats’ fault. Thetruth doesn’t matter.
Out of a sea of information, numerate people of good Intension will try to find an authoritative, impartial source that chooses reliable data and analyzes it.
The Tricky Duckies of the world, quite to the contrary, go shopping for data sets which suit their bias…that labor is faring well and that it’s inconceivable that so many average Americans should be unhappy because their real wages are stagnating. And it’s totally inconceivable that average Americans should not bow down and be eternally grateful for Democratic leadship that has delivered such bounty (irony)!
Here, just for fun, is a selection of various indicators of real income from FredBlog, which I would call a pretty authoritative, unbiased source:
https://fredblog.stlouisfed.org/2018/02/are-wages-increasing-or-decreasing/
Of the four indicators, two are marginally up by less than 1%, two marginally down since just before the pandemic. None paint a picture of a labor force that is prospering. And the data questions the dictum that a tight labor market leads to rising labor incomes.
Why measure from just before the pandemic? Because 4Q19 or January/February 2020 represent the last measurements before compositional effects started to distort the numbers for some time afterwards.
It seems that people who choose to paint a rosy picture of the labor market also choose to disregard the 4Q19 or January 2020 date and prefer to shop for dates that are more favorable to their bias. A year ago seems to be a preferred data, because real wages briefly bottomed then. Alternatively they use aggregate statistics that purport to show real income growth without noting that these figures in no way show how the average American is faring. Or they use statistics that show an average figure that is inherently biased upwards by extremely high incomes in the data set.
Lector cave!
Dude – he is using numbers you have used. The difference is he tells the truth. You lie. Get over it – everyone here knows you are a liar. Everyone.
You nailed the exact problem with the Fox news and Johnny boys of the world. They have already decided on their narratives and then go look for data that can support it. In economics that is pretty easy given the many different parameters and noice in many of them.
For those who seek insights, the parameters of choice are selected for what they do and don’t show sensitivity to – depending on what type of insight is being pursued. Timelines are not chosen based on which will support a specific narrative but on whether a short term or long term perspective is the best for whatever insights are of interest. When a broader based parameter is changing, then the underlying mechanisms for said change is evaluated as deep as possible.
I am glad that there are more people here that are scientists at heard (and some at profession) than there are narrative peddlers.
When it appears little Jonny boy is lying again, consult FRED:
https://fred.stlouisfed.org/series/DSPIC96
Real Disposable Personal Income
Since Dec. 2022, this has increased by 3%.
Look – everyone here knows Jonny boy is a lying. Everyone here knows Jonny boy is stupid. But does he have to make both so incredibly honest?
A perfect example of a Democratic partisan hack using an aggregate number to “prove” that the average American is faring very well indeed.
A serious analyst would try to determine who got that rise in real disposable personal income–the usual suspects (the top 10%) or the average American.
Telling the truth is being a Democratic partisan hack? Dude – you got caught with your panties arouind your ankles with this latest lie. But at least your MAGA hat is still on!
“using an aggregate number”
I used your number dumbass. I just told the truth about YOUR number – liar.
Jonny boy selects real disposable personal income and a couple of months where it fell a tiny bit so we point out that since the beginning of the year, his own measure rose by 3%. Caught with his panties down around his ankle, little lying Jonny boy writes this:
‘A serious analyst would try to determine who got that rise in real disposable personal income–the usual suspects (the top 10%) or the average American.’
Not only did this lying troll change the topic, he does not do the analysis. Of course BEA does not report this by decile. Census does but not on a monthly basis. So little Jonny boy’s changing the topic demonstrates that this moron does not have a clue how data is reporting. So he just keeps on lying as that is mission in life.
The Atlanta Fed’s first GDPNow estimate for Q4, published today, is for 2.3% real GDP growth (SAAR). Consumption, trade and business investment are all forecast to contribute to growth, while residential investment and inventories are forecast to be a drag. Real final sales to domestic purchasers are put at 2.7%. Growth at 2.3% (or 2.7%) would remain above what the FOMC assumes to be a sustainable pace. Recent Fed jibber-jabber warns that more above-trend growth could trigger rate hikes.
It would be fun to hold the latest GDP data up against the CBO’s estimate of potential GDP, but I have the impression that the CBO is behind in incorporating revisions, or something like that:
https://fred.stlouisfed.org/graph/?g=1aIXo
Anyone know what’s up?
Macroduck: CBO does a semi-annual outlook; one is typically January/February, and another (the update) in July/August. So you’ve got to wait to January/February. Alternatively, you could rescale the potential GDP reported in August into 2017$.
Gracias.
How sick is this? “The White House is losing the messaging war on Ukraine. Now it’s changing the message. The president’s team is privately urging lawmakers to focus on the jobs that can be created by money spent on the war.” https://www.politico.com/news/2023/10/25/biden-ukraine-aid-messaging-00123466
Whenever you see a politician promoting a policy based on job creation, you should stop to smell the rats, i.e. in this case big profits for merchants of death. War is a racket.
But I guess the previous narrative of freedom, democracy and human rights has reached its “sell by” date since the US steadfastly defends its ally Israel, which has killed about as many civilians in 3 weeks as the US’ enemy, the notorious human rights abuser Russia killed in18 months.
https://www.democracynow.org/2023/10/27/headlines/gaza_health_ministry_publishes_names_of_nearly_7_000_palestinians_killed_in_israeli_strikes
https://www.ohchr.org/en/news/2023/09/ukraine-civilian-casualty-update-24-september-2023
And for Biden, it’s damn the torpedoes, as his approval ratings among Democrats drop to record lows: “The bottom line: Many Muslim and Arab Americans who consider themselves loyal Democratic voters have expressed a sense of betrayal over Biden’s support for the Israeli military campaign.” (Think swing state Michigan.)
https://www.axios.com/2023/10/26/biden-approval-rating-democrats-israel-gaza
After Ruy Teixera’s report about the election impact of average Americans’ dissatisfaction with the economy (think swing states Wisconsin and Pennsylvania,} maybe it’s time to reprioritize the whole profits over people and war over peaceful conflict resolution approaches!)
https://www.liberalpatriot.com/p/the-worst-fox-news-fallacy-of-them
Russia has killed ~ 80,000 Ukranians since 24 Feb. 2022, and had killed roughly 14,000 more between April 2014 (their invasion of eastern Ukraine) and the end of 2021. But I guess the narrative that people have the right to defend their country and families from brutal invaders has reached its “sell by” date with you, since you don’t count soldiers as dead people.
Go tell the Ukrainian woman who works at a pub a mile from here after fleeing the country when her house and family were destroyed by a Russian missile last year that the reai issue is that “War is a racket” and “big profits for the ‘merchants of death'” and not saving other families like hers from more horror and destruction. Not sure you would enjoy the response.
Some wars are just; some are not. Lumping them all together does a real disservice to the just ones.
Most people would be shocked that Putin’s war criminals have killed 100 thousand Ukrainians. Not our little Jonny boy – he will not be satisfied until they kill 2 million Ukrainians. He is that kind of dude.
Obviously Q3 GDP was a very nice print.
I’d be a lot happier about it if consumers hadn’t run through over 1/3rd of their entire savings to generate it (source: FRED personal savings).
The savings *rate* went from 5.1% in May to 3.4% in September, a level only seen in 2022 and 2005-07. Raw nominal savings are back to 2014 level.
I’d say this is not sustainable, but I see on Gas Buddy that prices have continued to go down.
It’s kinda scary that growth depends so heavily on consumer spending. This is, however, a problem the Fed means to cure.
Curing excess demand when housing and capital equipment demand are already weak means cutting household spending. Which means either households thread the needle, reducing debt-financed spending while still gaining jobs – not sure that has ever happened – or we have a recession.
Meanwhile, fiscal policy is slightly contractionary under current law. – recognizing that current law won’t be in effect much longer:
https://www.brookings.edu/articles/hutchins-center-fiscal-impact-measure/
I always expected that when boomers began retiring there would be a downtrend in overall savings rates. That will not explain the changes from May to September, but it may influence longer term trends. Housing turmoil seem to be a parameter to explore if this looks like 2022 and 2005-07.