Data released yesterday (CFS, SPGMI), through August.
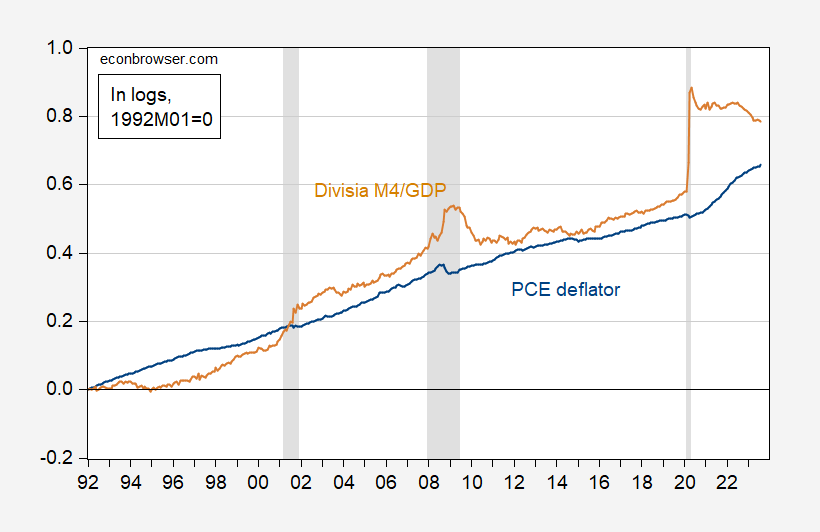
Figure 1: PCE deflator (blue), Divisia M4M divided by real GDP (tan), both in logs 1992M01=0. NBER defined peak-to-trough recession dates shaded gray. Source: BEA via FRED, Center for Financial Stability, SPGMI, NBER, and author’s calculations.
This plot is motivated by the Quantity Theory (here using broadest divisia index as one reader has demanded).
MV ≡ PQ
Where M is money, V is velocity, P is price level, Q is economic activity.
Assume V’ is constant; then:
MV’ = PQ
Take logs (where lowercase letters denote log values).
p = m + v’ – q
During the 1992-2019 period (pre-pandemic), a multivariate cointegration test (constant in cointegrating vector, in VAR, but no deterministic trend in cointegrating vector, 4 lags of first differences) fails to reject the no cointegration null.
Instead of positing a long run trend velocity, one could posit a long run relationship between velocity and the interest rate (this is consistent with a stable long run money demand equation).
p = m + v(i) – q
Where i is an interest rate. Add in the own-interest rate as calculated by Center for Financial Stability, and the same specification also fails.
If one adds 2020-2023M08 data, then cointegration is found at the 5% msl for the trend stationary velocity specification. It’s found at the 10% msl if interest rates are included. Unfortunately for this version of the quantity theory, the interest rate has the wrong signed (insofar as one believes in a money demand equation).
If one were forced to forecast on the basis of the (no-interest rate) quantity theory based model, one would hit a small problem: besides the failure to find cointegration, the ratio of money to GDP seems to do the reversion to error correct — not the PCE deflator.
I estimated the single equation error correction model from 1992 to 2020.08 (which encompasses the big jump in Divisia M4), and forecast dynamically out of sample. This is what I get.
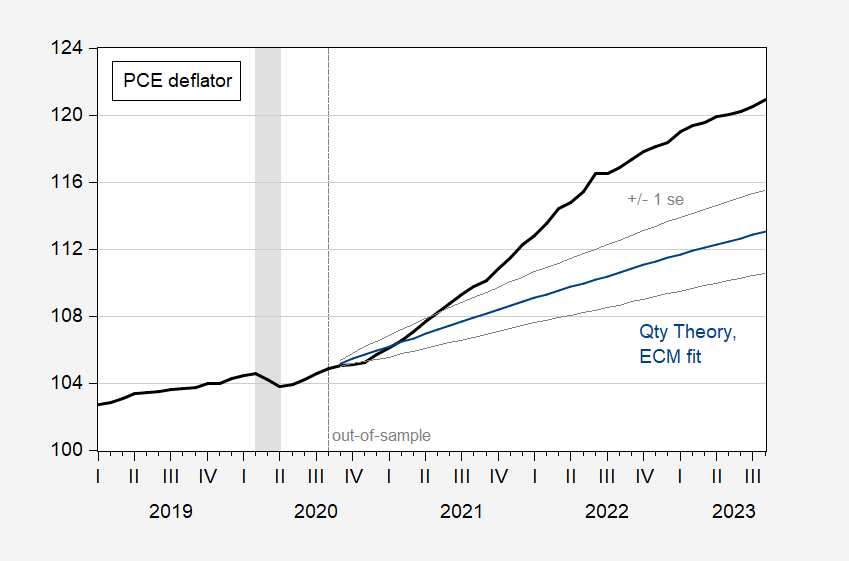
Figure 2: PCE deflator (black), and dynamic out-of-sample forecast (blue), +/- 1 standard error (gray lines). NBER defined peak-to-trough recession dates shaded gray. Source: BEA and author’s calculations.
While one could find other equally plausible parameter estimates, my point here is that the quantity theory taken literally does not necessarily fit the data well.
Addendum, 10/4 10:30am Pacific:
Why Divisia M4? Well reader Econned, in response to my posting of pictures of M2 divided by real GDP, and the GDP deflator, castigates me for the use of conventional monetary aggregates:
M2? This is a pitifully disingenuous post – those who see value in QTM use a divisia index as the monetary aggregate. And you know this.
Apparently, Econned has a defective memory, as he more recently (yesterday, 5:16pm Pacific) has written in response to this post:
You’re lying. Reader Econned never once, on this blog, argued for any monetary index. Your ignorance, or inability to read, or deceitfulness is in full force.
Can’t wait for you to link to me *not* saying what you suggested I said.
Poor performance. Again.
I’m not a psychologist, so I can’t diagnose Econned’s problem. I will let readers do so. He/she does seem to display a fair degree of lack of self-awareness, IMHO.
Addendum, 10/6, 2:30pm Pacific:
Reader Steven Kopits says I should use something taking out bank reserves held at the Fed.
Divisia M4 as calculated by CFS includes T-bills. starting in early-2020, the Fed resumed holdings of T-bills, with a max of $320 billions thru mid-2022. Mid 2022, T-bills outstanding were about $5.5 trillion. I could try to deduct Fed holdings from the amount of T-bills CFS incorporates into Divisia M4, but I don’t think it’d make much of a difference. (In any case, I’m only using Divisia M4 because reader Econned asserted that I should use a broad divisia monetary index if I wanted to test the Quantity Theory of Money).
“the quantity theory taken literally does not necessarily fit the data well”. What sensible economists have been saying for quite a while. But fess up – you posted this just to get Econned riled up.
This brings back some memories. Supply of money is assumed to equal demand for money EXCEPT the demand for money is highly volatile.
The assumption that velocity is constant is also highly questionable.
The irony here is MV=PQ works much better in a highly regulated economy!
Off topic, but heck, most of the comments around here are off topic –
Friday brings jobs data for September. Often, when the labor maket is discussed, we are treated to claims that we are looking at the wrong jobs data, the wrong earnings data, that if we just looked at the right data, we’d know how bad things really are. So, here’s what I hope will serve as a useful inoculation against one of the more persistent, and least honest, claims that everything is bad, bad, bad.
Among income measures regularly discussed here, several show improving incomes in the Covid era. Even after adjusting for inflation, income generally looks to have improved in the Covid era, no matter what measure is used. However, if one picks an extraordinary spike in a particular measure as the point of comparison, it’s possible to demonstrate a fall in that particular measure – “median usual weekly real earnings” by name. Here’s a picture so you can see for yourself:
https://fred.stlouisfed.org/graph/?g=19EWr
I’ve included another measure of median real earnings to show that only by looking at a very carefully chosen measure, seen only in a very carefully chosen way, does the median worker seem to have suffered.
So you have to ignore quite a bit of information to argue that median measures show that the gains are at the top, including some median measures. Well, you know me – I just couldn’t ignore the other measures. And I’m really glad I didn’t because I stumbled across income by quintile after taxes! I don’t need to explain that after tax income is a better representation of purchaching power than before tax income or that quintiles provide a clearer understanding of income distribution than a simple median, do I? Good. Didn’t think so.
Now, we all know that the distribution of income in the U.S. is tilted toward the rich more than is the case in most of the G20, right? I certainly know that, and I don’t like it. But that doesn’t mean workers in the middle have not benefited from real income gains during the Covid era. Not only that, but workers at the bottom of the income scale have also benefited, and for progressives, that’s kind of a big deal.
Agains, income distribution is tilted toward the rich, so much so that pictures I’ve provided aren’t very useful without giving each income quintile its own axis. Feel free to mess with them. (Anyone claiming to have knowledge of economic data can do simple data manipulation, right?) Anyhow, giving quintiles their own axis means comparisons are relative to earlier periods in a series. Here we go:
After tax income, adjusted for inflation, highest and lowest income quintiles:
https://fred.stlouisfed.org/graph/?g=19ERr
Highest and second lowest income quintiles:
https://fred.stlouisfed.org/graph/?g=19ESi
Highest and middle income quntiles:
https://fred.stlouisfed.org/graph/?g=19ETb
Highest and next highest income quintiles:
https://fred.stlouisfed.org/graph/?g=19ETN
Bottom and next to the highest quintiles:
https://fred.stlouisfed.org/graph/?g=19EUt
During the Covid era, the lower four quintiles enjoyed better income gains, relative to that quintile’s pre-Covid starting point, than did the top quintile. And – Ta Da! – the middle quintile also enjoyed better relative gains than the 4th quintile. I’ve drawn this picture by indexing to 2019, which any of you can do with any of these other pictures, if the above rendering don’t make sense to you:
https://fred.stlouisfed.org/graph/?g=19F5b
One thing that isn’t evident in any of the pictures I’ve drawn, including the ever-so-special “median usual weekly real earnings” picture – the roughly 4 million payroll jobs gained since just before the Covid recession and the roughly 26 million payroll jobs gained since the low point of the recession.
So the next time we are lectured that “median usual weekly real earnings” show whatever bad thing it is that they are meant to show, remember:
– Only this carefully chosen series shows whatever bad thing it is meant to show.
– Even “median usual weekly real earnings” only shows something bad if you measure from the top of an extraordinary spike. (A spike which has a pretty obvious explanation of its own, by the way. Anybody care to hear it?)
– More thorough examination of income data shows that lower income quintiles have made real gains during the Covid era, doing relatively better than upper quintiles. (This is also obvious from the Gini coefficient, which I’ve pointed out, but which has been ignore by the “ignore everything but median usual weekly earnings” guy.)
– Whatever bad thing it is that “median usual weekly real earnings” is meant to show, it ignores job gains, which have been quite large.
Menzie a multivariate cointegration test (constant in cointegrating vector, in VAR, but no deterministic trend in cointegrating vector
Just to clarify, are you saying you used an unrestricted constant but an orthogonal deterministic trend restricted to the variables?
2slugbaits: constant in cointegration equation, in VAR, so trend appears in VAR representation.
Okay.
Another sign Uncle Moses is getting old. I can’t even remember which of our village idiots went on about the divisia index. It really doesn’t matter which moron said it, does it??
Moses Herzog: Reader Econned argued for use of Divisia M4.
And he told us that ‘Bordo (2023)’ was an important paper. Of course Econned forgot to tell us who Michael’s coauthor was, the title of the paper, or any link to it. And Econned bitches others do not do such basic things that he never does. Oh well I found the paper and provided a link. And I actually read it and Econned’s spin on this paper shows he never understood it.
Menzie Chinn,
You’re lying. Reader Econned never once, on this blog, argued for any monetary index. Your ignorance, or inability to read, or deceitfulness is in full force.
Can’t wait for you to link to me *not* saying what you suggested I said.
Poor performance. Again.
You are not only a worthless jerk, you are also a spineless liar.
Econned is lying. He’s doing so through trickery, rather than by blunt statement. Econned bitched about Menzie ignoring divisia measures if money, which he claimed most monetarists favor. Econned can’t demonstrate that most monetarists prefer divisia measures. He ducked accountability for the foibles of monetarism by attributing the views he espoused to the fictional “most monetarists”. This sad little man is putting most if his effort into setting traps, avoiding accountability and spilling bile, rather than engaging in honest discussion.
Most therapists would recognize Econned as suffering borderline personality disorder.
He is lying.
August 22, 2023 at 12:50 pm
I posted just today his 1st comment on this matter. OK – his comments were so pathetically stupid, I can see why this little child now denies them.
Stalker having a rough day again. Anyone have some tissues for Stalker?? Once he starts crying he just about soaks his shirt.
Econned
August 22, 2023 at 12:50 pm
Menzie Chinn,
M2? This is a pitifully disingenuous post – those who see value in QTM use a divisia index as the monetary aggregate. And you know this.
“You’re lying. Reader Econned never once, on this blog, argued for any monetary index.”
Dude – your advocacy of this went way over the top. No wonder you try to deny it now. Do us all a favor – stop polluting this blog with your severe emotional problems.
Here is the permalink to the false claim Econned thinks no one would remember:
https://econbrowser.com/archives/2023/08/us-gdp-deflator-broad-money-and-velocity#comment-303613
I guess Econned is assuming we here on the blog have the same length of memory as his closest friends who wear their red dunce caps while watching FOX news.
Econned: Please see addendum to this post. I look forward to your explanation.
Menzie Chinn,
I did not argue for anything. I clearly stated: “those who see value in QTM use a divisia index as the monetary aggregate”.
You’re dishonest and/or have poor reading comprehension. Period.
Econned: Full quote, in response to my using conventional M2:
The logical implication is that I should use a divisia index, if not as your suggestion, then as a defender of the Quantity Theory of Money.
Keep on digging.
You are one pathetic little boy. Own up to your comments or don’t make them. Better still – do the world a favor and never make another one of your stupid blog posts again.
Menzie Chinn,
You can’t be this dense. Why are you unable to comprehend the difference between
“those who see value in QTM use a divisia index as the monetary aggregate”
and
“as someone who sees value in QTM, I suggest you use a divisia index as the monetary aggregate”
???
The logical implication of the former is that among people who defend QTM, they typically do so utilizing a divisia index. Of course you were not defending QTM but because you were attempting to speak authoritatively on a subject, it’s only proper that your attack be in proper context. The proper context is to use the same data as those you choose to attack. My pointing out that you clearly failed an ideological Turing test is in no way a suggestion of my stance on QTM. This is a common problem within this blog’s discourse (and throughout the web). And this isn’t the 1st time I’ve pointed it out.
You can fool some of your readers all the time but you can not fool all of your readers all the time.
Econned: Full quote, in response to my using conventional M2:
Anybody who understands logic understands that you (1) don’t think I should use M2 if I want to test QTM, and (2) I should use a divisia index in order to assess the QTM. Your subsequent citation of articles using divisia indices, and your admonition to read said articles before writing on the QTM, indicates you believed I should use divisia indices.
Keep. On. Digging.
You are the most spineless troll God ever created.
Menzie Chinn,
Again – you failed an ideological Turing test. Me pointing out how you failed is not me arguing in favor of anything other than the logical use of an apples to apples comparison.
Again – if you have an issue with other academics you should man up and confront them. Don’t get upset when I point out that you weren’t honest in your original critique. I realize your infatuation with me, but it makes you (again) look disingenuous in your ‘analysis’. It’s a trend for you.
econned, when you take a grudge mentality against somebody and complain, it makes you look foolish because you then make statements that you are unwilling to stand behind. this has been a case in point. rather than continue with the professional jealousy of prof chinn, I suggest you sit quietly and learn from him. rather than make grudging complaints and sound like a fool.
econned got caught in a lie. but most kids learn quickly enough, if you don’t lie then you don’t have to remember what lies you told. he failed that basic test. then continued to deny and deflect, even when presented with his own quote multiple times. personal and parental failure in the econned household.
McCarthy has been booted from the Speakership.
To be followed by…McCarthy?
@ Macroduck
Lisa Desjardins seemed to intimate she thought it was a strong possibility McCarthy would run his Speakership up the flag pole a few more times—but also said she didn’t know how the hell he could pull it off–it was an extreme longshot on success. But (I am paraphrasing here based on Desjardins’ tone) that there was roughly a 75% chance McCarthy would try.
Late 7pm Politico story says McCarthy has told his closest staff members he will not put his name in the hat for Speaker again. Really a pretty unique and almost singular day in Congress. Lots of info goodies in that Politico link I gave just before.
Anyone know if McHenry is subject to the same processor vacating the speakership as McCarthy?
If he is, he needs his own secret successor-designate. If he isn’t, the House is gonna run a bit slicker now – the right-wing g goons just lost leverage.
@ Macroduck
Some good information here, both the initial McHenry story and going/scrolling farther down:
https://www.politico.com/live-updates/2023/10/03/congress/new-temporary-speaker-mchenry-00119758
Jim Jordan as Speaker? Gag me!
the republican party seems to favor speakers who are involved with sexual assault of minors-either active participants or concealers of the activity. why would the republican party even consider a monster such as jim jordan. for those who do not recall, jordan turned a blind eye to sexual assaults while a wrestling coach years ago. he may not have committed those crimes, like dennis hasert, but he sure as heck permitted them to continue.
Gracias, Senior!
Gingrich
Hastert
Boehner
Ryan
McCarthy
Turns out the most successful Republican Speaker of them all was child molester.
Gingrich and Hastert weren’t victims of the right wing g of their party. They were victims of Democrats. The fact that both were criminals was not central to either man’s fall from power.
Boehner, Ryan and McCarthy are all victims of the radicalization of the Republican Party engineered by Gingrich. It is possible that, we’re it not for Gingrich elevating young loud-mouths to powerful positions within the House, the Republican Caucus in the House might not be the instrument of national decline it has become. Power over policy. Collapse over compromise. Demagoguery over democracy. That’s the Gingrich legacy.
By the way, you noticed Gaetz name-checking Hastert on the way to ousting McCarthy? Pedophiles of a Feather and all that.
Gaetz~~Hastert~~Jordan “Evil Triad Of Pedo”™️©️®️
But Gaetz likes girls. The other two like boys.
Thanks they.
I try not to think of gender at all unless I’m using a public bathroom. And then I use the stall and avoid eye contact at all costs. Should I bring a self-defense zapper if a they person starts leering at me??
Just think, if Jim Jordan succeeds with the Republican conference, Republicans can add protector and defender of child molesters to the list of their Speakers. What a proud moment it will be for them. Then if Gaetz commits statutory r*pe on any minors wandering around the house, Jordan could walk right by the felony action in the hallway and look up at the ceiling tiles whistling the seven dwarf’s “Heigh-Ho”.
Let’s go back 30 years when the GOP was doing “family values”. Their UK counterparts aka the Tories had their “back to basics”. Except for the fact that a lot of the prominent Tories were ending up in bed with either dead women (prostitutes) or live boys. To which Labor quipped “Back to My Place”!
https://oilprice.com/oil-price-charts/#prices
Brent oil price fell below $89 a barrel. And Princeton Steve was so sure this price would soar past $100.
Panics occur from time to time, often twice a year, very commonly it seems in Sept / Oct. It is clear that gasoline consumption has fallen off a cliff, with gasoline supplied (from wholesalers, distributors and refineries) falling to its lowest level since 2000 this week. So that’s a pretty ugly print. Interestingly, though, distillate is holding up and jet fuel has all but recovered its pre-covid level. So it’s a tale of two or three economies this week, but enough to spark a sell-off.
I haven’t changed my view on the aggregate outlook, with the Brent Spread providing more support of the view. Since the shale revolution, a gap has opened up between Brent and WTI (the ‘Brent Spread’) which appears to be driven by the need to continually place incremental barrels of US shale oil. That is, incremental shale oil has to be sold at a discount to find an incremental buyer. The Brent Spread has averaged around $4 / barrel in the last few years, but has collapsed to under $2 in the last couple of weeks, suggesting that there are few incremental barrels of shale oil looking for a home.
All oil price forecasts are subject to subsequent events. These include:
On the demand side:
– a global recession
– the implosion of the Chinese economy
– the pace of return to trend of global oil consumption from the pandemic
On the supply side:
– a decision by OPEC+ to unexpectedly increase or decrease supply
– shale oil production higher than expected, perhaps related to a technological breakthrough
– unexpected outages elsewhere
– return of those 1 billion barrels of excess crude in China and India to global markets
So, yes, there are short term uncertainties, which anyone who has even remotely considered oil markets knows. The overall picture, however, is unchanged from my perspective. We are headed to higher oil prices and an oil shock recession, I would expect before year-end 2025.
Panics? I guess in your world panics can only lower prices. Wait panics often cause prices to rise. But I guess the most incompetent consultant ever never knew that.
As far as your little forecasts, you have never provided us an inkling of your forecasting record. How comes? Because you do not know how to? Or would it show how much of a fraud you really are?
https://www.cmegroup.com/markets/energy/crude-oil/brent-crude-oil.quotes.html#venue=globex
Future prices do not suggest a spike on the price of Brent crude oil. Oh wait – little Stevie is on the record suggesting he knows more than other market participants. Got it!
Thanks for that link. It’s pretty obvious that everybody (minus one) understand that energy markets are moving away from hydrocarbons and towards sustainable energy sources. Prices of electric cars are getting to parity with ICE cars and solar is cheeper than hydrocarbon electricity in most markets. This has predictable effects on oil & NG prices – and it ain’t driving them up.
“Since the shale revolution, a gap has opened up between Brent and WTI (the ‘Brent Spread’) which appears to be driven by the need to continually place incremental barrels of US shale oil. That is, incremental shale oil has to be sold at a discount to find an incremental buyer. The Brent Spread has averaged around $4 / barrel in the last few years, but has collapsed to under $2 in the last couple of weeks”
https://ycharts.com/indicators/brent_wti_spread
Brent WTI Spread (I:BWTIS)
2.40 USD/bbl for Oct 02 2023
Gee Stevie – $2.40 is not less than $2. How incompetent are you?
But OK – this spread may on occasion reach $4. How does that compare to the Brent Ural spread? Oh wait – it is still near $16. And some incompetent consultant keeps tell us that the sanctions have had no effect. DUH!
Spread is $1.67 per Bloomberg at 3:01 pm Friday.
“in the last couple of weeks”
That is what you wrote. Now if you meant last couple of days – OK! Yea I get your English sucks.
“return of those 1 billion barrels of excess crude in China and India to global markets”
Excess crude? I thought this was excess inventories. Dude – just making up BS terms like this one or “suppression” is dumber than a rock. First of all – I bet the buyers have already consumed this oil. But I guess the dumbest consultant ever might ask for it to be returned.
I don’t know WTF is wrong with you. Is your English this pathetic? Or maybe you have no effing clue what you are babbling about. Sort of like your dumb question about included bank reserves in the money supply.
There are different types of excess inventories, crude, gasoline, distillate, kerosene and several others. I was referring to excess crude inventories, but I imagine you are not able to conceive that I was talking about inventories. Perhaps you thought it was 1 bn bbls of excess production, which would be pretty amusing in a world consuming 100 mbpd.
Different kind of EXCESS inventories? I guess there are also different kinds of SUPPRESSION. Dude – learn the English language before you just make up stupid terms.
I understand you do not understand the concept of inventory over normal levels, that is, excess inventories. Most businesses do use this concept, and ‘excess’ is typically defined in turnover days. If a business has 60 days of inventory, and ordinarily only needs 30 days of inventory, then that excess inventory will ordinarily be liquidated, either by slowing restocking or selling the inventory on favorable terms, for example a sale or other liquidation, generally accompanied by price cuts or other incentives.
I imagine you have never shopped in a store offering sale items, but most people have, and the reason for the sale is often, and perhaps primarily, to move excess inventory.
“It is clear that gasoline consumption has fallen off a cliff, with gasoline supplied (from wholesalers, distributors and refineries) falling to its lowest level since 2000 this week. ”
given that distillates and jet fuel are fine, you are probably reading gas consumption wrong. demand is being impacted by a growing electric vehicle fleet and improved gas mileage. and people simply commute less. but are still working. Steven, you never appreciated the impact of EV on our economy.
If it were demand-side impact, we would expect to see low oil prices due to a lack of demand. Oil prices, even after the sell off, are high. That suggests a supply-side, not demand side, dynamic. JPM is forecasting a shortfall of 7 mbpd by 2030. By definition, that means there won’t be enough oil to go around, not by a long shot.
Gas prices seem to be falling. I just filled a tank for under $3 gallon.
This is stupid gibberish even for you. Then again – you are the world’s worst consultant so hey.
Distillate demand is driven by manufacturing and logistics, in significant part. See Menzie’s subsequent post; also, Kemp, linked.
https://mail.google.com/mail/u/2/#inbox/FMfcgzGtxTBWgJSNTNJcxzjkfQsvsnWW
OK, remember that jump in job openings reported yesterday for professional and business service workers in August? Well ADP reported a 32,000 decline in professional and business service employment in September. So we’ve got some glitchy data from this sector. Keep in mind that the rise in openings followed a series of declines, and that hiring in the sector has slowed in recent months:
https://fred.stlouisfed.org/graph/?g=19H6b
Trade and transport and manufacturing also reported job losses in September. Maybe auto strike related?
Large firms shed jobs, while small and medium-size firms added. The South once again shed jobs. Something fishy about ADP’s regular report of job losses in the South.
The ADP website carries this quote from their chief economist:
“We are seeing a steepening decline in jobs this month. Additionally, we are seeing a steady decline in wages in the past 12 months.”
Based in the data ADP reports, both statements are untrue. This looks like one of those rookie errors – a slower pace of gain, described as a decline.
About the next House Speaker –
Any chance that Gaetz is pulling a Trump in engineering the ouster of McCarthy? The House is investigating Gaetz for, among other things, sex crimes. Jim Jordan, who seems likely to win the Speakership, is associated with a sex scandal at Ohio State. Might Jordan be open to a quid pro quo – no threat to remove Jordan in return for an end to investigations into Gaetz?
Not that the next speaker needs to have turned a blind eye to past sex crimes in order to make a deal with Gaetz. And how is it that the other seven Republicans who voted to oust McCarthy could not find among them someone else to lead their merry band of troublemakers? Is an accused pedophile and sex trafficker the best they have?
Well they support Trump who admits to aggressive groping and has been ruled in a civil trial to be a rapist (well sexual aggression with that little thing could not quite go all the way).
McHenry ordered Pelosi to leave her Capitol hideaway office by Wednesday
The former speaker blasted the move as a “sharp departure from tradition.”
By NICHOLAS WU and DANIELLA DIAZ
https://www.politico.com/live-updates/2023/10/03/congress/mchenry-pelosi-hideaway-office-house-remove-00119803
As one of his first acts as the acting speaker, Rep. Patrick McHenry ordered former Speaker Nancy Pelosi to vacate her Capitol hideaway office by Wednesday, according to an email sent to her office viewed by POLITICO. “Please vacate the space tomorrow, the room will be re-keyed,” wrote a top aide on the Republican-controlled House Administration Committee. The room was being reassigned by the acting speaker “for speaker office use,” the email said.
Yes – MAGA Republicans have no class.
It’s the Democrats’ fault that McCarthy was booted. McCarthy said so. Because members of the minority have ALWAYS voted for a member of the other party tobeSpeaker, right? So Democrats must be punished.
@ Macroduck
I wonder if late in the night last night (Tuesday night), if the thought occurred to McCarthy that instituting the new rule allowing a single House member to put forward a “motion to vacate” was possibly very self-destructive?? Possibly this passed through his mind for 4–5 seconds?? Naaaahh!!!!……. that’s a lot of brain power for McCarthy.
Well, he goes on the list of Speakers in the history books, which he might not have done if he hadn’t accepted a gun to his head.
My guess is he’s telling himself what good company he’s in. “Me and Fred Muhlenberg, peas in a pod.” Uh huh…
the fact that he is not going to run again speaks volumes. he was not interested in the job, only the title. he was happy to get out of the hot kitchen. that is why he was willing to go through 15 failed votes to begin with. he had no concern for being neutered on day one. this was not a long term gig. just a dream job to brag about when he gets older.
Speaking of money stuff –
So, y’all know about the rise in interest rates. Banks play a big role in transmitting monetary policy. Banks can choose to hold financial assets like Treasuries and mortgage-backed securities, deposits at the Fed, or loans. Here’s a picture of total commercial bank assets and loans:
https://fred.stlouisfed.org/graph/?g=19Hj3
Looks like banks are cutting back on loans in absolute terms and as a share of assets.
That is not, apparently, because banks are stocking up on Treasuries and MBS or increasing deposits with the Fed:
https://fred.stlouisfed.org/graph/?g=19HlA
Repos might be the missing piece, but that’s just a guess. And the Fed has most recently cut back on reverses, so maybe not a good guess:
https://fred.stlouisfed.org/graph/?g=19HnT
Anyhow, slowdowns in bank lending tend to be associated with recession:
https://fred.stlouisfed.org/graph/?g=19HkN
So add that to the pile of worries.
Have you accounted for bank reserves parked at the Fed, Menzie?
Steven Kopits: This is the M4M including Treasurys as published by CFS (link provided in post). But if you knew what reserves at the Fed were held in, you would understand that even the narrowest monetary aggregate (M0) includes those Treasurys.
Did you really take economics courses?
I understand Kopits was a TA for a stats class as well…….
Menzie, are you ever extremely tempted to call the Registrars Office or the Alumni Association Office at Haverford College and Columbia University to verify details of Kopits’ CV??
I never attended Haverford College but once lived close enough to go for runs there. Gorgeous campus but some real stuck up kids.
You do not know the school. That does not describe it, not by a million miles.
Does money parked at the Fed influence retail prices? I would argue ‘no’. But go ahead, make the case, Menzie.
I believe this is what I am talking about.
https://fred.stlouisfed.org/series/TOTRESNS
Reserves of Depository Institutions
Yes Stevie – we know what has happened to bank reserves which show up on the asset side of bank’s balance sheets. But that is not money. Money consists of things like demand and time deposits – liabilities of banks.
Did you say you worked for Deloitte Hungary? Did you learn nothing about basic accounting> Assets v. liabilities? HELLO.
Damn – you are the dumbest clown I have ever met.
I predict that once Kopits exercises his December WTI call options, he will take donald trump’s spot in the Forbes 400:
https://thehill.com/business/4237688-trump-drops-from-forbes-list-of-wealthiest-americans/
The Forbes approach puts Trump’s net wealth at $2.6 billion. Look i respect how they try to value MLB teams given all the fake financial reporting baseball owners pull. But I have to wonder if Forbes has factored in the contingent liabilities Trump faces given all these lawsuits. After all his sidekick RUDY is bankrupt.
Bank reserves are not part of M1 or M2. But then you never got basic money and banking so hey!
This is one of those questions which, if asked in class, the professor response is likely to be “You want me to Google that for you?”
Yikes.
So, actual students: – When it comes to matters of simple fact, it’s to your benefit to find answers for yourself. Not questions like “Does the order of Amendments in the Bill of Rights reflect the importance of the Amendments?” because such questions have become too politicized for unfiltered sources to be reliable. But “Is this kind of account included in M1/2/3/4?” is exactly the kind of question you should answer yourself.
and with tools like chatgpt, it should be a piece of cake. direct questions get direct answers. and usually they are pretty accurate if the question is factual.
Steven Kopits: I misunderstood you comment. I see that you want reserves (held in the form of Treasurys) out. Here is what I just wrote as an addendum to the post:
I put this comment down here, so the thread section above allows Econned to respond directly to Professor Chinn. I predict Econned will insist he made divisia index lie “intentionally” in some kind of way that “the entire time” the intention was to “dupe” Professor Chinn and his readers. Econned’s personal insecurities are so easy view, similar to Barkley Rosser’s insecurities, it’s like taking an internal tour of his brain. Although the tour of Econned’s brain feels like walking across a broom closet.
BTW, It appears Elvira Nabiullina still has her job. “Miracles” never cease.
“I’m not a psychologist, so I can’t diagnose Econned’s problem.”
I’m not either but Econned reminds me of the bully in the school yard that went running to mommy after some girl punched him in the face. But problem. Make that plural as the list of his problems would take a while.
I’m telling you, borderline personality disorder. Symptoms include emotional instability, feelings of worthlessness, insecurity, impulsivity, and impaired social relationships.
Wow, 4 of the 6 traits you’ve just listed I share with Econned. Geez, I had no idea it was going to get this personal.
: )
professional jealousy.
Has Kevin Drum been reading all that trash on real wages from JohnH?
https://jabberwocking.com/charts-of-the-day-wages-have-beaten-inflation-over-the-past-year/
Charts of the day: Wages have beaten inflation over the past year
Just because I continue to think that a lot of people still don’t get this, here are two charts showing wages and inflation. The first starts in 2019:
No matter how wages are measured, they have risen more than the CPI since the start of the pandemic or over the last year. But here is the zinger:
“You can cherry pick all you want.”
Hey Jonny boy – he was looking directly at YOU. Now have a spine for a change and make a comment over at Kevin’s place. I dare you!
If pgl ever bothered to read what I said, he would have to admit that I have been saying that real wages have risen by less than 1%since before the pandemic. And this paltry rise occurred despite extraordinarily tight labor markets, a time when—according to economists—real wages are supposed to rise, and not just by a token amount.
Here’s the data from an impartial FRED source,not a partisan one like Kevin Drum.
https://fredblog.stlouisfed.org/2018/02/are-wages-increasing-or-decreasing/
Since the gains have been so trivial, it will be interesting to see if they get reversed as a result of the recent, higher inflation.
“I have been saying that real wages have risen by less than 1%since before the pandemic. ”
Maybe once in a Blue Moon you write something honest. But 99.9% of your BS posts try to convey the opposite.
“It’s clear that decreases can be frequent and sometimes long lasting. It’s also clear there’s a lot of variability, which means one should really wait for a good amount of data before reaching for any conclusions.”
From your favorite FRED blog post. The first statement was true for UK real wages under Cameron. But some lying troll kept telling us UK real wages rose? Who was that clown?> Oh yea – JohnH!
A couple indications that trivial real wage gains since before the pandemic may be erased. Personal disposable income dropped by 0.2% in each of the last two months. And average hourly earnings dropped by 0.5% last month. Plus gas prices at the pump rose significantly during Q3.
It doesn’t take much to erase trivial wage gains of <1% since before the pandemic, but in any event partisan hacks like pgly will undoubtedly try to convince us that Happy Days are Here Again, despite virtually non-existent real wage gains.
It will be interesting to see if economists continue to tell their tall tale of real wages rising during tight labor markets. From what I've seen so far is that they have grown quiet on this subject…very, very quiet.
OT, but appropriate for this political thread, as a key Biden policy falls: “Biden administration waives 26 federal laws to allow border wall construction in South Texas” https://www.msn.com/en-us/news/other/biden-administration-waives-26-federal-laws-to-allow-border-wall-construction-in-south-texas/ar-AA1hJpZw
There’s niggling around the edges of the drilling policies, and I suspect there will no more Covid-based mandates and weakening of the fossil fuel-based polices (yano those power plant and EV policies) as we approach the elections.
Hey CoRev – you forgot to mention this:
Construction of the wall will be paid for through a 2019 appropriations bill that funneled money specifically to a “border barrier” in the Rio Grande Valley, and according to Mayorkas, “DHS is required to use those funds for their appropriated purpose.” The funds needed to be spent by the end of fiscal year 2023, prompting the administration to choose to move forward this year with construction in south Texas, according to a source familiar.
I would think you’d be happy that Trump’s border wall will be extended. After all – the word is out that you have been scared of going to the park lest some Hispanic child says hello to you. Now you just get to hang with your dear KKK buddies.
Every now and then, some good news – workable solar powered desalination of seawater-
https://news.mit.edu/2023/desalination-system-could-produce-freshwater-cheaper-0927
What’s not clear from the article is whether this can be scaled to supply water for larger urban areas, and if so, how large volumes of water would be transported from offshore. The article discusses coastal villages and clearly implies potential for use at sea, but not much else.
Spoky, spoky – scary
“Gas prices could fall to $3.25 by Halloween as oil plunges”
https://www.cnn.com/2023/10/05/business/gas-prices-fall-by-halloween/index.html
What was it that pretend oil expert [what’s his name] told us here a few weeks ago?
“After spiking to alarming levels just last week, oil prices are suddenly in free-fall mode. The dramatic reversal should bring relief to drivers (and nervous central bankers) very soon. US oil prices plunged by 5.6% to $84.22 a barrel on Wednesday, marking the biggest one-day decline in a year. Crude dropped even further Thursday, sinking as low as $82.24 a barrel, a five-week low.”
Pretend oil expert little Stevie boy says just today he stands by his forecast that oil prices will exceed $100. Is this like a Mets fan standing by his team’s chances of winning the 2023 World Series?
Way off topic, but I think I detect a failure of understanding around the interaction of refugees and housing in the UK:
https://www.theguardian.com/world/2023/oct/05/more-than-50000-refugees-could-be-made-homeless-in-asylum-backlog-clearance
The argument is made that accelerated processing of asylum claims is going to lead to increased homelessness, mostly forasylumseekees. I suppose there processing of asylum seekers could result in empty bads someplace, but if that’s not the case, the in a situation in which people>homes, then accelerating the processing of refugees isn’t a cause of homelessness. Different individuals will end up homeless, and advocates for those made homeless may think homelessness has increased due to a policy change, but it hasn’t. The problem is a housing shortage, not a change in refugee status. I think.
The housing shortage at the kow end if the market in the UK runs to millions of units, and the government has no plan adequate to address the problem:
https://www.bigissue.com/news/housing/it-would-take-50-years-to-build-the-homes-the-uk-needs-under-the-governments-300000-annual-target/
I know this is way off topic, but it annoys me when problems are so obviously misdiagnosed. When housing is undee supplied, homelessness is the result.
That’s arguably the same problem California has, and some metro USA cities. I have even seen more homeless in my suburban area here, I have seen more homeless in this suburb the last 2 years than I have seen in the prior combined 20 years. And that is also interesting in that the homelessness does not seem to be REFLECTED in the current economic numbers.
Kaiser Permantente employees are striking, in part due to under-staffing. Certainly KP could attract more staff by raising wages and improving working conditions, but since there is a nationwide shortage of nurses and other medical personnel, we’d still have staff shortages in the near term. Better compensation would eventually attract more people to healthcare jobs, though, so in the longer term, better compensation is a way of addressing the shortage.
But there’s a supply chain problem – a shortage that’s causing a shortage:
https://www.cnn.com/2023/10/05/business/nursing-staff-shortage-school-enrollment/index.html
People needed to train nurses are in short supply, partly because they are filling nursing vacancies.
This is a market failure. Y’all know what ought to happen when there’s a market failure, right?
It is a similar problem for teachers. One issue is pay. The other is respect. Neither profession is respected, so people leave the field. Ever see how the public is permitted to treat teachers and nurses? Ever see how managers treat them? Poorly.
Looks like we may need to add another climate tipping point to the list:
https://www.theguardian.com/environment/2023/oct/04/south-american-monsoon-heading-towards-tipping-point-likely-to-cause-amazon-dieback
A weakening in the South American monsoon creates positive feedback, further weakening the monsoon. The Amazon rainforest plays a large roll in maintaining the monsoon pattern.
Of course, CoRev regularly insists that, unless I provide links to climate tipping points, they don’t exist. Anyone seriously interested doesn’t need me to find information about those tipping points, but then CoVid isn’t seriously interested.
McQuack, from the scientific paper that created your referenced article: It begins with “The Amazon rainforest is threatened by land-use change and increasing drought and fire frequency.” These are clearly largely man made impacts, but do not the CLIMATE CHANGE hypotheses centered upon GHGs and their solutions stopping use of fossil fuels, implementing use of EVs and renewables sources for electricity.
There is growing push back on the EV front from buyers, insurance companies and sellers with mounting inventory problems and there is growing evidence and understanding renewable (especially wind and solar) electricity sources and their required backups can never affordably meet peak demand periods adding unreliability to any grid using them. Unreliability is what kills their grid users.
Overbuilding has been the mantra for the brain dead wind and solar adherents, but how much overbuilding of wind and solar will be needed when the wind stops at night, which often happens. how many times the installed base of wind and solar are needed when they are providing ZERO or near ZERO electricity? The following graph illustrates the frequency of those wind events actually meet the AVERAGE DEMAND LOAD: https://substackcdn.com/image/fetch/w_1456,c_limit,f_webp,q_auto:good,fl_progressive:steep/https%3A%2F%2Fbucketeer-e05bbc84-baa3-437e-9518-adb32be77984.s3.amazonaws.com%2Fpublic%2Fimages%2Fdb881774-91f8-4c01-beb2-69d1a112dd72_509x484.png
The picture for solar is even clearer of DAILY failure. These data are from Texas where it is considered a panacea for wind production, which is similar to the current description of off-shore locations. They are failures today and will be forever.
Everyone of those output measures BELOW the average load is a failure. Every time wind/solar/wind and solar reaches ZERO output is an unfixable failure that no AMOUNT OF INVESTMENT in more wind can cure their failures making the cure way too expensive for consideration.
Wind and solar are not fit for the purpose of replacing thermal sources for electricity production.
CoRev: In your first para, you note “drought” as man-made. Finally! You concur that anthrogenic climate change has increased the frequency of drought in some areas.
Menzie,”You concur that anthrogenic (sic) climate change has increased the frequency of drought in some areas.” I have always claimed that some of the temperature increases were man made: farming/land use, Urban heat island, irrigation, etc. What I have also always claimed was that the “CLIMATE CHANGE CATASTROHPIST’S” claim of temperature increases was ALL due of to man’s use of fossil fuels which emitted CO2, in other words, ALL MAN MADE and CO2 driven.
Since this set of hypotheses is false then the solutions are also false. Man’s land use clearly has increased temperatures, as well as man has increased droughts, and wild fires.
I will repeat the message of my comment: Wind and solar are not fit for the purpose of replacing thermal sources for electricity production. Adding to a grid weakens the grid, decreases grid reliability, always requires an alternative back up source, adds unneeded costs to the grid for this negative grid impact. As an economist you have never admitted these results.
I asked 2slugs to answer a simple set of questions defining the impacts of this set of “CLIMATE CHANGE CATASTROHPIST’S” hypotheses.
Except in Man made models, the science has not been able to answer these questions from the physical data.
I’ll wait for your response.
corev, this is nothing but garbage. you seem to understand nothing about concepts of energy storage. in fact, we have been using energy storage for decades at large scale. hydroelectric dams are a dramatic example of energy storage. wind and solar are very complementary to energy storage technology. which makes your arguments obsolete. but you knew that already.
Agree, the absurdity of making arguments of wind and solar without including energy storage is just comic at this point. I guess the desperation of facing an ever falling price for generation of renewable energy makes them do such idiotic things.
Baffled and Ivan, and yet you can not answer the questions regarding the costs to the grid users of these alternative sources to electricity, WIND/Solar/ and energy storage. The goal is to replace thermal sources and till meet peak demand. To do less is both life threatening and costly. Answer the question how much of these is needed?
I can answer using Baffle’s ERCOT as an example: W&S output must be sized to always supply/be dispatched to meet peak demand for 2023 August 10 85,464. We know both wind and solar can and will go to ZERO output. solar does it daily and wind frequently. Wind output often goes to zero at night. So the answer to sizing W&S is 85,464/0 equals (W&S are not suitable to replace thermals at peak or any load).
Since you are relying on energy storage to make up the difference in W&S outputs battery sizing would also need to be 85,464. As of July 2021 ERCOT’s battery storage was 3,518 MW. So, 85,464/3518= 24.3 times current battery installed base is needed.
To sum up the current situation in Texas, if your goal is to replace thermal sources and still meet peak demand W&S are not fit for that purpose, and if you want to replace thermal sources with battery storage at least 24.5 current investment is needed. ll to be paid by the ERCOT’s rate payers. That’s without even considering the subsidy subterfuge, which is also paid for by those same rate payers.
Menzie,”You concur that anthrogenic (sic) climate change has increased the frequency of drought in some areas.” I have always claimed that some of the temperature increases were man made: farming/land use, Urban heat island, irrigation, etc. What I have also always claimed was that the “CLIMATE CHANGE CATASTROHPIST’S” claim of temperature increases was ALL due of to man’s use of fossil fuels which emitted CO2, in other words, ALL MAN MADE and CO2 driven.
Since this set of hypotheses is false then the solutions are also false. Man’s land use clearly has increased temperatures, as well as man has increased droughts, and wild fires.
I will repeat the message of my comment: Wind and solar are not fit for the purpose of replacing thermal sources for electricity production. Adding to a grid weakens the grid, decreases grid reliability, always requires an alternative back up source, adds unneeded costs to the grid for this negative grid impact. As an economist you have never admitted these results.
I asked 2slugs to answer a simple set of questions defining the impacts of this set of “CLIMATE CHANGE CATASTROHPIST’S” hypotheses.
Except in Man made models, the science has not been able to answer these questions from the physical data.
I’ll wait for your response.
Ivan, show us the real world grid examples where: “… ever falling price for generation of renewable energy…” equates to lower grid prices.
I’ll wait.
Baffled, Ivan, McQuack, Menzie, and all others who believe that renewables is the solution to reducing CLIMATE CHANGE, please answer this:
If we are facing more extreme weather due to climate change, it would be insane to make our most-critical infrastructure dependent on the weather. We need energy and power systems that are weather resilient, not weather dependent.
What additional level of insanity do you now propose? EVs, increased electrification, removal of fossil fueled energy, reduced exploration and production of fossil fuels, etc. are just some examples of this ignorant insanity.
I’m still waiting for the answers to those simple questions posed re: your CLIMATE CHANGE impacts. Y’ano those impacts you are trying to solve with these insane policies without being able to discuss the metric of these impacts.
“If we are facing more extreme weather due to climate change, it would be insane to make our most-critical infrastructure dependent on the weather. ”
so in covids world, we should double down on using the very same energy sources that created the climate change to begin with. brilliant. nothing bad could ever happen from that approach! idiot.
“Since you are relying on energy storage to make up the difference in W&S outputs battery sizing would also need to be 85,464.”
there you go, thinking again covid. it is dangerous. energy storage does not require a battery in the conventional sense, which is my point to begin with. there are large scale ways to store energy that are not the traditional battery.
and you are making a false argument. most people are not saying that thermals are gone today and fully replaced with renewables. we are simply heading in that direction, as technology and cost allow us to proceed. if you were not so obsessed with the tribalism of thermal sources, you would understand this. your absolute animosity towards the future is truly baffling. at least I need not consider you a long term concern, just near term noise.
Baffled takes offense at the use of battery instead of his preferred “energy” storage: “energy storage does not require a battery in the conventional sense, which is my point to begin with. there are large scale ways to store energy that are not the traditional battery.” Without defining his claimed ” large scale ways to store energy”, nor providing any real world examples, he still believes in the viability of renewables with “energy storage”. Doing the simplest arithmetic using his own ERCOT source for electricity we find that ERCOT as of 6 Sept 2023 had “Current Generation of power Storage of 860 MW (1.2%) of generation total. https://substackcdn.com/image/fetch/f_auto,q_auto:good,fl_progressive:steep/https%3A%2F%2Fsubstack-post-media.s3.amazonaws.com%2Fpublic%2Fimages%2F508dc406-22fa-46e5-8be8-7f8f6024ab92_1064x1380.png
So in Baffled’s insanely tilted world of renewables replacing thermal sources, when the wind doesn’t blow at night, Energy Storage would still need to provide 100% of demand. That means they need to be expanded (100/(7.3+.3+1.2))=11.4 TIMES the 6 September 2023 Investment. all of this to be paid by ERCOT rate payers, and further subsidized Texas and US tax payers.
The 11.4 Times are approximate numbers with marginal sources ~.6% of production.
Energy storage still fails to solve the problem that the Wind and Solar sources can go to zero at any given time, requiring as much as 100% backup. Provide the real world successes.
its already been discussed on this site, but here it is again. technology is available to render covids complaints irrelevant.
https://www.cnn.com/2022/08/01/world/water-battery-switzerland-renewable-energy-climate-scn-hnk-spc-intl/index.html
covid, just read and learn. the world has changed dramatically since the 1960’s. to bad you are still the same old sucker.
Baffled again cites another inadequate “energy storage” example, The Nant de Drance power plant, https://www.nant-de-drance.ch/en/the-plant
Showing even another example of inadequate backup in Switzerland /France still does not show how “Energy Storage” meets the need to supply demand when the Wind & Solar fail. Too little and too costly to be used in most states here, especially in Texas.
It does emphasize his failure to understand the fundamentals of a serious issue, backup is essential for for a grid where Wind and solar exist.
I see. it is inadequate because it makes your arguments invalid. brilliant analysis covid. keep up the good work. I hear the 60’s calling you again. as I said before, we see the future. some fools, like you and Steven, are in denial. but you cannot stop progress. it is inevitable.
Baffled, you can not even cite my argument, so I will repeat it for you (From your earlier comment): “Since you are relying on energy storage to make up the difference in W&S outputs battery (replace battery with “Energy Storage”) sizing would also need to be 85,464.” 85,464 is peak demand load.
In your demented electricity centered world Wind & Solar are the sole or at least base load sources for electricity. “Energy Storage” must provide peak demand load to backup failed Wind & Solar. Solar fails daily and Wind drops to zero or near zero so often to make it NOT SUITED for supplying base load and impossible to meet peak demand.
Your preferred solution is “Energy Storage” of some sort, but you can not or will not estimate their costs to a grid. i have done so, and when your preferred electricity sources go to ZERO or near ZERO the “Energy Storage” cost go to INFINITY. All to be paid by grid users/rate payers and tax payers for the subsidies.
Your solutions ares insanely costly and will NEVER be possible. No matter how much overbuilding you propose.
You epitomize blind belief and religious belief to solve a non-existent or at best a minor problem, “Climate Change”.
Baffled claims: “I see. it is inadequate because it makes your arguments invalid. brilliant analysis covid”
And yet, he has failed to refute that argument, which is: “Wind and Solar (including “Energy Storage” can never replace Thermal sources for electricity, and can not even define the problem(s) they are solving.
If you are solving “CLIMATE CHANGE” then define it. If you are solving advancing amounts of CO2, then define how much your solutions reduce it. Define how much of which/each climate condition will be changed. Define the costs of your solution(s) to the specific problem you are trying to solve. Define the costs of which/each climate condition if they are allowed to continue.
Instead your religious/blind belief continues to plan on spending $ trillions without defining any of the above questions.
I’ll wait for your next unsupported response and/or any answers to the above questions. Remember model outputs are not data, unless supported by REAL WORLD metrics.
I’ll continue to wait.
covid, your comments are incoherent, as usual. I have made a clear observation about energy storage on a large scale. it actually exists, today. and similar energy storage technology continues to evolve. you seem to be in denial of the facts on the ground. energy storage is not some insurmountable problem today. it is an engineering problem, with viable solutions. it has a better future than fossil fuels.
Oh my- this likely means JohnH will not be served his dog food in the Kremlin today:
Russia Withdraws Black Sea Fleet Vessels From Crimea Base After Ukrainian Attacks
Pullout represents painful setback for the Kremlin, which seized Crimea in 2014
https://www.wsj.com/world/russia-withdraws-black-sea-fleet-vessels-from-crimea-base-after-ukrainian-attacks-51d6d4f5?st=jvlsdqq238gwo3o&reflink=desktopwebshare_permalink
Russia has withdrawn the bulk of its Black Sea Fleet from its main base in occupied Crimea, a potent acknowledgment of how Ukrainian missile and drone strikes are challenging Moscow’s hold on the peninsula. Russia has moved powerful vessels including three attack submarines and two frigates from Sevastopol to other ports in Russia and Crimea that offer better protection, according to Western officials and satellite images verified by naval experts. The Russian Defense Ministry didn’t respond to a request for comment.
The move represents a remarkable setback for Russian President Vladimir Putin, whose military seizure of Crimea in 2014 marked the opening shots in his attempt to take control of Ukraine. His full-scale invasion of last year has now boomeranged, forcing the removal of ships from a port that was first claimed by Russia in 1783 under Catherine the Great.
Ahead of tomorrow’s data, where have all the workers come from to keep job growth high in a tight labor market? To a great extent, it has been women who have been showing up for new jobs:
https://fred.stlouisfed.org/graph/?g=19KlM
Note that the labor force participation rate among prime-working-age women had reached a new high when Covid struck, that female participation fell more than male participation during Covid, and that a new high in female participation was reached in June. Note also that both female and male participation rates have fallen a bit recently. That may just be noise or a seasonal adjustment problem. But particularly for record-high female participation, there is reason to suspect the top is in.
This article at NPR notes that female workers have been a source of strength for the economy, but misses the possibility that female participation may stall:
https://www.npr.org/2023/07/05/1185723117/working-women-jobs-workforce-pandemic-economy-employers-labor
Of course, a slowdown in new labor market entrants isn’t the end of the world. The Sahm rule works because a decline in labor demand is symptomatic of recession. A stall in labor supply will slow growth, but won’t necessarily end it.
Rather, the Fed will see a falling jobless rate and rising wages as reason to hike rates. So the Fed, not limited labor supply, is the risk.
Econned has suggested our host failed some “ideological Turing test”. Oh gee – not buying into the simpleton QTM disqualifies one as being a free market conservative? Let’s see:
Robert Barro never was a proponent of QTM.
Robert Lucas’s microfoundations is the best way to mock the stupidty of QTM.
Tom Sargent never had to rely on this QTM.
OK Milton Friedman (Econned’s hero even as this moron has no clue what Dr, Friedman contributed to economics) once mentioned QTM but even he gets its inability to statiscally expain a damn thing.
How does Econned get this all wrong? Easy – Econned is a partisan jerk who knows less about macroeconomics than even Princeton Steve.
“Monetarism Is Back, It May Not Last”, James Mackintosh, WSJ, P. B11, Oct. 7-8-2023.
I thought the cited WSJ article was balanced and noted the repudiation of monetarism. An interesting reference is, “A paper by the Bank of International Settlements this year concluded that there’s no link between the quantity of money and inflation when inflation is low. But in a high inflation regime, money supply is a near perfect indicator.”