Industrial production near consensus, while manufacturing surprises on upside (+0.8% vs. +0.3% m/m). Here’s a picture of key indicators followed by the NBER Business Cycle Dating Committee, along with SPGMI’s monthly GDP (formerly from Macroeconomic Advisers and IHS-Markit).
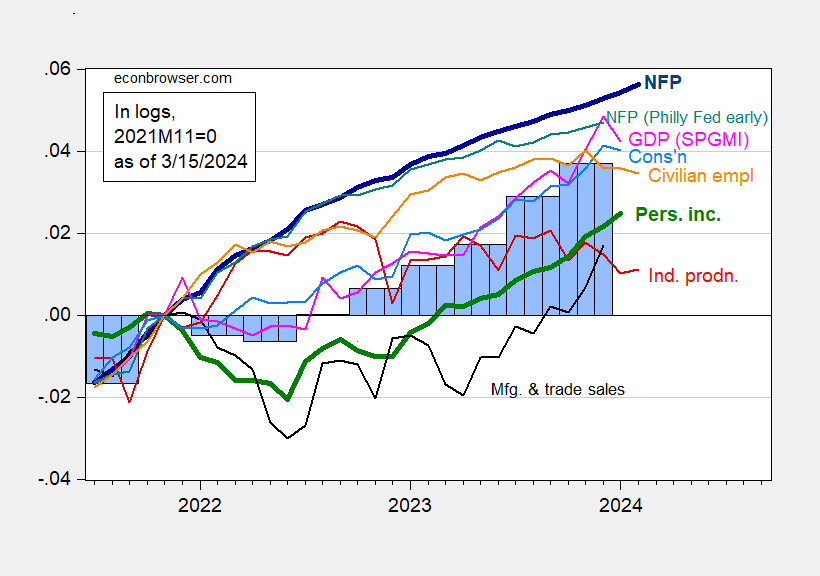
Figure 1: Nonfarm Payroll employment from CES (bold blue), from Philadelphia Fed early benchmark (teal), civilian employment (orange), industrial production (red), personal income excluding current transfers in Ch.2017$ (bold green), manufacturing and trade sales in Ch.2017$ (black), consumption in Ch.2017$ (light blue), and monthly GDP in Ch.2017$ (pink), GDP, 3rd release (blue bars), all log normalized to 2021M11=0. Source: BLS via FRED, Federal Reserve, BEA 2023Q4 2nd release, S&P Global Market Insights (nee Macroeconomic Advisers, IHS Markit) (3/1/2024 release), and author’s calculations.
I include the Philly Fed’s early benchmark CES series (not the sum of states) as a check on whether the BLS birth/death model is imparting too much job creation to the official series (see discussion in yesterday’s post).
Note that industrial production has been lackluster over the past year or so. Industrial production includes manufacturing, mining, and utilities. I thought it of interest to see how real value added, reported with a much greater lag, correlates with industrial production (which is a gross measure).
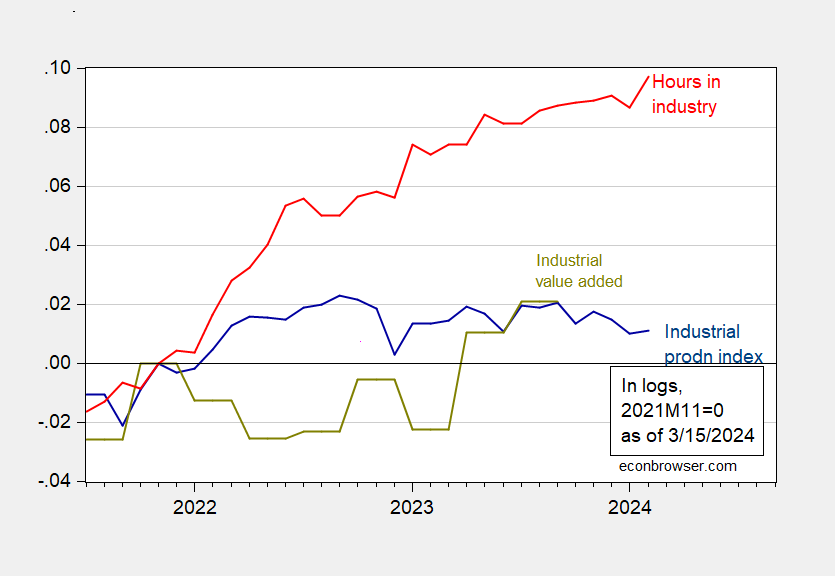
Figure 2: Industrial production index (blue), and value added in industry (sum of manufacturing, mining, and utilities), in 2017$ (chartreuse), aggregate weekly hours of production and nonsupervisory workers in industry (red), all in logs 2021M11=0. Note: Industrial value added calculated as simple sum of components, rather than using a Tornqvist approximation. Hours for industry includes logging (which is about 7% of employment in mining and logging). Source: FRB, BLS via FRED, BEA, and author’s calculations.
Industry value added and production index have moved in different ways since end-2021, but are roughly at the same level relative to 2021M11 as of Q3. Hours have moved up consistently, in contrast.
Manufacturing has shown less divergence.
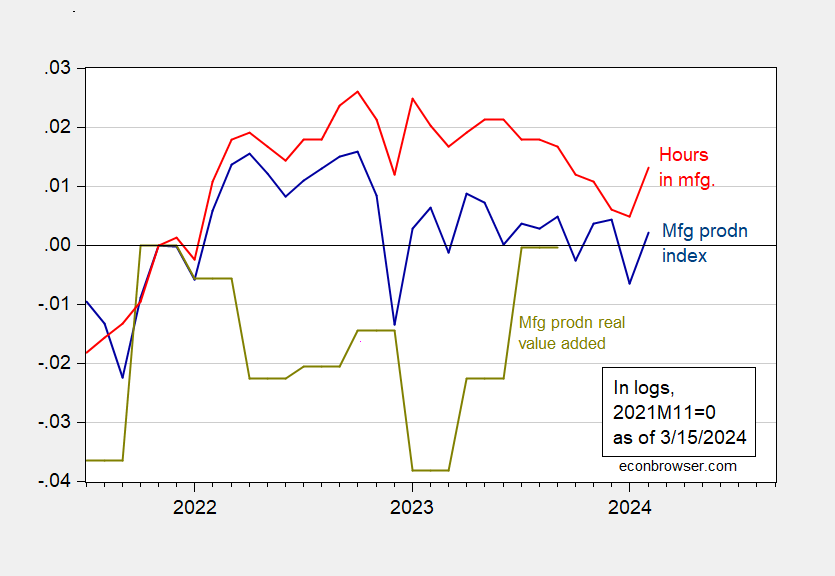
Figure 3: Manufacturing production index (blue), and value added in manufacturing, in 2017$ (chartreuse), aggregate weekly hours of production and nonsupervisory workers in manufacturing (red), all in logs 2021M11=0. Source: FRB, BLS via FRED, BEA, and author’s calculations.
Manufacturing value added did fall over the course of 2022, but has rebounded since, so that the level relative to 2021M11 is about the same as that for manufacturing production. From a business cycle perspective, the rebound in production and hours worked suggests the slowdown has moderated (one shouldn’t take too much from one month’s data, particularly preliminary).
industrial production and manufacturing saw downward revisions to January and upward revisions to 4th quarter months which left the first quarter average below the 4th quarter…but the overall IP index has been jerked around by the utility index so much over the past two months such that it has become a contrary indicator for the weather…
the industrial production index (2017=100) came in at 102.3 in February, after the January index was revised from the 102.6 reported last month to 102.2, the December index was revised but unchanged at 102.7, the November index was revised from the 102.7 reported last month to 103.0, the October index was revised from 102.4 to 102.6, and the September index was revised from 103.2 to 103.3…
the manufacturing index rose from 98.4 in January to 99.2 in February, after the manufacturing index for January was revised down from 98.6 to 98.4, the manufacturing index for December index was revised up from 99.1 to 99.5, the manufacturing index for November index was revised up from 99.1 to 99.4, and the manufacturing index for October index was revised up from 98.7 to 98.8, leaving the manufacturing index 0.7% below its year ago level..
meanwhile, the utility index, at 10% of IP, fell by 7.5% during our record warm February weather, from 98.8 to 93.3, after our colder than normal January’s utility index was revised from 98.7 to 98.8, now up 7.4% from December….that was partly offset by a 2.2% increase in the mining index, as it partly recovered from the 2.9% hit it took in January due to well freeze-offs…freeze-offs also hit Gulf Coast refining, but that didn’t recover until March….that’s the 3 winters in four that oil & gas has taken a sharp hit from the cold….sad that we’re so dependent on intermittent energy, isn’t it?
been meaning to get back here with the details on the revisions to retail sales, since no one seems to cover them…in February’s case, they’re important because they leave the 1st quarter’s real PCE goods solidly below that of the 4th quarter, just as industrial production revisions left the IP indices for January and February below the IP indices for October, November & December…
nominally, seasonally adjusted retail sales totaled $700.7 billion during February, which was 0.6 percent (±0.5%) higher than January’s revised sales of $696.7 billion; however, January’s sales were revised down more than 0.5%, from $700.3 billion to $696.7 billion, while December’s sales were revised 0.3% lower, from $706.2 billion to $704.1 billion; as a result, Census says “the December 2023 to January 2024 percent change was revised from down 0.8 percent (±0.5 percent) to down 1.1 percent (±0.4 percent)”
the downward revision to December sales would suggest that nominal 4th quarter personal consumption expenditures would be revised lower at about a $8.4 billion annual rate, which would lower 4th quarter GDP growth by roughly 0.16 percentage points, give or take, depending on how the inflation adjustments shake out..
after inflation adjustment based on CPI components, i figured real PCE goods (2017$) would be up more than 0.3% in February, after falling by a revised 1.4% in January, after rising by a revised 0.6% in December, and rising 0.4% in November, unrevised…as you can gather from that, that big January drop means both January and February real PCE goods end up below the real PCE goods of each of the 4th quarter months…
Y’all know ow how I love looking for bad news. Longstanding troubles in the Democratic Republic of Congo, and between Congo and Rwanda, are heating up:
https://www.africanews.com/amp/2024/03/14/drc-7-million-displaced-and-unprecedented-crisis-according-to-the-un/
The numbers are staggering. A fresh quarter million people have been displaced over that last month, swelling to total number of displaced in the DRC to seven million.
The colonial-era strategy of stoking ethnic conflict to exert control lives on, as does dependence on extractive industries – history is like that. The more immediate issue is that Goma, a city of two million inhabitants, has been having difficulty bringing in food for the past month, and refugee camps are becoming a source of disease there. Aid organizations are warning of famine in the city:
https://www.aciafrica.org/index.php/news/10492/humanitarian-situation-in-eastern-dr-congo-serious-and-risks-getting-worse-salesians
Goma, alone, is a Gaza-sized disaster in the making, and there is growing risk of outright war between the DRC and Rwanda. If there is war, it will focus initially on Goma, as a simple matter of geography.
since i brought it up, here’s weekly refinery utilization rates for PADD3 (the Gulf Coast region:
https://www.eia.gov/dnav/pet/hist/LeafHandler.ashx?n=PET&s=W_NA_YUP_R30_PER&f=W
you should remember the cold of this recent January;
last year’s winter storm Elliott, aka “Christmas blizzard” with below zero temps was Dec 21 – Dec 26, 2022
2021’s winter storm Uri was February 13–17, refinery utilization fell from 86.5% on the 12th to 40.9% by the 26th, and didn’t recover to the early February level until mid-April…
The goods sector looks to be improving, after a couple of tepid years.
I am puzzled by the persistent disconnect between orders and output:
https://fred.stlouisfed.org/graph/?g=1ikMu
The logistics managers index remains positive, suggesting continued goods-sector growth:
https://www.the-lmi.com/february-2024-logistics-managers-index.html
The text for the logistics managers report makes clear that we are not seeing run-away growth in the sector, but growth is picking up.
Inventories aren’t looking too high overall, but the distortions from the Covid recession aren’t fully washed out, and as a result, factories are still carrying fairly high inventories:
https://fred.stlouisfed.org/graph/?g=1ikLI
If anyone has a good explanation for the gap between orders and production, could you let me in on the secret?
Macroduck: On production vs. orders, isn’t orders in nominal terms, and industrial production in real? PPI for core finished goods up about 26% since mid-2017, so I think that accounts for some chunk of the difference.
Yikes! My bad. Thank you.
This is one of the things I like about Prof Chinn. He finds a nice way to keep commenters on their toes and watching their “p’s” (??) and “q’s” (??) Many College profs use it as a “put down” opportunity. It’s a special college professor who educates, minus the put downs. That’s gold in my book.