It doesn’t always work.
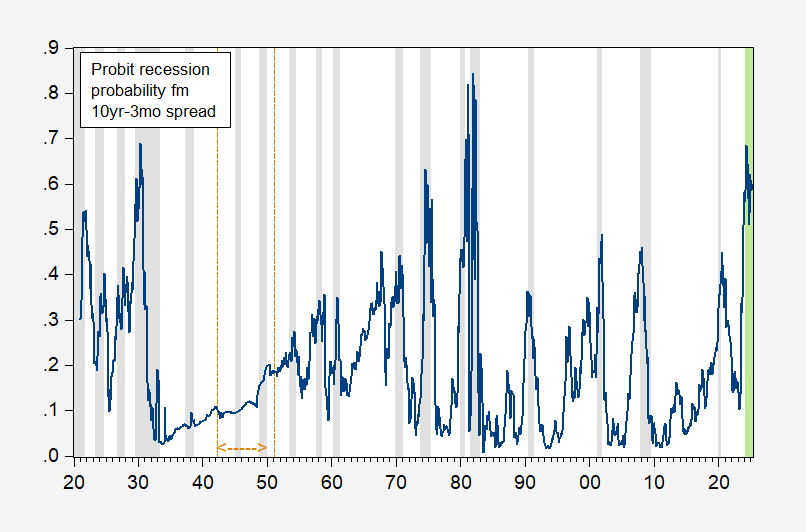
Figure 1: Recession probability one year ahead for 10 year-3 month Treasury spread (blue). NBER defined peak-to-trough recession dates shaded gray. LIght green shaded area denotes out-of-sample period. Orange dashed line denotes Fed agreement on rates. Source: NBER, and author’s calculations.
The estimated probit regression:
Pr(rec=1) = -0.29 – 0.49 spread
Pseudo-R2 = 0.13, Nobs = 1238, Smpl for spread, etc. 1921M02-2024M02. Bold face denotes significance at 5% msl.
(Data notes: Ten year spread from Shiller. Three month rate from FRED (TB3MS) from 1934M04 onward; three month yield 1920M01-1934M03 is from NBER MacroHistory database/Friedman-Schwartz.)
Obviously, this is not a good fitting specification for this sample period. That’s entirely the point — the term spread predictor’s success is to some extent period-specific.M03
That makes sense for the 1942M04-1951M03 period during which the Fed pegged short rates, and long rates were capped. Then the coefficient on the term spread has the wrong sign, and is statistically insignificant. But in fact the (constant coefficients) specification does not work well for the 1934-1941 period as well.
Patience is a virtue
Not bad for a correlation parameter – but it is still predicting events that didn’t happen and there were events happening that were not predicted. So we need robust mechanistic models that can explain why this correlation is true most of the time and under what conditions it fails.
Off topic – abortion and politics:
Trump has decided that states should decide the abortion question. As if waiting for the Great Orange God to speak, Arizona’s Supreme Court has upheld a 160-year-old abortion ban:
https://www.azcentral.com/story/news/politics/arizona/2024/04/09/arizona-abortion-law-state-supreme-court-upholds-near-total-ban/73251148007/
In recent polling, 49% of Arizona adults favored relatively unrestricted access to abortion, vs 46% who favor tight restrictions:
https://www.pewresearch.org/religion/religious-landscape-study/state/arizona/views-about-abortion/
Nothing from Pew on middle positions, which Arizona’s new old law doesn’t allow for.
Noteworthy when it comes to politics, Arizona has recently gone from leaning “Trump” to undecided:
https://www.270towin.com/maps/biden-trump-2024-map-based-on-polls
Abortion rights have proven a potent issue in recent elections, entirely to the benefit of those who favor access to abortion. It will be worth watching what happens to polls in Arizona.
By the way, the 270-to-Win electoral vote tracker is a better way to understand the current state of the presidential race than national polls or approval ratings. Can’t say about betting markets, since they may include knowledge of the electoral map. The 270 map’s slider gives a look at change over time, which is also instructive.
I thought this was a pretty good national breakdown of the presidential election, even though it is aimed at an Oklahoma audience. Your comments on the number 270 made me want to share it:
https://ocpathink.org/post/analysis/how-oklahomas-presidential-votes-officially-count
Some bozo imbiber said this back in early February:
https://econbrowser.com/archives/2024/02/probability-of-recession-term-spread-vs-term-spread-dsr-foreign-term-spread#comment-309361
It is fascinating to watch. Rate shock, curve inversion, office vacancies, 2 1/2 years of fiscal contraction, floods and fires and Moskow Marjorie, and the economy is running like a top. Not what one would expect, but that’s what’s happening.
Now, who can we blame for this?
Much less policy uncertainty, so more willing to invest??
https://home.treasury.gov/news/featured-stories/infrastructure-investment-in-the-united-states
https://crsreports.congress.gov/product/pdf/R/R44896/5
Economic Impact of Infrastructure Investment – Congressional Research Service
January 24, 2018
Notice the CRS wrote this a year into the Trump Administration. And he nothing with it,
As an old yield curve junkie I would only look when it is short term rates rising that causes inversio0n ie the central bank raises rates.
Using the archival data available at FRED, the yield curve fails as an indicator for almost the entire time between 1932 and 1968:
https://fred.stlouisfed.org/graph/?g=1jRbs
There were no actual inversions during this time, and yet a number of recessions. There were also near misses, most notably in 1966, where there was no recession.
This is why I have always thought that forecasting should rely on a consistent constellation of indicators, rather than any one series.
Could the term spread be vulnerable to the Lucas critique once its predictive power became ubiquitous?
What behavior would change based on knowledge? The reaction I would expect to knowing that a recession signal is flashing is an increase in saving. Paradox of thrift and all that, so that Lucas would suggest recession signals would be self-fulfilling. That’s my hunch, but also part of the press coverage of the 2022 recession scare – people worried that expectation of recession could trigger recession.
Macroduck What behavior would change based on knowledge?</i?
Well…the Fed's behavior for one. If a lot of investors come to believe that the Fed sees the term spread as a recession indicator, then it would be rational for those investors to expect the Fed to take action now in order to defeat the possibility of a recession. So it's likely that those investors will come to see the term spread as no longer reliable if the Fed actually does what they expect it will do. In other words, at some point it might become a kind of Russian egg doll.
Solid question.
If monetary policy and fiscal policy are weighted heavily enough, I would think the answer would be “yes”. Along with other purely private market moves.
@ 2slugbaits
Your question makes me think of this also:
https://www.ft.com/content/0ca06172-bfe9-11de-aed2-00144feab49a
I’m pretty certain there must be other terminology for the near exact same phenomena.
2slugbaits,
Being ignorant about the name, “Lucas critique”, but perhaps not ignorant to the fact that folks change behavior, I asked MSN chat (now called Copilot) about the Lucas critique.
Maybe the response is of some interest.
The Lucas Critique is a concept in economic theory named after economist Robert Lucas.
It criticizes traditional econometric models used for policy evaluation. The critique argues that it is naïve to try to predict the effects of a change in economic policy entirely on the basis of relationships observed in historical data, especially highly aggregated historical data.
More formally, it states that the decision rules of Keynesian models—such as the consumption function —cannot be considered as structural in the sense of being invariant with respect to changes in government policy variables. This means that economic agents’ behavior might change in response to policy changes.
The Lucas Critique suggests that if we want to predict the effect of a policy experiment, we should model the “deep parameters” (relating to preferences, technology, and resource constraints) that are assumed to govern individual behavior: so-called “microfoundations”. If these models can account for observed empirical regularities, we can then predict what individuals will do, taking into account the change in policy, and then aggregate the individual decisions to calculate the macroeconomic effects of the policy change2.
This critique is significant in the history of economic thought as it represents a paradigm shift that occurred in macroeconomic theory in the 1970s towards attempts at establishing micro-foundations.
Specifically related to the 10y3m spread used to forecast recessions:
The 10y3m FRED series, which is the spread between the 10-Year Treasury Constant Maturity and the 3-Month Treasury Constant Maturity, could potentially be subject to the Lucas Critique.
The Lucas Critique suggests that if the policy environment changes, the historical relationship between these two rates might not hold in the future. For instance, if the Federal Reserve were to significantly change its policy approach, market participants could alter their behavior in response to this change. This could potentially change the relationship between the 10-year and 3-month rates, making predictions based on past data less reliable.
However, it’s important to note that the Lucas Critique is a theoretical concept. Whether it applies in a specific situation would depend on a variety of factors, including the nature of the policy change, the extent to which market participants adjust their behavior in response, and the degree to which the model used to predict the spread takes these factors into account.
if i understand the spread, it is based on the difference between 10 year and 3 month treasury. 3 month treasury are a direct function of the fed interest rates, ie from a small board of directors understanding of the economy. the 10 year is a function of the marketplace, millions of people making transactions daily. so the spread is a function of two inputs that could be rather inaccurate at times. if this view is correct, i would expect such a spread to correlate with events such as recessions, which seem to be understood after the fact, to not be particularly robust as uncertainty increases (or economic unknowns rise). it would seem there must be a limit on the accurate use of such a spread, and that accuracy should also vary with time and conditions. none of which we probably know in real time.
Model used to predict the spread? Aren’t we rather trying to predict recession?
Yes, the spread is used to try to forecast a recession.
From what I have learned from Professor Chinn, a probit model is used to forecast recessions, using monthly data, with the form of
USRECM c spread (-12), where USRECM is the convenient FRED series for a recession indicator = 0 or 1, original data from NBER.
For certain periods of time one can use the FRED series T10Y3M as the spread. T10Y3M is conveniently calculated by FRED since 1982.
“The Lucas Critique suggests that if we want to predict the effect of a policy experiment, we should model the “deep parameters” (relating to preferences, technology, and resource constraints) that are assumed to govern individual behavior: so-called “microfoundations”.’
When John Cochrane said deregulation could lead to 4% growth for over a decade, the best rebuttal to this nonsense was someone asking him if his “weeds in the garden” hypothesis was grounded in Lucas’s microfoundations.
Now could someone ask Princeton Stupid Steve if the Quantity Theory of Money is grounded in microfoundations.