Talking about a rethink of the output gap, and the concept of the trend-cycle decomposition in macro policy tomorrow. Here’s a picture of the output gap from CBO, from two statistical filters (Hodrick-Prescott and Fleischman-Roberts/Fed Board), and the Delong and Summers (BPEA 1988) model.

Figure 1: Output gap calculated using CBO potential GDP (black), HP filter applied to 1960-2024 (tan), Fleischman and Roberts/Fed Board 2 sided filter (light green), and pseudo-DeLong-Summers (1988) approach (blue). NBER defined peak-to-trough recession dates shaded gray. Source: BEA 2024Q1 advance, CBO (February), Atlanta Fed Taylor Rule utility data accessed 4/26/2024, NBER, and author’s calculations.
Note that the HP filter yields implausibly small (in absolute value) output gaps in the wake of the Great Recession. On the other hand, both band pass filters like the Baxter King, or the Hamilton filter which relies on a regression method of extracting the trend, indicate big drops and jumps in the trend associated with the Covid-19 recession (not shown).
The CBO “production function” approach to estimating trend is not as affected by the Covid-19 shock, and matches an economic interpretation better. However, it has been subject to substantial variation as estimates of productivity have shifted; and more recently, as immigration has affected the projected labor stock.
Jim Hamilton has a different interpretation of potential GDP which relies upon differentiated (by specialization) labor and capital supply and demand matching. Changes in the composition of demand relative to supply could then mean slack. However, I don’t have a time series of this interpretation of potential.
Another take on potential GDP is that we can’t take the usual trend-cycle decomposition for granted. Blanchard, Cerutti and Summers (2015) argue that the trend and cycle might be correlated. They observe that trend growth in GDP has typically declined in the wake of recessions. This is not a natural outcome in the standard view of business cycles. For instance, in the CBO production function approach, a recession should only affect trend growth only to the extent that decreased capital investment and discouraged workers might reduce potential (presumably a small amount). In a cross country analysis, they find that this is not the case.
I update the Blancard-Cerutti-Summers graph for the US, to include more of the post-Great Recession period, and the post-2020 recovery.
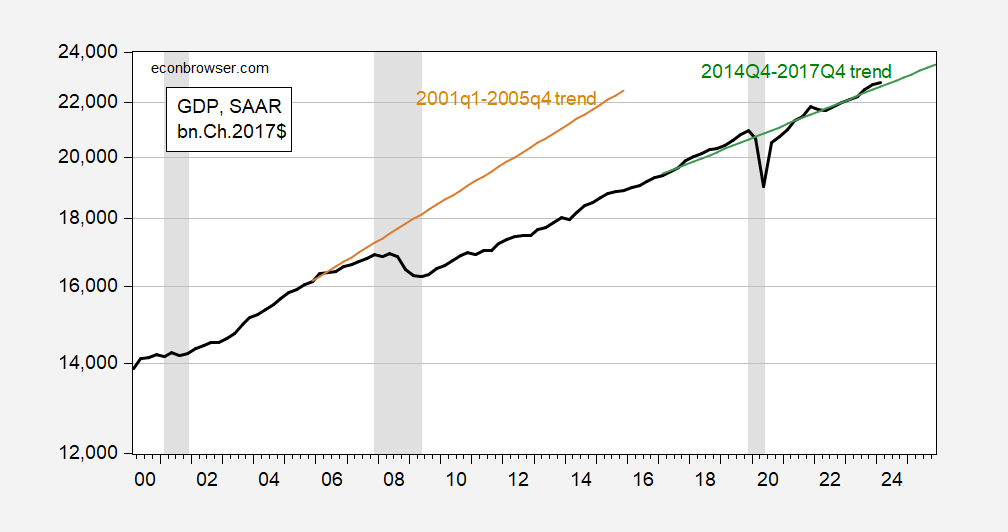
Figure 2: GDP (bold black), 2001-2005 linear trend (tan), and 2014-17 linear trend (green), all in bn.Ch2017$ on log scale. NBER defined peak-to-trough recession dates shaded gray. Source: BEA 2024Q1 advance release, NBER, and author’s calculations.
The BCS approach indicates a big mean and trend decline in the wake of the Great Recession. The recession could’ve occurred because agents perceived anticipated decline in the components of potential GDP (TFP, capital and labor stocks) as conventionally conceived, or because of scarring due to a damaged financial system, along with prolonged period of stagnant demand (due say to 50 Little Hoovers, including Wisconsin’s Governor Scott Walker).
Interestingly, the 2020 crisis has not apparently made a big impact on mean or trend GDP. This suggests that either the 2020 recession was not induced by a discrete downgrade in expectations regarding the components of potential GDP, or that scarring was avoided by prompt and energetic fiscal and monetary policies.
So the screams from the GOP and Fox News (and – yes- the “serious” mainstream media) for “fiscal austerity” during the Obama admin managed to suppress GDP for a decade. Good thing – the Dems and Biden admin managed to avoid that with public spending and responsible governance. (“The recovery since 2009 has been historically slow, and the disappointing pace can be explained entirely by the fiscal austerity imposed by Republicans in Congress.” https://www.epi.org/publication/why-is-recovery-taking-so-long-and-who-is-to-blame/#epi-toc-5 )
What is interesting to me – is that Biden admin progressive governance and historic investments in renewable energy that is moving us to a better future is just too boring for a lot of people Millions (if we are to believe the polling) would rather have a Trump dictatorship, suppression of our civil rights, deportation of millions, endless corruption by Trump cronies, failed responses to national health emergencies, and withdrawal from global climate change agreements.
They don’t even get that the only thing that is keeping this economy growing without a vicious wage-price increase circle is the “illegals”. Asylum seekers are filling a lot of jobs that would have to pay twice as much and just rob workers from one workplace to fill them into jobs at another. Biden has been lucky that his bluff worked and GOP blocked the (GOP designed) restrictions he had agreed to let them get. The labor markets are hot but not overheating.
Agreed. Taking the DeLong-Summers measure, the output gap was near 6% at the time.
I also found it interesting that their measure of the gap for 2003 was near 3%. And yet John B. Taylor insists that the FED back then kept interest rates too low for too long. Seriously?
MAGA moron Bruce Hall was peddling the idea that we should see GDP growth = 4% for the next 2 years. When Macroduck noted how stupid this claim was as Macroduck presented the CBO estimate of the output gap (negative 1%) and the premise that potential GDP growth was near 2% per year, Brucie digs up something that noted estimates of potential GDP differ. Yea but Brucie could not be bothered to present the alternative estimates. You have.
But wait – even the DeLong-Summers measure (the most ambitious in terms of estimating a high potential GDP) shows a zero gap now. NONE of these measures supports Brucie boy’s latest dishonest and utterly stupid claim. NONE of them.
EMPLOYMENT COST INDEX – MARCH 2024
https://www.bls.gov/news.release/eci.nr0.htm
Compensation costs for civilian workers increased 1.2 percent, seasonally adjusted, for the 3-month period ending in March 2024, the U.S. Bureau of Labor Statistics reported today. Wages and salaries increased 1.1 percent and benefit costs increased 1.1 percent from December 2023. (See tables A, 1, 2, and 3.) Compensation costs for civilian workers increased 4.2 percent for the 12-month period ending in March 2024 and increased 4.8 percent in March 2023. Wages and salaries increased 4.4 percent for the 12-month period ending in March 2024 and increased 5.0 percent for the 12-month period ending in March 2023. Benefit costs
increased 3.7 percent over the year and increased 4.5 percent for the 12-month period ending in March 2023. (See tables A, 4, 8, and 12.)
All figures representing nominal increases, which are just about the increase in the price level. So modest increases in real compensation.
I recall reading that the U.S. stands out among large developed economies in its failure (till recently) to recover to the prior output trend after recession. Guess I need to read Blanchard.
While I’m tempted by recent events to think the U.S. is often too stingy with fiscal support relative to other countries, that’s probably not true. We are certainly less stingy than Germany so while Japan was th champ, spend 5% of GDP vs the IMF’s recommendation of 2%. Other European countries did far more than Germany:
https://ifs.org.uk/articles/fiscal-responses-six-european-countries-great-recession-crisis-wasted
So possibly the lesson of cisurrent patterns in global growth is that all countries with the capacity for big fiscal expansion tend to do too little in crisis.
In the Covid episode, James surely has a point. The U.S. was top of the fiscal heap, certainly for direct spending. Lending is a different matter, perhaps evidence that preferring lending to fiscal expansion is a mistake:
https://www.imf.org/en/Topics/imf-and-covid19/Fiscal-Policies-Database-in-Response-to-COVID-19
Part of the post-mortem on this period should involve an assessment of the costs and benefits of various types and levels of response. The U.S. is the curent global growth champ, after a period as the fiscal support champ. The U.S. has not suffered worse inflation than other developed countries as a result. Will the IMF take these fact on board? Will other champions of fiscal restraint address these facts honestly? We’ll see.
This is – should be – an separate question from the assessment of longer-term fiscal policy. Limiting fiscal policy to moderate deficits in good times may be the right policy, in part because that would leave room for more fiscal expansion in times of need. I’m pretty sure Keynes thought so. Poppa Bush thought so. Baby Bush and Greenspan missed the point, as does Trump.
Speaking of relative performance, y’all saw this?:
https://www.bloomberg.com/news/articles/2024-04-30/boj-data-may-help-show-whether-japan-intervened-in-forex-market
No coordination, no acknowledgement, but official accounts suggest intervention. Odd. There is alway the possibility this was a response to a liquiity problem in fx markets – nobody lies one-way trade. I haven’t heard anything like that, but I haven’t been paying attention.
There was talk in the Japanese press that intervention was needed:
https://www.japantimes.co.jp/business/2024/04/28/markets/yen-drops-past-158/
Some things are better left unsaid. For instance “yen weakness isn’t creating inflation” from the head of the BOJ, while the Finance Minister was saying he’d do what is necessary to protect the yen. Mixed messages aren’t helpful. Ueda is new at this stuff, after all.
https://fred.stlouisfed.org/series/EXJPUS/
Did you know that the yen has devalued by almost 50% since early 2021? Of course you did but shhhh – don’t tell Princeton Steve. After all our favorite terrible consultant declared a yuan depreciation of only 15% to be some incredibly horrible event.
Now to real economics now that Stevie has left the room. The 10-year Japanese government bond rate is less than 1%. The yen devaluation is classic Dornbusch (1976). So maybe it is time for the BOJ to raise interest rates.
At least, at last, the BOJ has eased up on holding long-end rates down.
Marketplce, the business radio people, recently reported that nice houses in Japan’s countryside are going for $25,000 to $50,000. There are just huge structural differences between Japan and the U.S.
Here’s the underlying story:
https://fred.stlouisfed.org/graph/?g=1lzJ9
Despite a rocketing dependency ratio in Japan, GDP per capita is still rising. To the extent that government policy has played a role in that performance, we and the world should take note.