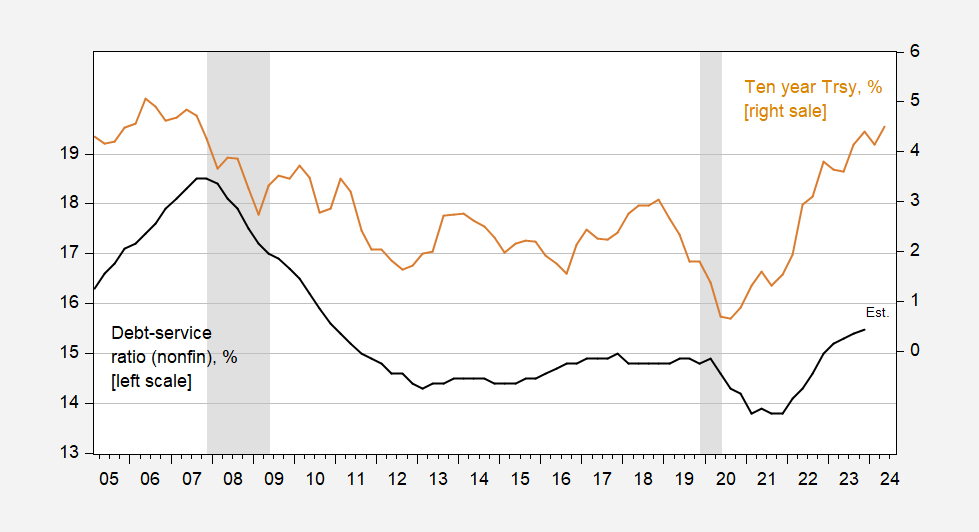
In yesterday’s post, I noted a recession forecast based on a probit specification incorporating a debt-service-ratio yielded a substantially lower probability for 2024M05 than a plain vanilla specification. Part of why this is true is that the debt-service ratio is fairly low, despite high Treasury yields.
Figure 1: Debt-service ratio for private nonfinancial sectorcorporations, % (black, left scale), and ten year Treasury yields, % (tan, right scale). 2024Q2 yield is based on first half of quarter. 2023Q4 debt-service ratio estimated by author using first differences specification described here. Source: BIS, Federal Reserve via FRED, NBER, and author’s calculations [corrections 4:17pm]

To derive the DSRs on an internationally consistent basis, the BIS applies a unified methodological approach and uses, where available, input data compiled on an internationally consistent basis (total stock of debt, income available for debt service payments, average interest rate on the existing stock of debt and the average remaining maturity). Although the applied methodology is subject to an approximation error when aggregate data are used, it correctly captures how the DSR in a particular country changes over time. However, it may not accurately measure the DSR level compared with the result that may be obtained from micro data. – BIS
Just guessing as I have not done sufficient research on this approach but two questions:
(1) The average interest rate likely captures corporate debt where credit ratings are generally not as good as AAA – right or am off base here?
(2) Are these nominal interest rates? Doing this in real terms might paint a rosier and more accurate picutre.
pgl: When I predict and nowcast the DSR, I use ten year Trsy, AAA as well as two lags of DSR (in first differences). AdjR2 around 0.55 if I recall correctly. These are nominal rates. Real 10 year interest rates go up farther and faster (either using TIPS or expectations to adjust nominal).
Professor Chinn,
I notice there are two data series sets related to non-financial sector/corporations.
1. United States – Debt service ratio Private non-financial sector, with the most recent ratio of 15.2%.
2. United States – Debt service ratio non-financial corporations, with the most recent ratio of 42.2 %.
I may have missed the BIS discussion about both.
Debt service ratios – overview | BIS Data Portal
AS: Thanks for catching that! I have corrected the legend to the figure.
Link to data
https://data.bis.org/topics/DSR/BIS,WS_DSR,1.0/Q.US.P