of 2022H1, in light of his declaration of recession now. From August 1, 2022, from Heritage Explains episode “Biden’s Recession”:
In terms of how we define it or what marks a recession, the basic understanding is that when the economy shrinks for two consecutive quarters, so three months, and then another three months, that’s a recession. The reason that the White House has been making a lot of hay of, oh, that’s not official definition, blah, blah, blah. Okay. I suppose there is no technical official definition, but I’ve taught plenty of economics courses. That was what we used in every single class. That’s what you’ll see in most, if not all economics textbooks. That’s been the understanding for the last 100 years. So the idea that this is somehow new or not true, I dismiss that out of hand.
As it happens, this is what I wrote on that same day:
If one took GDP as the determinant of NBER determined business cycles, this is what the picture would look like (normalizing on mid-Q4):
Figure 1: Nonfarm payroll employment (bold dark blue), Bloomberg consensus as of 8/1 (blue +), civilian employment (orange), industrial production (red), personal income excluding transfers in Ch.2012$ (bold green), manufacturing and trade sales in Ch.2012$ (black), consumption in Ch.2012$ (light blue), and monthly GDP in Ch.2012$ (pink), official GDP, 2022Q2 advance (blue bars), all log normalized to 2021M11=0. Source: BLS, Federal Reserve, BEA via FRED, IHS Markit (nee Macroeconomic Advisers) (8/1/2022 release), NBER, and author’s calculations.
The six plotted series are those focused on by the NBER Business Cycle Dating Committee, in addition to official BEA GDP, and IHS Markit’s monthly GDP (not currently on the list). Of the key six, nonfarm payroll employment (black) and personal income ex-transfers are given more weight.
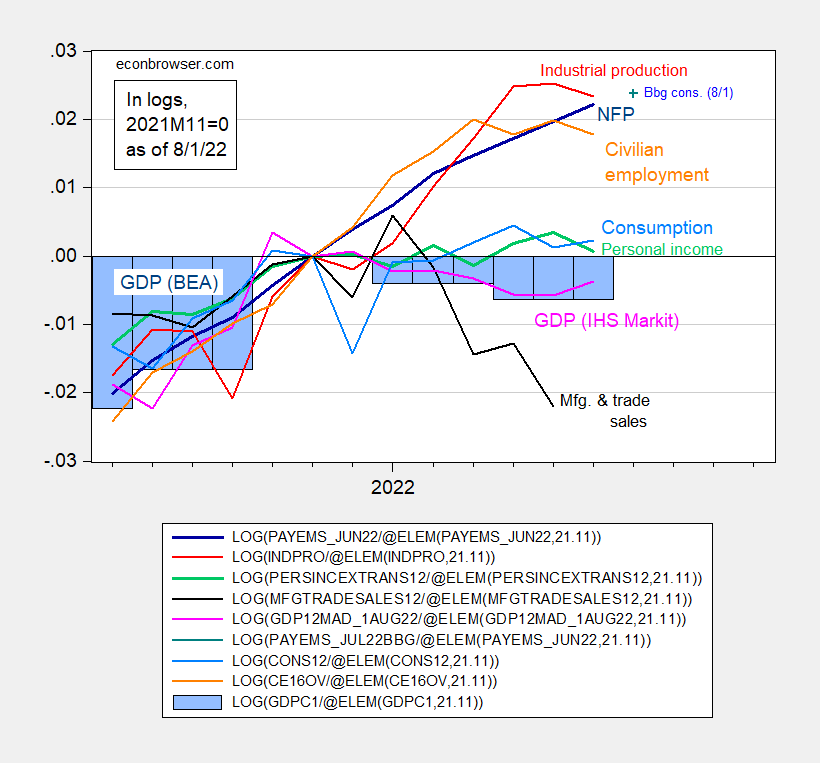
Note that these are “real time” data (i.e., what we actually knew at that time). While personal income was trending sideways, nonfarm payroll employment was rising strongly. Arguments that employment was actually falling seem in retrospect dubious (and even at the time).
Here’s the current vintages picture of economic activity during this period.
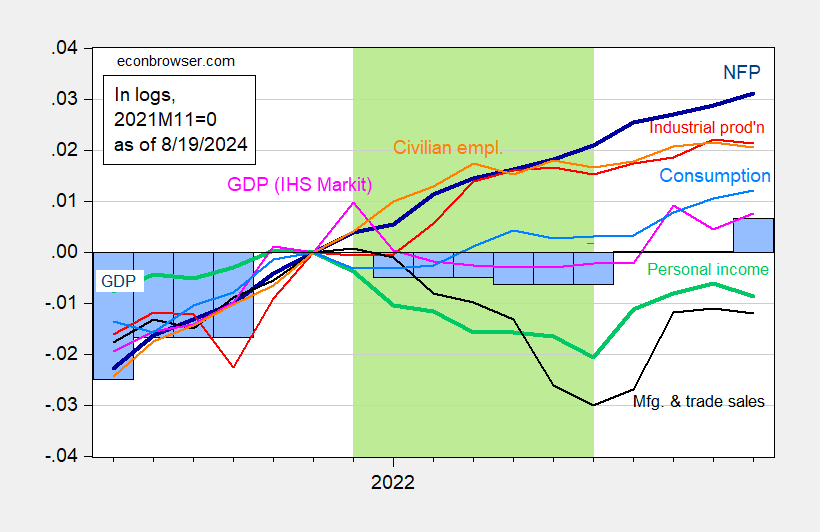
Figure 2: Nonfarm payroll employment (bold dark blue), civilian employment (orange), industrial production (red), personal income excluding transfers in Ch.2017$ (bold green), manufacturing and trade sales in Ch.2017$ (black), consumption in Ch.2017$ (light blue), and monthly GDP in Ch.2017$ (pink), official GDP, 2024Q2 advance (blue bars), all log normalized to 2021M11=0. Hypothesized 2022H1 recession shaded light green. Source: BLS, Federal Reserve, BEA via FRED, IHS Markit (nee Macroeconomic Advisers) (8/1/2022 release), NBER, and author’s calculations.
Notice the contours look different for several series. This is a reminder that the data get revised.
If you’re still worrying about NFP (birth-death model and all that stuff), remember there’s been a benchmark revision since the 2022 data. Here’s what the data look like now, for NFP, QCEW and population from the household survey.
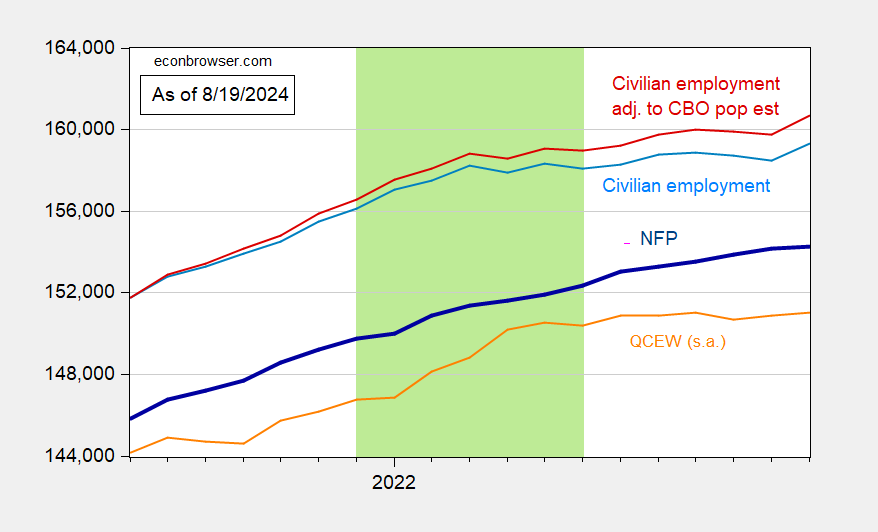
Figure 3: Nonfarm payroll employment (bold blue), QCEW total covered employment (orange), civilian employment as reported (light blue), adjusted to add in extra 3.8 mn immigrants (red) (see text), all in 000’s, seasonally adjusted. QCEW seasonally adjusted by author using X-13 in logs. Hypothesized 2022H1 recession shaded light green. Source: BLS, Dallas Fed, and author’s calculations.
The calculation of the adjusted civilian employment series is reported in this post.
Dr. Antoni’s argument is focused on the two-quarter GDP rule-of-thumb. We know that GDP is subject to large revisions over time, so even if one hewed to the two-quarter rule-of-thumb, one could get different answers over time. GDO and GDP+ are alternative measures.
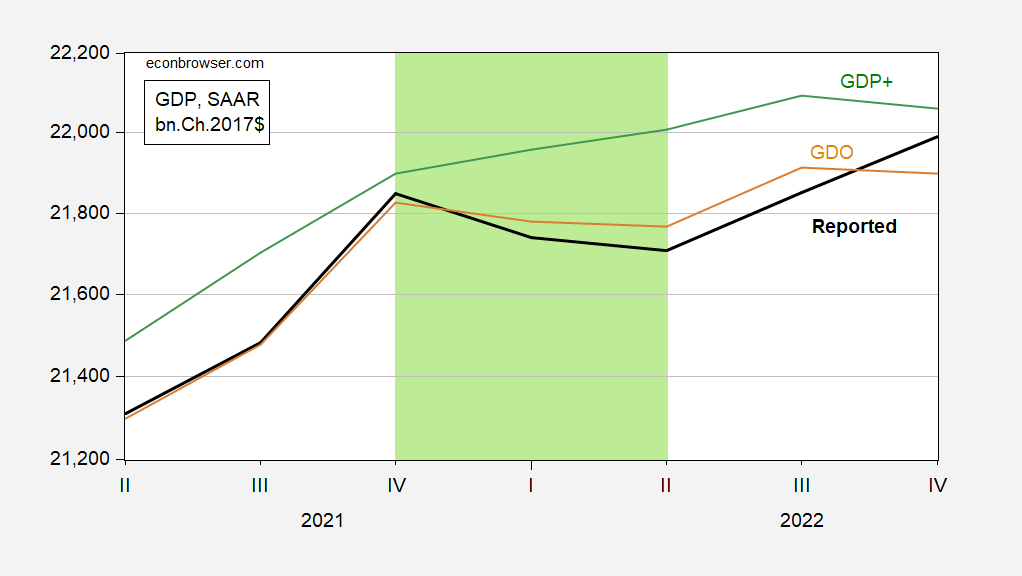
Figure 4: GDP (bold black), GDO (tan), and GDP+ (sky blue), all in bn.Ch.2017$ SAAR. GDP+ scaled to 2019Q4 GDP. Hypothesized 2022H1 recession shaded light green. Source: BEA, Philadelphia Fed, author’s calculations.
So, recession in 2022? I don’t think so. Finally, remember this assertion:
[The 2 consecutive quarter rule] was what we used in every single class. That’s what you’ll see in most, if not all economics textbooks. That’s been the understanding for the last 100 years.
Not true in the textbooks I used. I don’t know what textbooks Dr. Antoni used. My suggestion. Look at the data, in particular, GDP growth over a longer span.
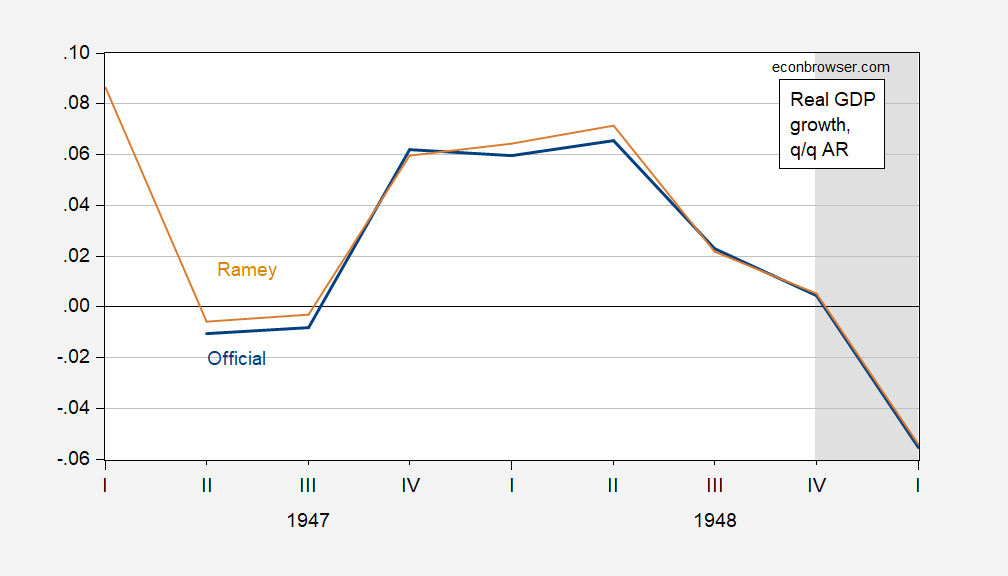
Figure 5: Quarter-on-Quarter real GDP growth annualized for official series (blue), and for Ramey series (tan). NBER defined peak-to-trough recession dates shaded gray. Source: BEA, Valerie Ramey, NBER, and author’s calculations.
Note NBER does not date a recession to 1947, when there were two consecutive quarters of negative growth.
https://www.zillow.com/home-values/25574/lexington-ky/?msockid=3f4cc8c934ca66d43a21da10354067e9
Gee – Zillow says the average price of a house in Lexington Kentucky is just over $300,000. I’m shocked as I just saw Art Laffer tell his Faux News audience you could buy a house in Kentucky for $25,000. Yea – Laffer was mocking the Harris housing plan by being a jacka$$ and a dumba$$ at the same time. I wonder if Laffer was shopping for a house where those AppHarvest workers got screwed by JD Vance?
“Note NBER does not date a recession to 1947”
Nobel Prize winning economist (in his own mind) said we had a recession in 1947. Or was that a suppression?
I’m apologize in advance for asking a stupid question (also Canadian, so, you know) but I’m baffled by Figure 2. The caption says “2024Q2 advance (blue bars)”, but there are four blue bars in 2021, one blue bar that appears to straddle 2021-22, then six blue bars in 2022, a gap of three x-axis units (months?) and then another blue bar. They can’t all be 2024Q2 advance, cam they? I thought perhaps they were quarterly GDP repeated for each month of the relevant quarter, but then why are there white spaces at the end of 2021 and the middle of 2022?
HB: Good question. This is the series as of the vintage reported in July 2024. That means they have gone through the benchmark revision, which usually takes place in September these days. They bars are repeated because we have only quarterly frequency official GDP data in the US (unlike in the UK). No bars visible in 2022Q3 because GDP is essentially the same in 2022Q3 as in 2021Q4.
@ HB I’m always jealous of other students who ask solid questions, My father majored in Education as his Masters degree, My father grew up on a farm in rural Iowa, My father told me many times “there’s no such thing as a dumb question” (even though my father reamed me out for asking this type questions all my life). But I feel my Dad didn’t feel it was ever bad to ask questions,
I have some leftover steak which may become tonight’s dinner so let’s talk about this series:
Average Price: Steak, Sirloin, USDA Choice, Boneless (Cost per Pound/453.6 Grams) in U.S. City Average
https://fred.stlouisfed.org/series/APU0000703613
OMG! $11.70 a pound. That’s so high. Blame Biden – right? Oh wait – it was that high in October 2021. Funny thing – steak has always been expensive. Now the market power of JBS and other meat processors might have something to do with that. But if Kamala Harris proposed a sensible plan to reduce this market power – MAGA morons like Bruce Hall start screaming Marxism. Even though they whine and blame Biden. Go figure!
Hey pgl friend, you cut the steak in half and add a vegetable. Economists call it “substitution”
Lots of peppers, onions, and mushrooms. Yummy and healthy!
Heh, agree with you my Brother. Damn you took the words out of my mouth, But my Mom, Mom has Kidney problems now, Poattasium, NO, Calcium, NO. Protein, MINIMUM. Abused herself all her life. Like her Body is a garbage compactor, It makes me sad. Here we are friend (I wanna use your real name here, in freindliness) Here we are “”deal with it” Drive you insane my Brother, pgl
We expect that the US population will stabilize, then begin falling. Because the GDP is calculated without normalization to population size I am wondering if we in the future will see a lot more mild “recessions” during normal ups and downs of the economy.
” but I’ve taught plenty of economics courses.”
this would be an exaggeration. substituting for a year teaching somebody else’s courses because they could not find anybody else in that part of illinois to teach does not really classify somebody as having taught “plenty” of courses. that is a pretty big exaggeration. do not confuse this dude with an educator. he most certainly is not. he was in front of the classroom for a very short time. makes you wonder what else is inaccurate or an exaggeration in antoni’s body of work?
“I suppose there is no technical official definition, but I’ve taught plenty of economics courses. That was what we used in every single class. That’s what you’ll see in most, if not all economics textbooks. That’s been the understanding for the last 100 years.”
For the last 100 years in all economics textbooks? Is this dude a joke or what?
I also loved this one:
“these people don’t worry about the price of food. They don’t even cook their own food.”
I cook my own food. And if you have read what I have written on this hot topic versus the lazy trash from the right wingers, you’d realize they are mailing it in while Harris and the people that support here get agricultural economics.
https://www.nber.org/system/files/chapters/c2980/c2980.pdf
Measuring Business Cycles
Arthur F. Burns and Wesley C. Mitchell
NBER
Publication Date: 1946
Antoni claims business cycles have been defined in his simplistic way in every economic textbook for 100 years. Really? The seminal paper on this topic was not written until 1946 not 1924. And Antoni needs to READ this paper as he has no clue what he is babbling about.
BTW, BEA did not start recording quarterly data on real GDP until 1947. I bet Antoni does not know this either.