Lewis/Mertens/Stock and Baumeister/Leiva-Leon/Sims weekly indicators, and Torsten Slok’s rundown.
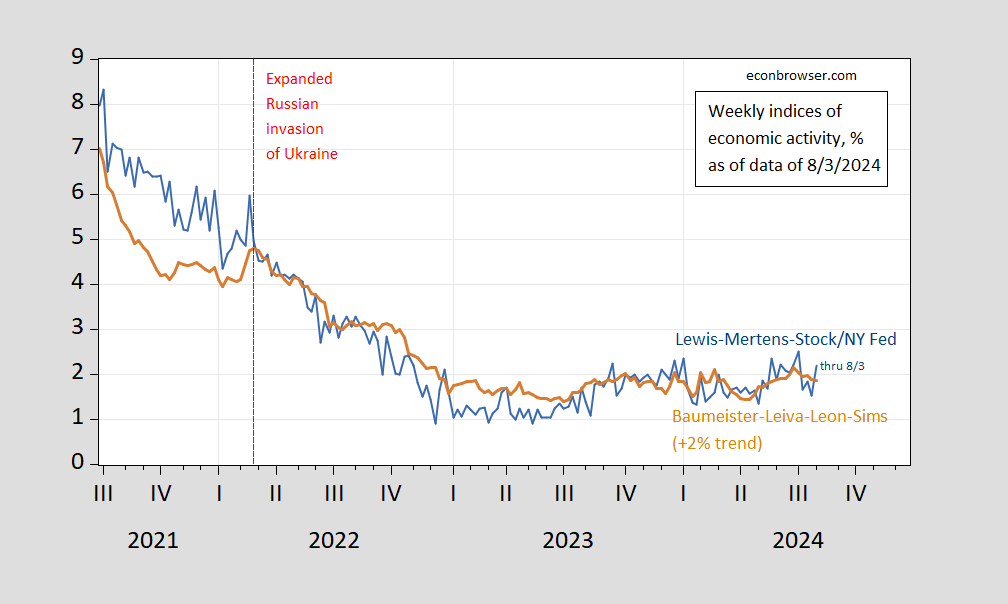
Figure 1: Lewis/Mertens/Stock Weekly Economic Index (blue), and Baumeister/Leiva-Leon/Sims Weekly Economic Conditions Index for US plus 2% trend (tan), all y/y growth rate in %. Source: NY Fed via FRED, WECI, accessed 8/10/2024, and author’s calculations.
Growth by both indicators is around trend.
What did these series look like for the period surrounding the 2008 recession (keeping in mind these are the current vintages, not the real time versions):
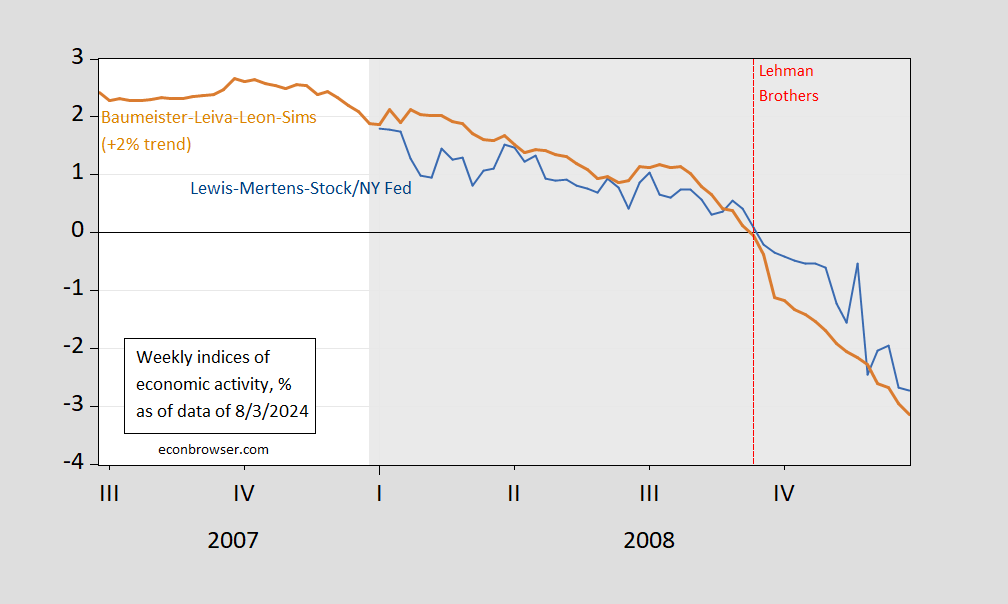
Figure 2: Lewis/Mertens/Stock Weekly Economic Index (blue), and Baumeister/Leiva-Leon/Sims Weekly Economic Conditions Index for US plus 2% trend (tan), all y/y growth rate in %. Source: NY Fed via FRED, WECI, accessed 8/10/2024, and author’s calculations.
So, comparing, it doesn’t look very recessionary for data available as of 8/3.
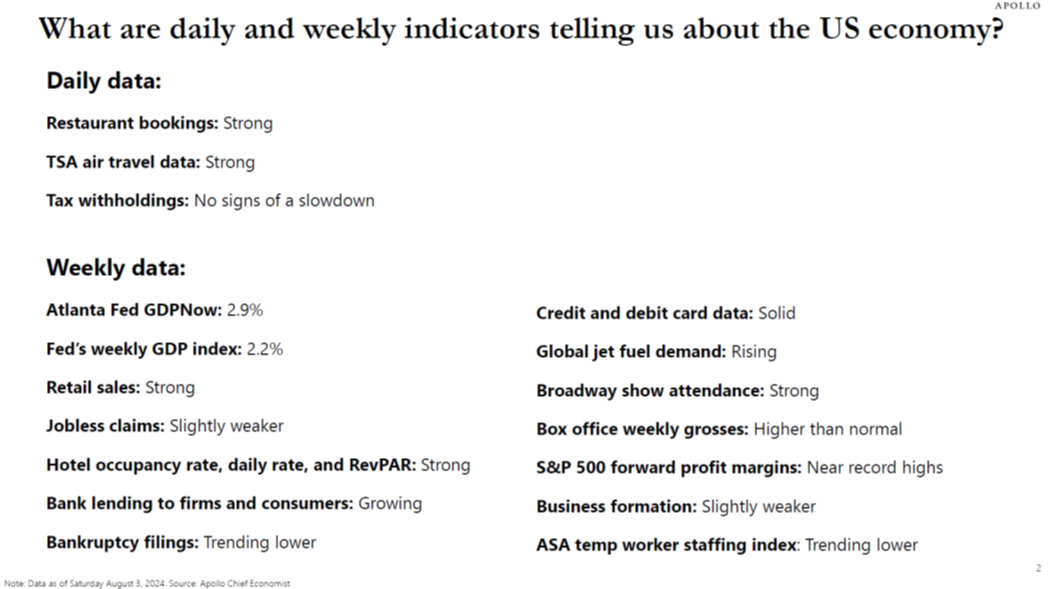
As promised, here’s Torsten’s summary of his Daily and Weekly Indicators for the US Economy chartbook (released today):
But Donald Trump has Steve Koptis working on some metrics to suggest the US is heading for its worst Depression ever. Or was that the worst Suppression ever?
Team Trump is pretending Iran has hacked their communications:
https://www.msn.com/en-us/news/politics/trump-campaign-says-they-have-been-hacked/ar-AA1ozZJx?ocid=msedgdhp&pc=U531&cvid=90cf3e4d55ad4cc395ba27dc654eda2d&ei=9
False flag perhaps? Even if this is true – it shows that these clowns are too incompetent to run our government.
https://www.predictit.org/markets/detail/6867/Which-party-will-win-the-2024-US-presidential-election
Harris 58 cents
Trump 44 cents
Hey little Ricky Stryker boy – how’s that Harris short working out for you? Oh well – maybe you can sell some of your Trump Media stock for less than $26.20 a share!
While probably not all that reliable, profit margins do tend to turn lower well ahead of recessions. Not saying forward margins, because I’m not an equity guy and don’t know about forward margins. Actual margins generally cool mid-to-late cycle. Not clear that the peak has happened yet:
https://fred.stlouisfed.org/series/A463RD3Q052SBEA
Of course, this time really is different, thanks to Covid, for what that’s worth.
“Profit per unit of real gross value added of nonfinancial corporate business”
Let’s keep in mind that value added is less than reported sales (latter including cost of intermediate goods) so a 20% profits per unit of value added is more than a 10% operating margin if the cost of material goods is 50% of sales.
I will say this metric is a lot higher than it was many years ago. Why exactly – not entirely sure.
Service industries have fewer raw materials costs?
They do but then some service providers use subcontractors so the issue of gross revenue v. value-added is still present depending on how the bean counters count things.
Corporate profits, particularly as deflated by unit labor costs, were identified as early as 50 years ago as being a long leading indicator, I.e., they turn down at least one year before a recession.
They did peak in q2 2022, but as we all know now, there was no recession in 2023 (thank you. lower gas prices and global supply tightness unspooling!). In general they turned up beginning in Q1 2023. Unfortunately the GDP version for Q2 2022 won’t be reported until the end of this month, but the S&P version shows continued nominal growth of over 5% for the quarter.
I continue to be a little skeptical of Torsten Slock’s update. Partly this is because of the method of presentation, and partly because he does not attempt to mark his ratings to historical precedent.
As to the latter, we know for example that initial jobless claims are a short leading indicator. But what about, e.g., hotel occupancy? And the YoY growth in overall bank lending, if anything, has been a lagging indicator (see.e.g., 2008). Without knowing their historical pattern, the summary becomes a mishmash.
As to the former, he says that bankruptcy filings are trending lower. But there is so much weekly and monthly noise that (imo) you really have to track YoY. And when you do that, as BankruptcyWatch.com does, you see that filings have trended higher YoY for at least 2 years. But again, without knowing historical context, does that mean “recession ahead” or just a less-booming economy?
The Lewis-Mertens-Stock Index does a much better job (again, imo) of amalgamating most of these same high frequency indicators via an algorithm into an index. It’s shortcoming is that is less than 20 years old, and the recession onset threshold value is probably 1 rather than 0.
My only immediate worry as to the next several months is whether the QCEW-based benchmark revisions coming next month completely upend the nonfarm payrolls growth we have believed has been continuing for the past 12 months.
Bankruptcy tends to follow interest rates and profits – no surprise. Rising bankruptcies are a curiosity as part of the interert-rate transmission mchanism. Are bankruptcies “transmitting” as powerfully as normal?
We have so far had an odd late cycle with regard to interest rates; there’s been a sharp rise in real rates and an inverted curve, but so far with no recession. And profits still high, so maybe not late cycle yet.
Couple of things… If there is a heavy share of bankruptcies in reorganization, not much in the way of liquidation, that suggests interest payments are the major problem. High profits argue against the need for liquidation. It could be we are seeing a case of good business conditions overall, but heavily-indebted firms ambushed by unexpected and persistent high rates.