With the industrial production release today (+0.8% vs. +0.2% m/m consensus), we have the following picture of key series followed by the NBER’s BCDC:
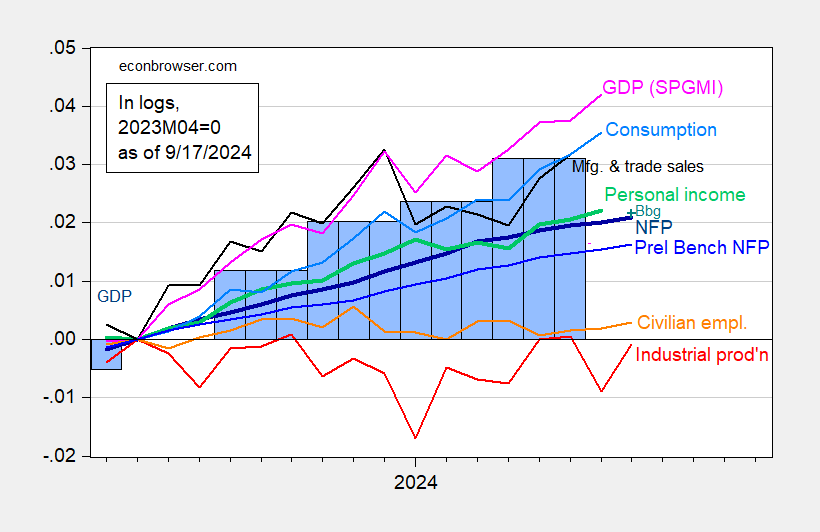
Figure 1: Nonfarm Payroll (NFP) employment from CES (bold dark blue), Bloomberg consensus of 9/6 for NFP (blue +), implied NFP from preliminary benchmark (blue), civilian employment (orange), industrial production (red), personal income excluding current transfers in Ch.2017$ (bold green), manufacturing and trade sales in Ch.2017$ (black), consumption in Ch.2017$ (light blue), and monthly GDP in Ch.2017$ (pink), GDP (blue bars), all log normalized to 2023M04=0. Source: BLS via FRED, Federal Reserve, BEA 2024Q2 2nd release, S&P Global Market Insights (nee Macroeconomic Advisers, IHS Markit) (9/3/2024 release), and author’s calculations.
Note that the incorporation of the preliminary benchmark (which might overstate the eventual NFP downshift — see here) still shows continued growth through 2024M08.
Some alternative indicators — coincident index for monthly GDP, Philadelphia Fed’s early benchmark for official (pre-benchmarked) NFP, manufacturing production for industrial production, retail sales for manufacturing and trade industry sales — in Figure 2. Retail sales +0.1% vs. -0.2% m/m consensus).
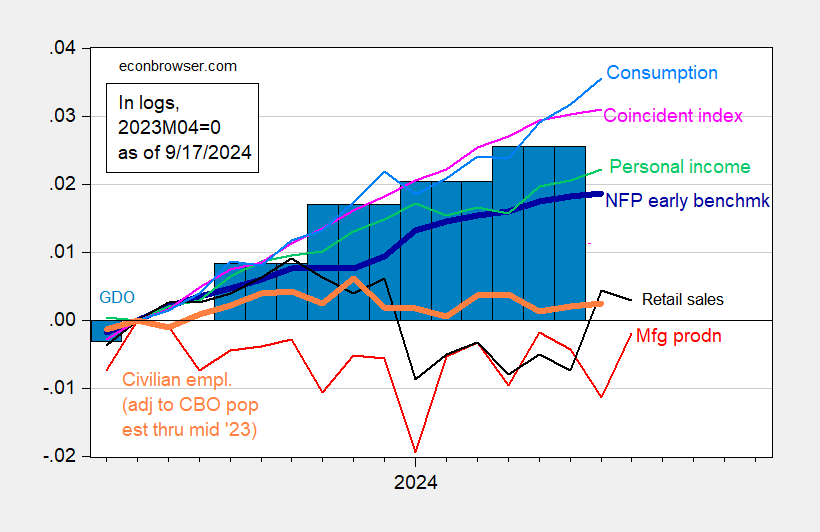
Figure 2: Nonfarm Payroll early benchmark (NFP) (bold blue), civilian employment adjusted using CBO immigration estimates through mid-2023 (orange), manufacturing production (red), personal income excluding current transfers in Ch.2017$ (light green), retail sales in 1999M12$ (black), consumption in Ch.2017$ (light blue), and coincident index (pink), GDO (blue bars), all log normalized to 2023M04=0. Early benchmark is official NFP adjusted by ratio of early benchmark sum-of-states to CES sum of states. Source: Philadelphia Fed, Federal Reserve via FRED, BEA 2024Q2 second release, and author’s calculations.
None of the indicators seem to show a downturn in August, although production — and more recently retail sales — have shown some sideways-trending. However, we still need to see personal income ex-transfers (a key indicator followed by the NBER’s BCDC) and consumption for August.
GDPNow as of today is 3.0% q/q AR for Q3. Goldman Sachs has upped its tracking estimate to 2.8%.
https://finance.yahoo.com/quote/DJT/
Trump Media & Technology Group Corp. (DJT)
That mini bump in this share price from Trump claiming he has no intent to sell his shares is now over. I guess the market is no long falling from his Pump and Dump scheme.
@ pgl From your keyboard to God’s computer monitor.
industrial production is screwed up by seasonal adjustments which reflect the impact of supply chain issues during the worst of the pandemic….historically, auto manufacturers have shut down in July to retool for the new models, and hence July’s auto manufacturing index was boosted by a seasonal adjustment on the order of 30%….because a number of auto manufacturers did not shut down in July during the pandemic years to take advantage of available supply, seasonally adjusted auto manufacturing jumped in those years…the effect of those spikes was to revise the upward July seasonal adjustment for auto manufacturing from around 30% to 20%, and to similarly reduce the downward August seasonal adjustment to auto manufacturing from around 30% to 20%…with the July shutdown for retooling back to normal for this year, the pandemic impacted seasonal adjustments resulted in what the Fed reports as “a recovery in the index of motor vehicles and parts, which jumped nearly 10 percent in August after dropping roughly 9 percent in July“, as if they have no idea as to why….without that, manufacturing rose 0.3% in August and industrial production for both July and August would be close to unchanged…
seeing this happen with this release has me wondering what other seasonal adjustments have been skewed by distortions from the pandemic years…